Vol. 4, Issue 4, April 2015
Implementation of Edge Detection Algorithm
Using FPGA
Harshada Shimpi
1, NishaGaikwad
2, Meghana Dhage
3, Prof.A.S.Pawar
4UG Student, Dept. of E&TC Engineering, PCCOE, Pune, Maharashtra, India 1,2,3 A.P. Dept. of E&TC Engineering, PCCOE, Pune, Maharashtra, India 4
ABSTRACT: As in today‟s generation processing of images plays a very important role. So this paper describes the
implementation of edge detection algorithm. The algorithm used is SOBEL. It is used in various applications as medical image processing, object detection, security etc. The main aim behind this is to process the image and use it in various applications using FPGA. After reading the pixels of an image the algorithm is applied in VERILOG. After processing the image on FPGA the edge detected image is displayed on monitor. The FPGA used is „SPARTAN-6‟. The entire simulation of the above process is done VERILOG using „XILINX-14.1‟. And to display input and output image MATLAB is used.
KEYWORDS: FPGA, Verilog, Spartan-6, Edge detection, Sobel operator.
I.INTRODUCTION
Image processing is widely used in many applications. It is having many advantages. The heart of all these image processing applications is the edge detection. Edge detection can be used in various medical applications such as tumour detection in human body. So using only edge detection algorithm the location of the tumour is detected. Also it can be used in security purpose, object recognition, object tracking, face identification etc.
This paper shows the results of SOBEL OPERATOR. The parallel processing capability of FPGA makes an advantage of using it for image processing. The main concept is to apply the fixed mask values of SOBEL OPERATOR on image. This reduces the complexity of algorithm. FPGA is a reconfigurable device and because of use of such devices the time to market cost reduces. Also it becomes easy for verification and debugging.
II.LITERATURE SURVEY
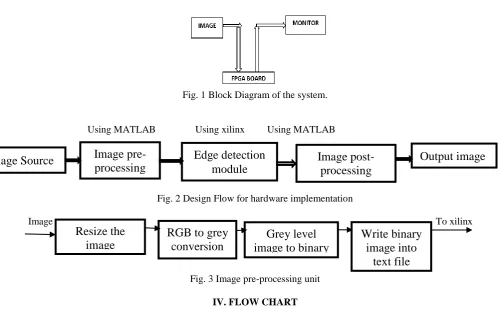
III.BLOCK DIAGRAM
The block diagram of the Edge Detection system is as shown in figure [1].It gives the idea of the overall functioning of the system. There are three main blocks of the system: Input Image, FPGA Board and monitor. The fig.[2] shows the design flow for hardware implementation of the system. Firstly the image is taken from the computer. Then the image is given to the pre-processing unit. The pre-processing unit is shown in fog. [3]. In this unit the image is converted into 128*128 size image. Then the RGB image is converted into the grey scale image. As the VERILOG cannot handle the standard image formats the grey level values of the intensities are converted into binary value and it is written on the text file and the text file is given to the Edge detection module which is coded in VERILOG. The pre-processing and post-processing on the image are done in MATLAB. After that the entire code is processed on FPGA Board. The processed data is then given to the monitor using UART protocol. And the resultant edge detected image is observed on monitor.The block diagram of the system as follows:
Fig. 1 Block Diagram of the system.
Using MATLAB Using xilinx Using MATLAB
Fig. 2 Design Flow for hardware implementation
Image To xilinx
Fig. 3 Image pre-processing unit IV. FLOW CHART
The Flow Chart of the system is shown in below figure. It shows the stepwise working of the algorithm.
FLOW CHART DESCRIPTION:Initially after START the image is read i.e. its pixel values are read. Then that image is convolved with the filter. After the horizontal and vertical mask of the operator are convolved with the original image. Let the horizontal and vertical convolution be Gx and Gy respectively. Then one threshold value is set as say T. Calculate gradient G. It is calculated as {square root[(Gx^2)+(Gy^2)]}. Then consider first pixel say „M‟. For M if G is greater than T then consider the next neighbouring pixel and continue the procedure. When G is less than T mark that pixel as it locates the edge. The mask values for Gx and Gy of SOBEL OPERATOR are :
Gx=
-1 0 1
Image Source
Image
pre-processing
Edge detection
module
Image
post-processing
Output image
Resize the
image
128*128
RGB to grey
conversion
Grey level
image to binary
image
Write binary
image into
text file
Vol. 4, Issue 4, April 2015
Flow chart for the system:
START
Read the image and
convolve with filter.
Convolve the resultantimage with chosen
Operator‟s gradient mask in i axis
Convolve the resultantimage with chosen
Operator‟s gradient mask in j axis.
IS
G>T
Mark pixel as an “edge”.
END
Set a threshold value, T.
For a pixel say M (i, j).
Compute the gradient
Magnitude say G
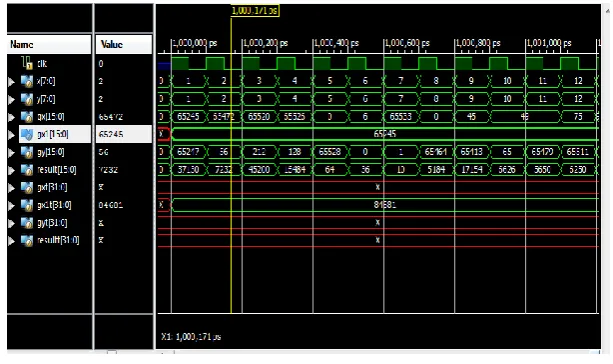
.V.RESULTS
1) The comparison of different operators:The fig. [4] Shows the comparison of different operators. Image in
the first column shows the original image which we want to process. Here the image is grey scale image. The first row shows the result of Robert Operator, second row shows the result of Sobel operator and third row shows the result of Prewitt operator. We can conclude from the below result that the „Sobel operator‟ gives more sharp results.
Fig. 4Comparisonof 3 operators in Matlab
2) The Square calculation of one pixel i.e. Gx^2:The fig.[5] shows the calculation of square of gradient in
x-direction. It shows the square of one pixel. For the calculation of resultant magnitude we require the square of the gradient in x-direction and in y-direction. Here the„gx1t = 84681‟ is the value of the gradient.
Vol. 4, Issue 4, April 2015
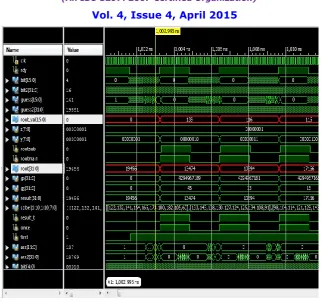
Fig. 6Resultant gradient calculation VI.CONCLUSION
We have successfully compared all the operators in MATLAB. And by implementing this system we conclude that the SOBEL OPERATOR gives more accurate results. The hardware used is Spartan-6(XC6SLX16). We have calculated the gradient in VERILOG. We also conclude that the testing and changing of the parameters became easy. One can easily change the different mask values observe the changes.
REFERENCES
[1] Paper „Implementation of Edge Detection algorithm using FPGA‟ ICICES-2014 under Prof. S.S Pujari, Miss. Sofia Nayak
[2]FPGA Implementation for Image Processing Algorithms Using Xilinx System Generatorby Neha. P. Raut ,Prof.A.V.Gokhale in IOSR Journal of VLSI and Signal Processing (IOSR-JVSP) Volume 2, Issue 4 (May. – Jun. 2013), PP 26-36 e-ISSN: 2319 – 4200, p-ISSN No. : 2319 – 4197
www.iosrjournals.org
[3] FPGA Based Edge Detection Using modified sobel Filter by Dr. Abdulsattar M. Khidhir, NawalYounis Abdullah in International Journal for Research and Development in Engineering (IJRDE)www.ijrde.com Vol.2: Issue.1, June-July 2013 pp- 22-32
[4] „Digital Image Processing‟, By Gonzallis& Woods
[5]FPGA Implementation for Image Processing Algorithms Using Xilinx System GeneratorIOSR Journal of VLSI and Signal Processing (IOSR-JVSP) Volume 2, Issue 4(2013), PP 26-36 e-ISSN: 2319 – 4200, p-ISSN No. : 2319 – 4197 www.iosrjournals.org
[6] http://www.xilinx.com/support/documentation/user_guides/ug070.pd
[7] FPGA based Edge Detection using modified Sobel Filter, International Journal for Research and Development in Engineering (IJRDE)
[8]FPGA IMPLEMENTATION of SOBEL EDGE DETECTOR under V. KamatchiSundari& M. Manikandan, P.Prakash inInternational Journal of Advances in Science and Technology (IJAST)