Volume 2, No. 4, July-August 2011
International Journal of Advanced Research in Computer Science
RESEARCH PAPER
Available Online at www.ijarcs.info
Performance Evaluation of Mobile Ad Hoc Network Routing Protocols under Heavy
Application Traffic flow
Pavneet Kaur*& Gaurav Mittal
Department of Electronics and Communication Engineering, Bhai Gurdas Institute of Engineering & Technology, Sangrur, Punjab, India
[email protected] [email protected]
Abstract: Mobile Ad Hoc Networks are autonomous and decentralized wireless systems. This paper focuses on performance evaluation of reactive, proactive and hybrid MANET routing protocols, namely AODV, OLSR and GRP under heavy applications, such as high resolution video conferencing, HTTP heavy browsing. Network performance is evaluated in terms of end to end delay, retransmission attempts, network load throughput. Simulation results shows that the overall performance of proactive protocols performs better than both reactive and hybrid protocols.
Keywords: High Resolution Video Conferencing, HTTP Heavy browsing, Mobile Ad hoc Networks, OPNET, Routing Protocols.
I. INTRODUCTION
Mobile Ad Hoc Networks (MANETs) is wireless network that transmits from computer to computer to which all computers must communicate. MANETs consist of mobile nodes that are free in moving in and out in the network. Nodes are the systems or devices i.e. mobile phone, laptop, personal digital assistance, MP3 player and personal computer that are participating in the network. Several routing protocols have been proposed for the successful deployment of MANETs. The protocols differ in terms of routing methodologies and the information used to make routing decisions. The main issue of MANET is the breakage of link at certain moment and regeneration of link at certain state as it consists of routers, which are mobile in nature that are independent to roam in an arbitrary motion.
A simulation based performance investigation of reactive and proactive MANET routing protocols, namely AODV, DSR, TORA and OLSR is done by [1]. Where it is assumed that with regards to overall performance, AODV and delivering packets over heavily trafficked network compared to OLSR and TORA. Effect of various mobility models on the performance evaluation of MANET routing protocols [2,3]. OLSR performed pretty well. However, AODV showed better efficiency to deal with high congestion and it scaled better by successfully.
This paper presents the, various reactive, proactive and hybrid protocols are going to be evaluated under the applications generating heavy traffic load. Various matrices are used to gather information about the behavior of the protocols under these heavy applications. The paper is organized as follows: section II discusses the routing protocols, section III discusses about simulation environment with high and low density network. Wireless parameters are discussed in section IV. The simulation results show that the AODV protocols in Random Waypoint mobility model performs better than DSDV, TORA and DSR in Random walk and random Direction mobility model. Based on the observations, it is to suggest that AODV routing protocol can be used under high mobility
since it outperforms DSDV, TORA and DSR protocols are discussed in section V. The conclusion along with future research directions are discussed in section VI.
II. ROUTING PROTOCOLS
In MANET, routing protocols are divided in three categories: Proactive protocols, Reactive protocols and Hybrid protocols. Proactive protocols are also known as table driven protocols. Table-driven protocols might not be considered an effective routing solution for MANET. Nodes in mobile ad-hoc networks operate with low battery power and with limited bandwidth. There are various examples of proactive protocols, like OLSR, DSDV, CGSR, WRP etc. Reactive protocols are also known as on-demand protocols. On-demand routing protocols were designed to reduce the overheads in networks by maintaining information for active routes only. This means that routes are determined and maintained for nodes that require sending data to a particular destination. Various examples of reactive protocols are AODV, DSR, CBR, ABR etc. Hybrid routing protocols inherit the characteristics of both on-demand and table-driven routing protocols. Such protocols are designed to minimize the control overhead of both proactive and reactive routing protocols. ZRP is an example of hybrid protocols [4]. This paper compares one table driven routing protocol, OLSR, one on-demand routing protocol, AODV and one hybrid routing protocol, ZRP.
A. OLSR:
some such messages. Such losses occur frequently in radio networks due to collisions or other transmission problem. The key feature of this protocol is multipoint relays. Topological changes cause floods of the topological information to all available nodes in the network. Therefore, the multipoint relays are used to reduce the overhead of network floods and size of link state updates. Every node selects a set of its neighbor nodes as multipoint relays. B. AODV:
Ad-hoc On-demand Distance Vector is a loop-free routing protocol for ad-hoc networks [8,9]. It is designed to be self-starting in an environment of mobile nodes, withstanding a variety of network behaviors such as node mobility, link failures and packet losses. The AODV protocol consists of two important mechanisms, Route Discovery and Route Maintenance. AODV is chosen for the obvious reason that it is simple and has a low overhead and its on-demand nature does not unduly burden the networks.
It has bi-directional route from the source and destination. When it has packets to send from a source to destination mobile node, then it floods the network with route request (RREQ) packets. All mobile nodes that receive the RREQ packet or update message from a neighbor, checks their routing tables to find out that if it is the destination node or if it has the fresh route to the (RREP) packet, which is routed back on a temporary reverse route generated during RREQ packet transmission from source node, or else it re-broadcast RREQ packet.
C. ZRP:
The Zone Routing Protocol, or ZRP, as described in this document combines the advantages of both into a hybrid scheme, taking advantage of pro-active discovery within a node's local neighborhood, and using a reactive protocol for communication between these neighborhoods. In a MANET, it can safely be assumed that the most communication takes place between nodes close to each other. Changes in the topology are most important in the vicinity of a node - the addition or the removal of a node on the other side of the network has only limited impact on the local neighborhoods [10]. As mentioned earlier, the ZRP is not so much a distinct protocol as it provides a framework for other protocols. The separation of a nodes local neighborhood from the global topology of the entire network allows for applying different approaches - and thus taking advantage of each technique's features for a given situation. These local neighborhoods are called zones (hence the name); each node may be within multiple overlapping zones, and each zone may be of a different size. The ``size'' of a zone is not determined by geographical measurement, as one might expect, but is given by a radius of length L, where L is the number of hops to the perimeter of the zone.
III. SIMULATION ENVIRONMENT
The research is carried out using discrete event simulation environment software, known as OPNET (Optimized Network Engineering Tool) Modeler [11] version 14.5. It is one of the most widely used commercial simulators based on Microsoft Windows platform.
[image:2.595.329.549.54.214.2].
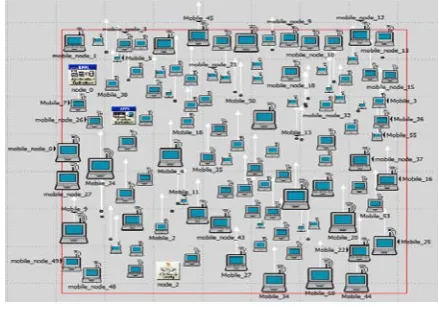
Figure.1 High Density Network (120 nodes)
The simulation focused on the performance of the routing protocols under security attacks. Two types of network scenarios are designed: high density and low density networks, high density network consist of 120 nodes shown in fig 1 and low density network consist of 60nodes shown in fig2.
[image:2.595.323.552.426.606.2]The research is carried out using discrete event simulation environment software known as OPNET Modeler version 14.5.The simulation focused on the performance of the routing protocols under two application High Resolution video conferencing and HTTP Heavy Browsing. Two types of scenarios are used: high density and low density networks. High density networks consist of 120 nodes and low density networks consist of 60 nodes. The nodes are randomly placed within certain gap from each other in 1000×1000 m campus.
Figure.2 Low Density Network (60 nodes)
IV. WIRELESS PARAMETERS
The wireless parameters are common to all of the routing protocols as shown in table 1.
Table 1. Wireless LAN Parameters
Wireless LAN MAC Address Auto Assigned
Physical Characteristics Direct Sequence
Data Rate (bps) 56 Mbps
Transmit Power 0.030
RTS Threshold None
A. Applications:
In our work we use two applications for simulation is High Resolution Video Conferencing and HTTP Heavy Browsing.
Application 1: High Resolution Video Conferencing: High-definition video conferencing is two-way interactive communication where audio and video data are transmitted in real-time across a network. To achieve high-definition video conferencing, you must be communicating between HD capable devices.
Table 2. High Resolution Video Conferencing
Frame Inter arrival Time Information
30 frames/sec
Incoming Frame Size 2764800 bytes
Outgoing Frame Size 2764800 bytes
[image:3.595.315.545.221.398.2]Application 2: HTTP Heavy browsing:
Table 3. Heavy Browsing
HTTP Version HTTP 1.1
Page Interval Time Constant(10)
Object Size in page Large Image
Number of objects 10
Pages per Server Constant(20)
B. Performance Metric:
For the comparison of protocols under the applications generating heavy traffic, four different metrics have been chosen:
a. Retransmission Attempts (packets):
Total number of retransmission attempts by all WLAN MACs in the network, until either packet is successfully transmitted or it is discarded as a result of researching short or long retry limit.
b. Average End to End Delay (sec):
This is average end to end delay of all successful transmitted data packet. It is used to represent the end to end delay of all the packets received by the wireless LAN MACs of all WLAN nodes in the network and forwarded to the higher layers.
Average Delay =
c. Network Load (bits/sec):
Network Load is a statistic represents the total data traffic received (in bits/sec) by the network from the higher layers of the MACs that accepted and queued for transmission. This statistic doesn’t include any higher layer data traffic that is rejected without queuing due to full queue or large size of the data packet.
d. Throughput (bits/sec) :
Represents the total number of bits (in bits/sec) forwarded from wireless LAN layers to higher layers in all WLAN nodes of the network. It is the number of packets passing through the network in a unit of time.
Throughput=
V. SIMULATION RESULTS AND ANALYSIS
After choosing metrics, the simulation is done for 10 minutes for each scenario.
A. End to End Delay:
Figure.3 End to End Delay for low density network
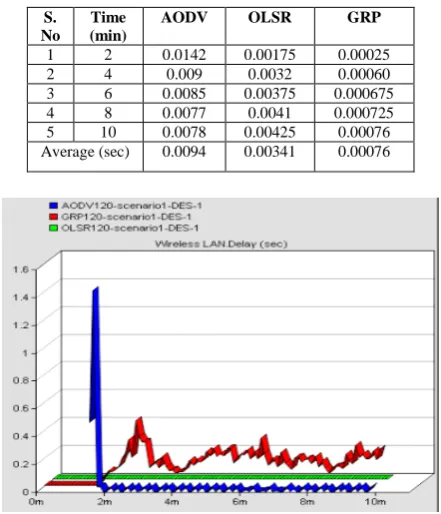
[image:3.595.35.268.285.443.2]Fig. 3 & 4 shows the end to end delay of OLSR, AODV and GRP with low and high density network having applications high resolution video conferencing and heavy browsing. Here the average end to end delay average is in seconds for OLSR 0.00107 for AODV average end to end delay is 0.162 and for GRP average delay is 0.112.
Table.4 End to End Delay for low density network (60 nodes)
S. No
Time (min)
AODV OLSR GRP
1 2 0.0142 0.00175 0.00025
2 4 0.009 0.0032 0.00060
3 6 0.0085 0.00375 0.000675
4 8 0.0077 0.0041 0.000725
5 10 0.0078 0.00425 0.00076
Average (sec) 0.0094 0.00341 0.00076
[image:3.595.327.548.496.753.2]Table.5 End to End Delay for high density network (120 nodes)
S.NO Time
(min)
AODV OLSR GRP
1 2 0.55 0.00045 0.015
2 4 0.1 0.00104 0.106
3 6 0.07 0.0012 0.135
4 8 0.05 0.0013 0.15
5 10 0.04 0.00138 0.155
Average (sec) 0.162 0.00107 0.112
B. Network Load:
Generally the network load in AODV is lower than the both OLSR and GRP due to the lower control load, because OLSR has to publish the routing information to all the nodes in the network in the regular intervals of time. In Fig 5. AODV configured low density network (60 nodes), the network load is 89200 bits/s lower than the average network load of OLSR 151400 bits/s and GRP network load is 1274000 bits/s.
Figure.5 Network Load for low density network (60 nodes)
Table.6 Network Load for low density network (60 nodes)
S .NO
Time (min)
AODV OLSR GRP
1 2 30000 90000 490000
2 4 83000 147000 1200000
3 6 103000 165000 1450000
4 8 112000 175000 1580000
5 10 118000 18000 1650000
Average (bits/s) 89200 151400 1274000
In Fig.6 shows the average network load in a high density network (120 nodes). In AODV high density network, average network load is 207800 bits/s and for OLSR high density network, the network load is 3470000 bits/s and for GRP high density network, the network load is 415000 bits/s.
Figure.6 Network Load for high density network (120 nodes)
Table.7 Network load for high density network
S.NO Time
(min)
AODV OLSR GRP
1 2 100000 1250000 1250000
2 4 197000 3250000 3250000
3 6 232000 3900000 3900000
4 8 250000 4350000 4350000
5 10 260000 4600000 4600000
Average (bits/s) 207800 3470000 415000
C. Retransmission Attempts:
In Fig.7 the average retransmission attempts of all wireless MACs in the network either the packet is discarded or successfully transmitted is decreased by 2.11 packets, in the case of AODV low density network (60 nodes). In the case of OLSR low density network, the retransmission attempts are decreased by 2.19 packets and in case of GRP, this decrement is of 0.53 packets.
Figure.7 Retransmission attempts for low density network (60 nodes)
Table.8 Retransmission attempts for low density network
S. NO Time
(min)
AODV OLSR GRP
1 2 1.88 2.19 0.58
2 4 2.15 2.2 0.52
3 6 2.17 2.2 0.52
4 8 2.17 2.2 0.52
5 10 2.18 2.2 0.52
Fig.8 shows that in high density retransmission AODV network retransmission (120 nodes) is 2.47 packets. Retransmission attempts in OLSR is 2.884 packets and in GRP less than both the AODV and OLSR. The average retransmission attempts are decreased in both low density and high density network.
Figure.8 Retransmission attempts for high density network (120 nodes)
Table.9 Retransmission attempts for high density network (120 nodes)
S. NO Time
(min)
AODV OLSR GRP
1 2 2 2.9 0.8
2 4 2.58 2.88 0.975
3 6 2.59 2.88 0.975
4 8 2.6 2.88 0.98
5 10 2.6 2.88 0.98
Average (packets) 2.47 2.884 0.942
D. Throughput:
In low density network, average throughput degrades in AODV, because the packet drop is increased. When traffic load increases congestion forces nodes to declare links failed although the links still exist. This leads to more routing overhead for repairing the broken links. Consequently, the control overhead grows very rapidly in AODV when load increases. This growth is directly related to the throughput drop.
[image:5.595.41.273.130.332.2]Fig.9 shows the throughput of OLSR , AODV and GRP high density networks (120 nodes) in case of AODV protocol network average throughput (bits/s) is 174000 it is less than OLSR average throughput is 4206000 bits/s and in GRP average throughput is 1530000 bits/s.
[image:5.595.38.268.362.573.2]Figure.9 Throughput for low density network (60 nodes)
Table. 10Throughput for low density network (60 nodes)
S. NO
Time (min)
AODV OLSR GRP
1 2 70000 4150000 900000
2 4 150000 4200000 1500000
3 6 200000 4200000 1650000
4 8 220000 4230000 1750000
5 10 230000 4250000 1850000
Average (bits/s) 174000 4206000 1530000
Fig.10 shows the throughput at high density for AODV is 641000 bits/s, in OLSR network throughput is more than AODV is 4240000 bits/s and in GRP average throughput is 30080000 bits/s.
Figure.10Throughput for high density network (120 nodes)
Table .11 Throughput for high density network (120 nodes)
S. NO
Time min
AODV OLSR GRP
1 2 450000 30300000 2500000
2 4 625000 30100000 4100000
3 6 650000 30000000 4700000
4 8 730000 30000000 4900000
5 10 750000 30000000 5000000
[image:5.595.42.266.368.564.2] [image:5.595.317.561.487.667.2]VI. CONCLUSION AND SCOPE FOR FUTURE WORK
In this paper, the performance one reactive protocol, AODV, one proactive protocol, OLSR and one hybrid protocol, GRP under heavy applications traffic flow: High Resolution Video Conferencing and HTTP heavy browsing have been evaluated in terms of performance metrics: end to end delay, retransmission attempts, network load and throughput. From all the results it is concluded that proactive protocols and hybrid protocols in case of end to end delay. If the performance of the network is evaluated on the basis of the network load AODV is better than the both OLSR and GRP. Performance of the network is evaluated on the basis of the throughput because it is the main factor for the performance evaluation, then OLSR performs better than both AODV and GRP. The overall performance of the network is bettering OLSR then AODV and GRP. In future the performance of various reactive, proactive and hybrid protocols can be evaluated under heavy applications to make the results more justified.
VII. ACKNOWLEDGMENT
The authors would thanks the reviewers for their help in improving the document.
VIII. REFERENCES
[1]. Ashish Shrestha and Firat Tekiner, “On MANET Routing Protocols for Mobility and Scalability.” In International Conference on Parallel and Distributed Computing, Applications and Technologies, Pages 451-456, November 2009. IEEE Computer Society.
[2]. M.K. Jeya Kumar and R.S. Rajesh, “Performance Analysis of MANET Routing Protocols in Different Mobility Models.” In
IJCSNS International Journal of Computer Science and Network Security, Pages 22-29, VOL.9 No.2, February 2009. [3]. Valentina Timcenko, Mirjana Stojanovic et al., “MANET
Routing Protocols vs. Mobility Models: Performance Analysis and Comparison.” In Proceedings of the 9th WSEAS International Conference on Applied Informatics And Communications (AIC '09), Pages 271-276, 2009.
[4]. Asad Amir Pirzada, Saad Khan et al., “Performance Comparison of Reactive Routing Protocols for Hybrid Wireless Mesh Networks.” In 2nd International Conference on Wireless Broadband and Ultra Wideband Communications (Aus Wireless 2007), Pages 1-6, February 2007. IEEE Computer Society.
[5]. Amandeep Dhir and Jyotsna Sengupta , “Security-Aware Optimized Link Routing Protocol for Mobile Ad-Hoc Networks.” This research was funded by UGC for development of efficient wireless networks at Department of Computer Science, Punjabi University, Patiala, India, Page 52-83 ,February 23,2009.
[6]. Arun Kumar B. R., Lokanatha C. Reddy and Prakash S. Hiremath, “ Performance Comparison of Wireless Mobile Ad Hoc Network Routing Protocols.” In IJCSNS International Journal of Computer Science and Network Security, VOL. 8 No.6, pp. 337-343, June 2008.
[7]. Nilesh. P. Bobade1 and Nitiket. N. Mhala, “Performance Evaluation of AODV for Mobile Ad Hoc Network with Varying Network Size.” International Journal of Computer Communication and Information System ( IJCCIS) Vol2, pp 150-153, July – Dec 2010.
[8]. Ian D. Chakeres, Elizabeth M. Belding-Royer, “AODV Routing Protocol Implementation Design.” ICDCSW 24th International Conference on Distributed Computing Systems Workshops, 2004. IEEE Computer Society
[9]. Dr. Aditya Goel, Ajai Sharma, “Performance Analysis of Mobile Ad-hoc Network Using AODV Protocol.” In proceedings of International Journal of Computer Science and Security (IJCSS), vol. 3, pp. 334-343.
.
[10].Nicklas Beijar, “ Zone Routing Protocol (GRP).” Networking Laboratory, Helsinki University of Technology.”
[11].Xinjie Chang, “NETWORK SIMULATIONS WITH