© 2015, IRJET.NET- All Rights Reserved
Page 1752
Comparative Modal analysis of conventional spur gear with modified
involute spur gear
Sarfraz Ali N. Quadri
1, Dhananjay R. Dolas
2,
1
M.E. (CAD/CAM), Department of Mechanical Engineering, MGM’s JNEC Aurangabad (M.S.), India
2
Associate Professor, Department of Mechanical Engineering, MGM’s JNEC Aurangabad (M.S.), India
---***---Abstract -
In this research paper the modal analysisof involute spur gear pair is carried out using finite element analysis tool ANSYS14.5. Gear noise and vibration is a major problem in many power transmission applications this problem becomes more significant in applications with higher operating speeds, where there is vibratory excitation which is related to the gear transmission error. The goal of modal analysis in this research paper is to determine the natural mode shapes and frequencies of the present spur gear pair and to comparatively analyze with frequencies of the geometrically modified involute spur gear pair during free vibration as well as in pre-stress condition.
Key Words: Involute spur gear, modal analysis, mode
shapes, and natural frequency.
1. INTRODUCTION
Now a days most of the mechanical systems are subjected to dynamic loading which causes & shortens of the usable time, crack, noise and fatigue, in general the total effect of work for the mechanical system is lowered. Reasons for such behavior are type of loading, construction and conditions of work where the mechanical systems operate. The problems created the need of Vibrational testing. Modal testing is the form of vibration testing of an object where the natural (modal) frequencies, modal masses, modal damping ratios and mode shapes of the object under test are determined.
A modal test consists of an acquisition phase and an analysis phase. The complete process is often referred to as a Modal Analysis or Experimental Modal Analysis. There are several ways to do modal testing but impact hammer testing and shaker (vibration tester) testing are commonplace. In both cases energy is supplied to the system with known frequency content. Where structural resonances occur there will be an amplification of the response, clearly seen in the response spectra. In the recent era, it is common to use the finite element method (FEM) to perform this analysis because, like other calculations using the FEM, the object being analyzed can
have arbitrary shape and the results of the calculations are acceptable. The types of equations which arise from modal analysis are those seen in Eigen systems. The physical interpretation of the eigenvalues and eigenvectors which come from solving the system are that they represent the frequencies and corresponding mode shapes. Sometimes, the only desired modes are the lowest frequencies because they can be the most prominent modes at which the object will vibrate, dominating all the higher frequency modes.
2. LITERATURE REVIEW
Athisaya and et al. (2014) explores the development of composite automotive gear box with optimum design and composite material selection at conceptual design stage for weight reduction to get better fuel efficiency with fulfilling needs of anti-fade characteristics, less power loses due to weight, corrosion resistant design and more consolidated design. The modal analysis is carried out to know the natural frequencies and mode shapes with the composites material gearbox.
JoongBong Oii and et al. (2011) simulated the modal analysis of portal axle using finite element method (FEM). Modal analysis is simulated on three different combinations of gear train system commonly designed for portal axle. The three gear trains being analyzed are gear train without idler gear, one idler gear and two idler gears. FEM static stress analysis is also simulated on three different gear trains to study the gear teeth bending stress and contact stress behavior of the gear trains in different angular positions from 0° to 18°. The single and double pair gear teeth contact are also considered. This methodology serves as a novel approach for gear train design evaluation, and the study of gear stress behavior in gear train which is needed in the small workshop scale industries.
© 2015, IRJET.NET- All Rights Reserved
Page 1753
Pathan Nilofar and at al. (2014) covers the design, modalanalysis and results of experimental tests of spur gear. Effort is to increase the fundamental frequencies of existing gear and to improve performance of existing gear without compromising on the performance. Result of FEM analysis is compared with the experimental result and analytical results.
Wei and Zu have developed a two-dimensional and three-dimensional gear meshing model using FEM to study the effect of gear tooth bending stress and surface contact stress. The authors validated the FEM gear model and simulation by comparing the FEM stress with theoretical Lewis bending stress equation and Hertz contact stress equation. The behavior of gears in operation is important to understanding how stresses are being distributed from one meshing gear to another.
Chen and Tsay conducted stress analysis on a helical gear set by studying the influences of the gear design parameters and the contact positions on the gear stress distribution.
Hassan [16] studied the contact stress of spur gear in two dimensional model based on different angular position. Abdullah [17] investigated the root stress of the gear used in powertrain transmission by FEM analysis. The root stress was analyzed based on the effect of mesh refinement, number of teeth reduction, and rim thickness reduction.
3. MODAL ANALYSIS OF SPUR GEAR
3.1
Modal analysis of conventional involute spur
gear
3.1.1Natural Frequency
The conventional involute spur gear pair is taken for study its natural frequency with four basic modes. The gear pair model with boundary conditions and meshed model is shown in below figure 1
Figure 1: Boundary conditions & Meshed model
The four natural modes shows the natural frequency in the range of 119.93 Hz to 1517.4 Hz, where the maximum frequency is found in the mode four as shown in fig 2. The results are shown in table no. 1 below,
Figure 2 Natural frequencies of Four Modes of Conventional Gear
Table 1 Natural Frequencies of Conventional Gear
Natural Mode Shapes Natural Frequency (Hz)
1 119.93
2 152.64
3 409.03
4 1517.4
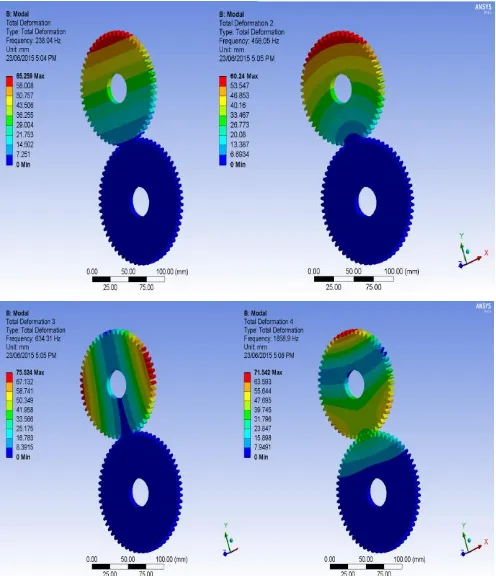
3.1.2 Forced (Pre-stress) Frequency
© 2015, IRJET.NET- All Rights Reserved
Page 1754
Figure 3: Pre-stress loading conditionsFigure 4: Forced Frequencies of 4 modes (Conventional gear)
The four natural modes shows the forced frequency in the range of 238.04 Hz to 1658.9 Hz, where the maximum frequency is found in the mode four as shown in fig 4 (D). the results are shown in table no. 2 below,
Table 2 Forced Frequencies of Conventional Gear
Natural Mode Shapes Forced Frequency (Hz)
1 238.04
2 458.05
3 634.31
4 1658.9
3.2
Modal analysis of geometrically modified
involute spur gear
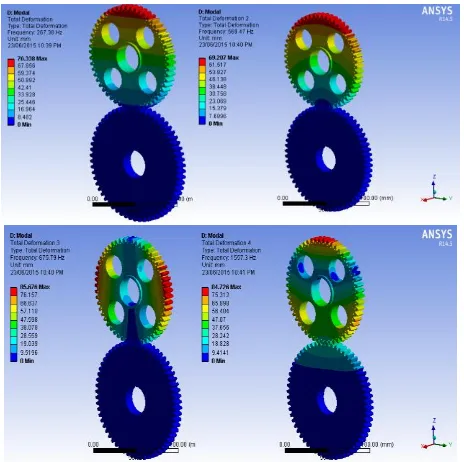
3.2.1Natural Frequency
The geometrically modified involute spur gear pair is analyzed for modal analysis using ANSYS 14.5, its natural frequency with four basic modes. The gear pair model and meshed model is shown in below figure 5,
Figure 5: Boundary conditions & Meshed model
Figure 6: Natural frequencies of Four Modes of Modified Gear
© 2015, IRJET.NET- All Rights Reserved
Page 1755
Table 3 Natural Frequencies of Modified GearNatural Mode Shapes Natural Frequency (Hz)
1 266.75
2 564.63
3 675.84
4 1555.6
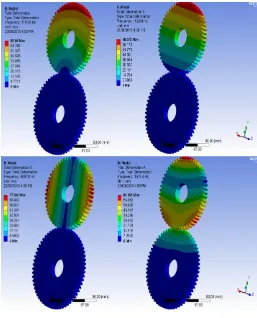
3.2.2 Forced (Pre-stress) Frequency
For the Forced frequency general loading condition of the gear pair is applied to the geometrically modified structure. The boundary conditions with pre-stress conditions & forced frequencies for four modes are shown in figures below,Figure 7: Pre-stress loading conditions
Figure 8: Forced Frequencies of 4 modes (Modified gear)
The four natural modes shows the forced frequency of the modified gear in the range of 267.38 Hz to 1557.3 Hz, where the maximum frequency is found in the mode four as shown in fig 8 (D). The results are shown in table no. 4 below,
Table 4 Forced Frequencies of Modified Gear
Natural Mode Shapes Forced Frequency (Hz)
1 267.38
2 569.47
3 675.79
4 1557.3
4. RESULTS & DISCUSSIONS
The comparative analysis of natural frequencies of present spur gear with modified spur gear is given in table no. 5, whereas the forced frequencies of conventional and modified gear are compared in table no. 6.
Table 5 Comparative analysis of Natural frequencies of Conventional & Modified gear
Mode shapes
Natural frequencies of Present gear (Hz)
Natural Frequencies of the
Geometrically modified Gear (Hz)
Percentage difference between Range of Natural frequencies
M 1 119.93 265.75
10.10 %
M 2 152.64 564.63
M 3 409.03 675.84
M 4 1517.4 1555.6
The natural frequencies of present and modified gear are compared for the four natural frequencies, the pattern of frequencies are identical in are in close range as shown in graph 1 below. There is a mere percentage difference of 10 % between the ranges of gears, where modes 2 & 3 are slightly apart and modes 4 of both the models are closed bound.
© 2015, IRJET.NET- All Rights Reserved
Page 1756
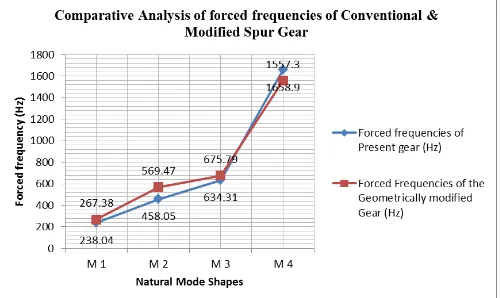
frequencies are identical in are in close range as shown in graph 2 below. There is a trivial percentage difference of 3.80 % between the ranges of forced frequencies, although modes 1, 2 & 3 of modified gear are slightly higher than the conventional gear but mode 4 of the modified gear has shown extensively lower frequency than the conventional gear itself.Graph 5.2 Comparative analysis of forced frequencies of conventional & modified spur gear
5. CONCLUSIONS
The modal analysis is carried out on both the present spur gear as well as geometrically modified involute spur gear in two conditions i.e. Natural frequency and Forced frequency in pre-stress loading. The results are shown in table no. 5 & 6 respectively , the natural frequencies of present gear vary from 119.93 Hz to 1517.4 Hz, whereas the natural frequency of geometrically modified gear varies from 265.75Hz to 1555.6Hz. The Forced frequencies of present gear vary from 238.04 Hz to 1658.9 Hz, whereas the forced frequency of geometrically modified gear varies from 267.38Hz to 1557.3Hz. There is a mere percentage difference of 3.80 % between the forced frequencies of the gears.
ACKNOWLEDGEMENT
We would like to thank our mentor Dr. Sudhir Deshmukh for their valuable co-operation & support. My colleague farazuddin for his humble correspondence and help during our research paper, all faculty members of Mechanical Engineering Department and especially the most, our families for their forever support.
REFERENCES
[1] JongBoon Ooi, Xin Wang, “Modal and stress analysis of gear train design in portal axle using finite element modeling and simulation”, Springer Journal of Mechanical Science and Technology 26 (2) 2012, PP: 575-589.
[2] Aherwar A., Md. Saifullah Khalid, “vibration analysis techniques for gearbox diagnostic: a review”, International Journal of Advanced Engineering Technology Vol.III, Issue II, April-June, 2012, PP: 04-12
[3] Ali Raad Hassan, “Contact Stress Analysis of Spur Gear Teeth Pair”, World Academy of Science, Engineering and Technology, Vol. 3 2009, pp. 597-602
[4] X. Feng, “Analysis of Field of Stress and Displacement in Process of Meshing Gears” International Journal of Digital Content Technology and its Applications, Volume 5, Number 6, June 2011, PP: 345-357
[5] Nilofar Hajikhan Pathan, Prof. Dr. V.P. Singh, “modal analysis of spur gear to determine the natural frequencies and it's effect over the geometry of the gear”, International Journal of Advanced Engineering Research and Studies, April-June,2014/76-78 pursuing master’s degree
program in CAD/CAM
engineering in MGM’s JNEC Maharashtra, India, Mob-+91 8793112460.
E-mail: