Available online: https://edupediapublications.org/journals/index.php/IJR/ P a g e | 1591
Voltage Flicker Compensation Using Statcom
Tipirisetti Rakesh
Teegala Krishna Reddy Engineering College, Meerpet, Saroornagar, Hyderabad.
ABSTRACT- The concept of power quality
describes the quality of the supplier voltage in
relation to the transient breaks, falling voltage,
harmonics and voltage flicker voltage. Huge
non-linear industrial loads such as the electrical arc
furnaces, pumps, welding machines, rolling mills and
others are known as flicker generators. A new
technique which extracts the voltage disturbance to
suppress the voltage flicker, with usage of
STATCOM for voltage flicker compensation to
overcome the aforementioned problems related to
other techniques with the concept of instantaneous
reactive power components is used in the controlling
system. The voltage flicker mitigation in three stages.
In this stage a FCTCR one of the FACTS devices
being controlled by a thyristor is used to mitigate the
voltage flicking. The exerted voltage flicker into the
system. A snubber circuit to eliminate voltage spikes
caused by the huge TCR reactor switching, there are
still distortions in the output waveform. In
Compensation using 6-pulse voltage-source converter
STATCOM adjusting the conducting angle of the
GTOs, the generated voltage and then the injected or
absorbed power of the STATCOM are controlled.
The mitigation effects of this compensator are better
than that of FCTCR and effectively mitigate the
voltage flicker; but the output voltage waveform has
some considerable harmonics. The output voltage
mitigated by 12-pulse voltage-source converter
STATCOM. Injection of the harmonic from
STATCOM into the system which can be improved
with the increase of the voltage source converters of
STATCOM using a 12-pulse STATCOM equipped
with an RLC filter. The obtained results clearly
demonstrate that 12-pulse STATCOM equipped with
an RLC filter can reduce the voltage flicker caused
by nonlinear loads such as electric arc furnaces.
INTRODUCTION:
The relationship between power quality and
distribution system has been a subject of interest for
several years. The concept of power quality describes
the quality of the supplier voltage in relation to the
transient breaks, falling voltage, harmonics and
voltage flicker [1]. Voltage Flicker is the disturbance
of lightning induced by voltage fluctuations. Very
small variations are enough to induce lightning
disturbance for human eye for a standard 230V, 60W
coiled-coil filament lamp. The disturbance becomes
perceptible for voltage variation frequency of 10 Hz
and relative magnitude of 0.26%. Huge non-linear
industrial loads such as the electrical arc furnaces,
pumps, welding machines, rolling mills and others
are known as flicker generators. In this respect, the
quality of supplied voltage is significantly reduced in
an electrical power system and the oscillation of
supplied voltage appears to be a major problem.
Available online: https://edupediapublications.org/journals/index.php/IJR/ P a g e | 1592
flicker, behaves in the form of a constant reactance
and a variable resistance.
The transformer-reactance system is
modeled as a lumped reactance, a furnace reactance
(included connection cables and busses) and a
variable resistance [5] which models the arc.
Connecting this type of load to the network produces
voltage variation at the common point of supply to
other consumers. The relative voltage drop is
expressed by equation
where ΔP and ΔQ are the variation in active and
reactive power; Un is the nominal voltage and R and
X are short circuit resistance and reactance. Since R
is usually very small in comparison to X, ΔU is
proportional to Q (reactive power). Therefore,
voltage flicker mitigation depends on reactive power
control [5]. Two types of structures can be used for
the compensation of the reactive power fluctuations
that cause the voltage drop: A: shunt structure [1,
5-14]: in this type of compensation, the reactive power
consumed by the compensator is kept constant at a
sufficient value. B: series structure [15-16]: in this
type, all the efforts are done to decrease the voltage
drop mentioned above, and finally the reactive power
is kept constant despite the load fluctuations by
controlling the line reactance.
In addition to the aforesaid procedures for
the compensators, the active filters are used for the
voltage flickers mitigation as well [17]. Furthermore,
the mitigating devices based on Static VAR
Compensator (SVC) such as Thyristor Switched
Capacitor TSC [18], Thyristor Controlled Reactor
(TCR) [19], and FCTCR [20], are the most frequently
used devices for reduction in the voltage flicking.
SVC devices achieved an acceptable level of
mitigation, but because of their complicated control
algorithms, they have problems such as injecting a
large amount of current harmonics to the system and
causing spikes in voltage waveforms. Advent of
FACTS devices make them ideal for use in a power
system and especially in the voltage flicker
mitigation. In this respect, the FACTS devices based
on voltage-source converters have been able to
improve the problems related to SVC [5]. A new
technique based on a novel control algorithm, which
extracts the voltage disturbance to suppress the
voltage flicker, is presented in this paper. The
technique is to use STATCOM [21-22] for voltage
flicker compensation to overcome the
aforementioned problems related to other techniques.
The concept of instantaneous reactive power
components is used in the controlling system. A
two-bus system is exploited to fulfill the investigation of
the presented procedure. All the simulations are done
according to the usage of MATLAB software [23].
The related compensation was performed first by
FCTCR. Afterwards, a 6-pulse voltage-source
converter STATCOM was used to compensate for the
voltage flicker. With respect to the harmonic problem
in this stage, a 12-pulse voltage-source converter
STATCOM was designed to isolate load harmonics
and mitigate the propagation of voltage flicker to the
system in the next stage. The obtained results clearly
confirmed the efficiency of the 12-pulse STATCOM
to complete the voltage flicker mitigation.
Available online: https://edupediapublications.org/journals/index.php/IJR/ P a g e | 1593
Flicker is a difficult problem to quantify and
to solve. The untimely combination of the following
factors is required for flicker to be a problem: 1)
some deviation in voltage supplying lighting circuits
and 2) a person being present to view the possible
change in light intensity due to the voltage deviation.
The human factor significantly complicates the issue
and for this reason flicker has historically been
deemed "a problem of perception." The voltage
deviations involved are often much less than the
thresholds of susceptibility for electrical equipment,
so major operating problems are only experienced in
rare cases. To office personnel, on the other hand,
voltage deviations on the order of a few tenths of one
percent could produce extremely annoying
fluctuations in the output of lights, especially if the
frequency of repetitive deviations is 5-15 Hz. Due to
the clear relationship between voltage deviation and
light response, the term "flicker" often means
different things to different people with the
interpretation primarily governed by the concerns of
a particular discussion.
In each case, the deviation may or may not
be strictly periodic and is usually expressed as a
change (as indicated by the change in rms value)
relative to the steady-state level (expressed as an rms
value averaged over some time period). For voltage
variations, the change is usually expressed as DV/V.
A similar expression for light intensity variations also
exists. From a utility application point of view,
voltage fluctuations have usually been of interest,
perhaps because voltage changes are easily measured
with existing instrumentation. Historically, these
voltage changes have been used in conjunction with
"flicker curves". These curves, derived from
controlled experiments, offer thresholds of perception
and/or irritability when periodic rectangular voltage
fluctuations occur continuously (only threshold of
irritability curves are shown here). Even though the
use of a simple curve leaves much to be desired
(including an accepted industry-wide definition of the
essential DV/V term), it is comforting to note that
IEEE and UIE frequency weightings are very similar.
The improvements that are now possible, based
primarily on existing IEC standards, are the subject
of this paper and will be presented in later sections.
Standards-making bodies tend to focus on the
changes in light intensity output in order to account
for the human observability factor.
As standards have evolve, significant
attempts have been made to include the years of
experience obtained using the "flicker curve" method
described previously. There are, however, a number
of degrees of freedom that must be addressed in the
development of a universally-accepted standard
including lighting circuit voltage, type of lamp
involved, randomness of voltage fluctuation, and
human factors which affect perception. At this time,
there are no widely-accepted flicker standards in the
United States and Canada. In Europe and other
countries, however, the International Electro
technical Commission (IEC) has developed a group
of standards which systematically account for many
of the difficulties in the "flicker curve" methods. The
IEEE Task Force on Light Flicker is presently
considering modifications to these IEC standards that
are required for them to be considered for adoption in
the United States and Canada. The following sections
describe the existing IEEE and IEC Standards.
Flicker Measurement Introduction
The power supply network voltage varies over time
Available online: https://edupediapublications.org/journals/index.php/IJR/ P a g e | 1594
electricity generation, transmission and distribution.
Interaction of electrical loads with the network causes
further deterioration of the electrical power quality.
High power loads that draw fluctuating current, such
as large motor drives and arc furnaces, cause low
frequency cyclic voltage variations that result in:
flickering of light sources which can cause significant
physiological discomfort, physical and psychological
tiredness, and even pathological effects for human
being
devices and electronic circuits. Figure 1 illustrates the
way in which a small voltage change produces a
noticeable effect on the luminous flux of a bulb.
Recurrent small changes of network voltage
amplitude cause flickering of light sources. The effect is popularly referred to as ‘flicker’ and is a
significant power quality parameter. An example of a
network voltage spectrum where flicker is apparent is
shown in Figure 2. The spectrum shown is typical of
the voltage of a network supplying a large
non-stationary electrical drive. A bulb, supplied from the
same node, will flicker with frequency about 1 Hz.
Power network voltage spectrum; in the diagram
on the right the 50 Hz component is omitted
Estimation of voltage fluctuations
The phenomenon of flickering of light sources has
been known since the introduction of power supply
networks. However, it grew rapidly along with the
increase in the number of loads and the increase in
the power consumed. Considerable research has been
conducted into the measurement and mitigation of
flicker. In order to quantify the scale of light
flickering phenomenon research has been conducted
with the aims of developing measurement equipment,
containment techniques and methods of mitigation.
This Section discusses measurement principles and
the generic design principles of measurement
instruments. Initially, instrument designs were based
on simple observation of luminous flux. The next
step was to develop a model of the human reaction –
in the form of discomfort or annoyance - to the
fluctuation of luminous flux. The model was based
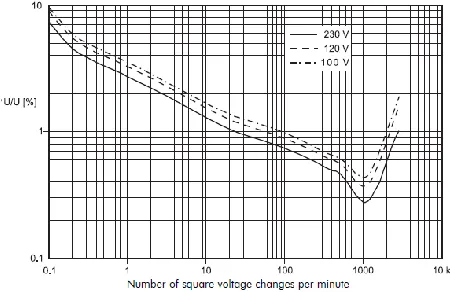
on a 60 W, 230 V tungsten bulb, since that was the
most commonly used light source in Europe at that
time. Figure 3 shows the threshold of perception of
flicker plotted against percentage voltage change (y
axis) and frequency of change (x axis). Where the
magnitude and frequency of the changes lie above the
curve, the effect is likely to be disturbing to a human
observer while below the curve it is likely to be
imperceptible. The dashed lines represent tungsten
bulbs designed for different nominal voltages. Early
flicker measurement instruments included a typical
60 W, 230 V bulbs, a luminous flux sensor and an
analogue model to simulate human reaction.
Following research in the 1980s, activity in the area
Available online: https://edupediapublications.org/journals/index.php/IJR/ P a g e | 1595
on the UIE activities. The resulting normalized model
instrument is completely electronic; it measures
voltage fluctuation and simulates both the response of
the light source and the human reaction. Two
measurement results are derived; one for short term
flicker effect, PST, measured over a ten minute
period, and one for long term, PLT, which is a rolling
average of PST values over a two hour time frame.
Measurement of short-term flicker severity
The block diagram of the instrument proposed by the
UIE report is shown in Figure 4. The measured
voltage fluctuations are processed using a model of
the luminous flux versus voltage characteristic of the
tungsten bulb and a model of the human reaction to
fluctuations of luminous flux. This gives an
instantaneous flicker measurement. However,
individual people react differently to variations in
luminous flux, so the PST value is derived using a
statistical model based on experimental work with a
large group of individuals.
Measurement and assessment of flicker in the power
supply network As mentioned in the introduction, the
basic source of voltage fluctuations (and the
consequential flickering of light sources) is large
electrical loads. The mechanism is illustrated in
Figure 9. The voltage at the point of the load
connection is less than the source voltage because of
the voltage drop
as seen from the points of the load connection (a, b).
Since the voltage at points (a, b) is
it may be noticed that any ILoad current change,
particularly in the reactive component, will cause an
undesirable change in the voltage Uab. In a real
power network this phenomenon is much more
complex, but the principle is valid. Often, the
question arises as to whether the planned connection
of a load to the network would cause flicker or
increase the level of flicker above the prescribed
limit. The answer to this question depends on the
parameters of the power network and any connected
loads that may cause negative effects on it.
Since the effect cannot be measured in advance of
connection, the effect must be estimated.
Compatibility issues are dealt with in standardization
Available online: https://edupediapublications.org/journals/index.php/IJR/ P a g e | 1596
source impedance ZZn equivalent to Re(ZZn) = 0.4Ω
and Im(ZZn) = 0.25Ω at 50 Hz is assumed.
Additionally, the standard provides a method of
improving the assessment by taking account of the
profile of the modulation of the supply voltage – i.e.
the calculations assume the worst case square form
modulation and will therefore require modification
for other shapes.
Figure 10 shows one profile, typical of a motor drive, from [5] showing how voltage changes ΔU are
determined for the calculation of d = ΔU/Uab .
Values of equivalent step parameters depend on t1,
t2, t3 etc, as illustrated in the standard. The
calculation of the effective value of voltage is
performed every half cycle.
CONTROLLING SYSTEM
The concept of instantaneous reactive power is used
for the controlling system. Following this, the
3-phase voltage upon the use of the park presented by
Akagi [24] has been transformed to the synchronous
reference frame (Park or dq0 transformation). This
transformation leads to the appearances of three
instantaneous space vectors: Vd on the d-axis (real or
direct axis), Vq on the q-axis (imaginary or
quadrature axis) and V0, from the 3-phase voltage of
Va, Vb and Vc. The related equations of this
transformation, expressed in the MATLAB software,
are as follows:
A dynamic computation shows that the voltage
oscillations in the connecting node of the
flicker-generating load to the network are created by 3
vectors: real current (ip), imaginary current (iq) and
the derivative of the real current with respectto time (
). In general, for the complete voltage
flicker compensation, the compensating current (ic)
regarding the currents converted to the dq0 axis is
given as [3]:
where R and X are the synchronous resistance and
reactance of the line and f is the correcting
coefficient. The constant k is also used to eliminate
the average reactive power of the network [3]. If the
compensation current of the above equation is
injected to the network, the whole voltage flicker
existing in the network will be eliminated. Regarding
the equation, related to the dq-transformation of the
3-phase-voltages to the instantaneous vectors, it is
obvious that under the conditions of accessing an
average voltage flicker, Vd and V0, the obtained
values are close to zero and Vq is a proper value
adapting to the voltage oscillation of the network.
This state of the 3-phase voltage flicker is presented
in the following figures (simulated in the MATLAB
Available online: https://edupediapublications.org/journals/index.php/IJR/ P a g e | 1597
Then, we may conclude that the decrease of the
voltage flicker of the network and the compensating
control to decrease the voltage flicker can be limited
only based on the amount of the imaginary
component of the instantaneous voltage (Vq).
COMPENSATION SYSTEM
A typical two-bus power system shown in figure 3 is
simulated in MATLAB for this study. It can be seen
that the voltage oscillation was produced by a
3-phase flicker source connected to the main bus-bar.
The complete STATCOM control system scheme
implemented on MATLAB is shown in figure 4.
First, using a 3-phase converter to dq0, the
instantaneous vectors Vd, Vq and V0, are evaluated
from the output 3-phase voltages whose equations
were explained in the previous section. Then, from
the obtained instantaneous components, sampling is
taken place. Since the controlling system uses just Vq
to control the STATCOM, a de-multiplexer is used to
extract Vq voltage from Vd and V0. The obtained Vq
is then entered as an input to the controlling function
upon the MATLAB software. The controlling
function generates the amount of conducting angle,
needed for the GTOs of the STATCOM. A phase
shifting block is designed to control the appropriate
phase angle of the exerting pulses upon the GTOs of
the STATCOM. The outputs of this unit are entered
into the STATCOM as inputs.
SIMULATION AND ANALYSIS OF THE
RESULTS
In order to investigate the influence of the
STATCOM as an effective mitigating device for
voltage flicker, three types of compensators are
simulated in MATLAB. First, the voltage flicker
compensation is adopted using FCTCR. Then a
6-pulse voltage-source converter STATCOM is used
and finally for a complete voltage flicker mitigation a
12-pulse voltage-source converter STATCOM is
designed. The compensation techniques and their
results are presented in this section.
Available online: https://edupediapublications.org/journals/index.php/IJR/ P a g e | 1598
In this stage a FCTCR; one of the FACTS devices
being controlled by a thyristor is used to mitigate the
voltage flicking. In this case, the exerted voltage
flicker into the system and the compensated voltage
are shown in figures 5 and 6 respectively.
It is obvious from the output voltage waveform
controlled by FCTCR that this technique achieves a
reasonable level of mitigation but is incapable to be
perfectly successful. Furthermore, in spite of using a
snubber circuit [25] to eliminate voltage spikes
caused by the huge TCR reactor switching, there are
still distortions in the output waveform. 2)
Compensation using 6-pulse voltage-source converter
STATCOM 1) The circuit diagram of a three-phase
6-pulse voltage source converter STATCOM is
shown in figure 7. Six valves compose the converter
and each valve is made up of a GTO with a diode
connected in anti-parallel. In this type of STATCOM,
each GTO is fired and blocked one time per line
voltage cycle. In this case, each GTO in a single
branch is conducted during a half-cycle (180 degree)
of the fundamental period. The combined pulses of
each leg have a 120 degrees phase difference to
produce a balanced set of voltages. By adjusting the
conducting angle of the GTOs, the generated voltage
and then the injected or absorbed power of the
STATCOM are controlled. In this respect, the
compensated output voltage by 6-pulse
voltage-source converter STATCOM is presented in figure 8.
It can be seen that the mitigation effects of this
compensator is better than that of FCTCR and
effectively mitigate the voltage flicker; but the output
voltage waveform has some considerable harmonics.
The instantaneous output line-to-line voltage (Vab)
of the 6- pulse voltage-source converter is as follows
As we see it is clearly perceptible from the above
equation that, the even harmonics in the
instantaneous line-to-line voltage has zero value and
does not enter the network voltage. Connecting the
voltage-source converter with a wye-delta
Available online: https://edupediapublications.org/journals/index.php/IJR/ P a g e | 1599
Therefore, the considerable existing characteristic
harmonics in the output voltage waveform in addition
to the fundamental component are 5, 7, 11, 13 and
higher whose values are shown in the harmonic
spectrum of figure 9. It can be observed from the
harmonic spectrum that 5th and 7th harmonics have
considerable level comparing to the fundamental
harmonics. Furthermore, 11th and 13th harmonics are
considerable which should be eliminated from the
network voltage waveforms. However, higher
harmonics (namely 17th, 19th and above) have
values very close to zero
Compensation using 12-pulse voltage-source
converter STATCOM
In order to reduce the harmonic contents at the output
voltage, the number of pulses can be increased,
forming a multi-pulse configuration. Multi-pulse converters are composed by n (n=2, 4, 8 …), where n
is the number of pulses. 6-pulse bridges connected in
parallel on the same DC bus and interconnected in
series through transformers on the AC side.
Depending on the number of pulses, these
transformers and their connections can become very
complex.
Two 6-pulse bridges are connected, forming a
12-pulse converter for a complete voltage flicker
compensation design. In this case, the first converter
is connected with a wye-wye transformer and the
second one with a wye-delta transformer. These are
linked together using a three winding transformer.
Moreover, the delta-connected secondary of the
second transformer must have 3 times the turns
compared to the wye-connected secondary and the
pulse train to one converter is shifted by 30 degrees
with respect to the other. The 12-pulse voltage-source
converter STATCOM circuit diagram is shown in
figure 10
The complete STATCOM control system scheme is
implemented on the power system introduced in
figure 3. The output voltage mitigated by 12-pulse
voltage-source converter STATCOM and its
harmonic spectrum are depicted in figures 11 and 12
respectively. In this respect, the voltage flicker is
completely removed from the output voltage and a
sinusoidal waveform is obtained. Furthermore, it is
clearly obvious (from the harmonic spectrum) that
almost all harmonics are removed from the output
voltage. The only injected harmonics to the system
are 11 and 13 that are deleted adding an RLC active
filter to the designed compensator.
CONCLUSION
The design and application of STATCOM
technology based on voltage-source converters for
voltage flicker mitigation is discussed in this paper.
Available online: https://edupediapublications.org/journals/index.php/IJR/ P a g e | 1600
compared and contrasted. First, FCTCR is used to
compensate for the voltage flicker, then a 6- pulse
voltage-source converter STATCOM and finally a
12- pulse STATCOM based on voltage-source
converter equipped with an RLC filter are designed
for complete voltage flicker compensation without
harmonics. All the simulated results which have been
performed in MATLAB show that a 6-pulse
STATCOM is efficiently effective in decreasing the
voltage flicker of the generating loads. However,
there is injection of the harmonic from STATCOM
into the system which can be improved with the
increase of the voltage source converters of
STATCOM using a 12-pulse STATCOM equipped
with an RLC filter. The obtained results clearly
demonstrate that 12-pulse STATCOM equipped with
an RLC filter can reduce the voltage flicker caused
by nonlinear loads such as electric arc furnaces.
REFERENCES
[1]J. Sun, D. Czarkowski, Z. Zabar, “Voltage Flicker
Mitigation Using PWM-Based Distribution STATCOM”, IEEE Power Engineering Society
Summer Meeting, Vol.1, (21-25 July 2002), pp.
616-621.
[2]J. Mckim, "The UIE Flicker-meter Demystified",
Hewlett- Packard's Power Products Division, 1997.
[3]R. Collantes-Bellido, T. Gomez, "Identification
and Modeling of a Three Phase Arc Furnace for
Voltage Distribution Simulation", IEEE Trans. on
Power Delivery; Vol.12, No.4, (1997), pp.
1812-1817.
[4]L. Tang, S. Kolluri, M.F. McGranaghan, "Voltage
Flicker Prediction for Two Simultaneously Operated
AC Arc Furnaces" IEEE Trans. on Power Delivery;
Vol.12, No.2, (1997), pp. 985-991.
[5]M. Zouiti, S. Saadate, X. Lombard, C. Poumarede, C. Levillain, “Electronic Based Equipment for Flicker Mitigation”, Proceedings of International
Conference on Harmonics And Quality of Power,
Vol.2, (1998), pp. 1182-1187.
[6]T. Larsson, C. Poumarede, “STATCOM, an efficient means for flicker mitigation” IEEE Power Engineering Society Winter Meeting, Vol.2,
(Jan-4Feb 1999), pp. 1208-1213.
[7]C. S. Chen, H. J. Chuang, C. T. Hsu, S. M. Tscng, “Stochastic Voltage Flicker Analysis and Its Mitigation for Steel Industrial Power Systems”, IEEE
Power Tech Proceedings, Vol.1, (10-13 Sept. 2001). [8]Z. Zhang, N. R. Fahmi, W. T. Norris, “Flicker
Analysis and Methods for Electric Arc Furnace Flicker (EAF) Mitigation (A Survey)”, IEEE Power
Tech Proceedings, Vol.1, (10-13 Sept. 2001).
[9]J. R. Clouston, J. H. Gurney, “Field
Demonstration of a Distribution Static Compensator Used to Mitigate Voltage Flicker”, IEEE Power
Engineering Society Winter Meeting, Vol.2, (31
Jan-4Feb 1999), pp. 1138- 1141.
[10]A. Elnady, W. El-khattam, M. A. Salama, “Mitigation of AC Arc Furnace Voltage Flicker Using the Unified Power Quality Conditioner”, IEEE
Power Engineering Society Winter Meeting, Vol.2,
![Figure 10 shows one profile, typical of a motor drive, from [5] showing how voltage changes ΔU are determined for the calculation of d = ΔU/Uab](https://thumb-us.123doks.com/thumbv2/123dok_us/7788801.1289683/6.612.77.280.245.369/figure-profile-typical-showing-voltage-changes-determined-calculation.webp)
