Submission to the OAIC
by
Lateral Economics
prepared by
John Houghton & Nicholas Gruen
About the authors
John Houghton is Professorial Fellow at Victoria University's Centre for Strategic Economic Studies (CSES) and Director of the Centre's Information Technologies and the Information Economy Program. He has published and spoken widely on information technology, industry and science and technology policy issues, and he has been a regular consultant to national and international agencies, including the Organisation for Economic Cooperation and Development. John's research is at the interface of theory and practice with a strong focus on the policy application of economic and social theory, and of leading-edge research in various relevant fields. Consequently, his contribution tends to be in bringing knowledge and research methods to bear on policy issues in an effort to raise the level of policy debate and improve policy outcomes. In 1998, John was awarded a National Australia Day Council, Australia Day Medal for his contribution to IT industry policy development.
Nicholas Gruen is CEO of Lateral Economics and has several decades of
experience of economics and policy making. Dr Gruen was an advisor to Treasurer John Dawkins from 1991 to 1994 and appointed to the Productivity Commission in 1994 and 1995. After three years at the Business Council of Australia directing the Council’s New Directions project, he founded Lateral Economics and Peach Financial. He chaired the internationally acclaimed Federal Government’s Government 2.0 Taskforce; he was on the Expert Panel that reviewed Australia’s Innovation System; he is a board member of Innovation Australia; he was founding chairman of Kaggle, a Silicon Valley-based start-up that crowd sources data analytics, and he is chairman of The Australian Centre for Social Innovation.
Acknowledgements
The authors would like to acknowledge the support of Google Australia in the preparation of this submission. We would also like to acknowledge the support of the Australian National Data Services, the UK Economic and Social Research Council and a number of other funders in the development of the analysis and methods presented, as well as many collaborators on the previous studies through which the work has been refined.
This work is licensed under the Creative Commons Attribution 2.5 Australia License.
Summary
In making this submission, we hope to assist The Office of the Australian
Information Commissioner (OAIC) in developing a methodology for valuing Public Sector Information (PSI) and to contribute to the current draft and design of proposed subsequent agency and user survey questionnaires.
To that end, we extend the literature survey presented in The OAIC's Issues Paper 2 by critically reviewing methods for valuing PSI and exploring their data
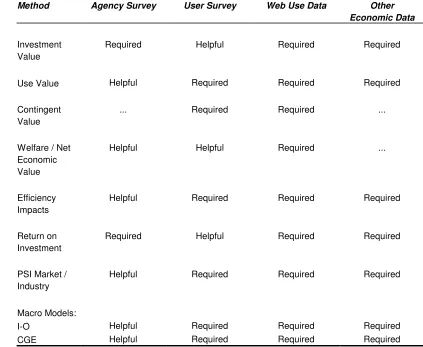
requirements. We note that the various methods answer slightly different questions, depend on different data and data collection methods, and exhibit different strengths and weaknesses. In an attempt to clarify some of the issues, Table 1 presents a preliminary matching of methods to data types and
mechanisms for collection.
Outlining possible approaches to estimating the value of openly publishing PSI, we begin with the most direct agency and user costs and cost savings, suggesting an activity-cost approach. We then move to the wider impacts and benefits of
enhancing the accessibility of PSI, suggesting that a range of possible methods could be used. We then present a brief guide to the data requirements for these methods.
Initially, the feasibility testing of a selection of these methods for measuring the value derived from more open PSI publishing might be approached through agency case studies. Then agency and user surveys might be designed in such a way as to solicit the information required for the selected method or methods, with some confidence that agencies can and will respond, and preliminary analysis done to ascertain the feasibility and operational practicality of the methods vis-à-vis data that can be collected through surveys.
Ultimately, once proven, a selection of such methods might be formalised in a spreadsheet-based cost-benefit model, into which data from agency and user surveys, website and download reports could be combined to generate PSI publishing value and benefit/cost results for individual agencies and, perhaps, government as a whole, on an annual basis. This is not to suggest that it is only about quantitative issues, and throughout the analysis it will be important to integrate qualitative 'valuations' with the quantitative ones (e.g. using a balanced scorecard or similar approach).
Contents
1 BACKGROUND...1
2 PUBLIC SECTOR INFORMATION AND CONTENT...1
3 MEASURING THE VALUE OF PSI AND RELATED INFORMATION ...3
4 APPROACHES AND CONSIDERATIONS...6
4.1 ACTIVITY COSTING OF DIRECT COSTS AND BENEFITS...7
4.1.1 Agency costs and cost savings...8
4.1.2 User costs and cost savings ...10
4.2 EFFICIENCY AND PRODUCTIVITY IMPACTS...11
4.3 WIDER ECONOMIC IMPACTS AND BENEFITS...12
4.3.1 Welfare...12
4.3.2 Returns to investment ...13
4.3.3 Contribution to innovation ...13
4.3.4 PSI market and industry contribution ...14
5 A GUIDE TO DATA REQUIREMENTS...14
6 A MODEL FOR REPORTING...16
1 Background
In Understanding the value of public sector information in Australia (OAIC Issues Paper 2),1 the Office of the Australian Information Commissioner outlines a phased
approach to the question, initially conducting a survey to provide a snapshot of the public sector information (PSI) landscape in Australia, before moving on to the issue of measuring the value of PSI - the proposed topic of subsequent surveys. Ultimately, the aim is to develop a survey-based methodology that will enable agencies to collect the information necessary to address the Government 2.0 Taskforce recommendation that agencies and the OAIC report annually on the value generated by the publication of PSI.
To that end, the OAIC sought submissions on three issues:
• The ideas presented in the Issues Paper: does the paper propose a workable approach for mapping the PSI landscape and developing a methodology for valuing PSI?
• The draft survey form in the Appendix to the paper: is the survey form appropriately framed to address the right issues and gather useful information?
• The literature survey in Part 4 of the paper: does this survey adequately cover the field, and are there gaps or limitations in the existing research?
In making this submission, we are responding to all three of these issues. We hope to assist in developing a methodology for valuing PSI and to contribute to the current draft and design of proposed subsequent agency and user survey questionnaires. To that end, we critically review methods for valuing PSI and explore their data requirements, relating those requirements directly to issues and questions for agency and user surveys.
2 Public sector information and content
The OECD defines Public Sector Information (PSI) as any kind of information that is produced and/or collected by a public body and is part of the institution’s mandated role. It is common to differentiate between public sector information (PSI) and public sector content (PSC). The first category comprises the public sector’s knowledge, which may be the basis for information-intensive industries that use the raw data to produce sophisticated products. The second refers to cultural, educational and scientific public knowledge, for which wide public diffusion and long-term preservation (e.g. via museums, libraries, schools) are major
governmental objectives (OECD 2006).2
Figure 1: Public Sector Information and Content domains with examples Commercial Re-Use PSI Geographic Information Cartographic Land Use (Cadastral)
Spatial / Geographic Admin and Political Boundaries
Topographical Elevation Meteorological and Environmental
Information Oceanographic Hydrographic Environmental (quality) Atmospheric Meteorological (weather) Economic and Business Information
Financial Company Economic Statistics
Industry and Trade Social Information
Demographic Attitude Survey
Health
Education and Labour Force Traffic and Transport Information
Transport Network Traffic Transport Statistics Vehicle Registration Tourist and Leisure Information
Hotel Tourism Entertainment Agriculture, Forestry and Fisheries
Information
Cropping and Land Use Incomes and Resources
Harvest Livestock Natural Resources Information
Biological and Ecological Energy and Resource Consumption
Geological and Geophysical
Legal System Information
Crime and Convictions Laws Rights and Duties
Legislation Judicial Decisions Patents and Trademarks Scientific Information and Research
Data
University Research Publicly-Funded Research
Governmental Research Educational Content Academic Papers and Studies
Course and Lecture Material Political Content
Government Press Releases Government Proceedings
Green Papers Making Available
PSC Cultural Content
Museum and Gallery Archaeological Sites Library Resources Public Service Broadcasts
Public Archives
Note: The steady gradation implied by the arrows is schematic and simplified, as on this axis there would be much overlap between categories. For example, it is easy to imagine some geographic information having less potential for commercial re-use than some social information. It would likewise be possible to provide a similar schematic breakdown of content within each of the categories and sub-categories, which itself would be similarly schematic and simplified.
3 Measuring the value of PSI and related information
Much has been written about the value of information and the benefits of increased access to it. There is an extensive literature on the value of library and information services, and a growing literature on the costs and, to a lesser extent, the benefits of more open access to research publications. To date, less attention has been given to the value of open curation and sharing of research data, although a few studies exist. There is also a rapidly growing literature on the costs and benefits of providing open access to public sector information (PSI). Each of these literatures suggests possible approaches to economic valuation, although some are more directly relevant than others. Our purpose here is to draw ideas from this literature and assess what methods might be most useful.
Library and information serviceshave been the focus of many studies
estimating their value in quantitative and qualitative terms, with the former including numerous studies based on investment and use value and estimates of welfare impacts (e.g. consumer surplus), and fewer based on contingent valuation, often as an input to cost-benefit analysis (Imholz, et al. 2007; Oakleaf 2010).3 Most focus
on the more direct economic impacts and calculate a Return on Investment (RoI), but some explore wider impacts and outcomes (e.g. the relationship between library spending and successful grant applications (Tenopir et al. 2010))4 and
explore Social Return on Investment (SRoI) by combining the quantitative and qualitative measures using a balanced scorecard or similar approach. One example, measuring the economic impact of the British Library, combined
contingent valuation in the forms of willingness to pay and accept with investment value and estimates of the cost of alternatives (British Library 2004).5
Research publications have been the focus of much economic analysis, although most focus on the costs of creation, access and preservation and few studies look at the value and benefits of access. Those addressing the value and benefits have done so from the supply-side, in the form of macro-economic analysis based on estimates of the impacts of changes in accessibility (of the information) and efficiency (in its access and use) on returns to R&D expenditure (Houghton et al, 2009; Houghton and Sheehan 2009);6 and from the demand-side, in the form of
estimates of the impact of research on innovation and the value of that innovation to firms (Mansfield 1991, 1998; Beise and Stahl 1998; Houghton et al. 2011).7 The
latter approach is applicable only when commercial users make up a significant share of total users, and the former is relatively data intensive - depending on robust estimates of levels of spending on the production of information, average returns to that spending and the extent of changes in accessibility and efficiency that result from the information being made more readily available.
sought to identify benefits arising from the curation and open sharing of research data.9 Based on the work of co-authors Houghton and Rasmussen, the report
presented a simple example of cost-benefit analysis applicable to an individual data collection or data repository, based on costs and potential cost savings. The approach was then extended to explore the more diffuse benefits of data curation and sharing at the institutional and disciplinary levels, based on a macro-economic approach to measuring the impact of increased accessibility on returns to research expenditure. Beagrie & Houghton et al. (2012, forthcoming) employ a range of economic methods to explore the value of the UK Economic and Social Data Service, including: investment and use value, contingent valuation using stated preference techniques, economic welfare in the form of consumer surplus and net economic value, as well as estimates of efficiency impacts and increases in returns on investment in data creation arising from the open sharing of data.10 The
analysis was based on an extensive user survey, supported by agency and user interviews and case studies.
Public sector information (PSI) has been the focus of a number of studies seeking to estimate its value and the benefits to be derived from making it more freely available. Approaches have included top-down econometric modelling, extrapolations based on surveys of PSI producers and/or users, estimates based on agency costs and consumers’ willingness to pay (i.e. contingent valuation), and estimates of elasticities and multipliers.
PIRA (2000) combined measures of the investment cost (i.e. the amount spent on the collection/generation of the PSI) and expenditure on PSI by users and re-users, then for final re-users, estimated value as expenditure on PSI or, where the PSI was freely available, as the investment cost of its collection/generation.11 Aside
from the many difficulties in estimation and attribution, a potential problem with the PIRA approach is that it may overestimate the value of PSI because it does not account for the possible use of alternative information.
In the MEPSIR study of Dekkers et al. (2006), demand and economic performance were measured in an extensive survey by directly asking both PSI holders and re-users for key economic data, such as total turnover against turnover related to PSI, total number of staff against the number of staff dedicated to handling PSI, and estimates of the domestic market size for a particular type of PSI. The market value was then estimated from the average revenues multiplied by the average number of re-users per PSI domain, minus the cost of PSI collection/generation.12
This produced a much lower number than suggested by the PIRA study, despite it being market size rather than value added and coming five years later. One issue is that this approach depends on extensive user surveys which may not be practical on a regular basis.
DotEcon (2006)13 and collaborator Pollack (2009)14 adopted a bottom-up approach
prepared to pay over and above what they do pay to have access); and the total producer surplus that arises from the provision of PSI (i.e. the extent to which revenues exceed the costs of supplying the product or service). Adding these two estimates gave the net economic value of PSI. While much less subject to over-estimating the value of PSI, a potential weakness of this approach lay in over-estimating price elasticities of demand, especially where the PSI was supplied free of charge.
ACIL Tasman (2008) used a value-added approach based on General Equilibrium (GE) modelling, with input data derived from case studies, which were used as a guide to estimating the direct impacts of spatial information on selected sectors in the Australian economy, and a GE approach to modelling economy-wide
impacts.15 A potential issue with this approach is how to scale from case studies to
sector-wide impacts (i.e. understanding the relationship between the cases and the sector). As in the case of estimating the value of copyright, a number of studies have attempted to measure the value of PSI from the contribution of the PSI using industries to value-added, employment, etc.16
The National Committee for CODATA at the US National Academies, and the Working Party on the Information Economy at the Organisation for Economic Co-operation and Development held a joint workshop to explore the socio-economic effects of PSI on digital networks, which brought together a range of analysts working on valuing various forms of PSI. The proceedings provide a useful review of work in the area (Uhlir 2009).17 Corbin (2009) also provided a review of
indicators used in PSI studies.18
Vickery (2011) undertook a review of recent evidence on the importance and growth of PSI markets for the European Commission, focusing on quantitative studies; and on the basis of that evidence provided a top-down estimate of the value of the PSI market in Europe and the economic value of PSI in Europe in general.19 The report provides an up-to-date summary of PSI market value studies,
but at a highly aggregated level.
In a study for the Australian National Data Service, Houghton (2011) explored the costs and benefits of free access to PSI and standardised licensing and formats, using the cases of national statistics, fundamental spatial data and hydrological data. While there are many ways in which the provision of more open access to PSI can affect the costs of government agency producers and the many existing and potential users of the information, the study focused on three main elements:
• The costs and cost savings experienced by the PSI producing agencies involved in provision of free and open access to information;
• The costs and cost savings experienced by the users of PSI that relate to accessing, using and re-using the information; and
While all these approaches have their limitations, such studies suggest that bottom-up and top-down approaches, macro-economic and micro-economic approaches are all feasible.
4 Approaches and considerations
Methods that have been applied to measuring the value of PSI include simple investment and use value, contingent valuation using stated preferences, estimates of consumer surplus and net welfare, activity costing approaches to measuring costs, benefits and efficiency impacts, return on investment approaches based on estimating the value of increases in use (as indicated by downloads, etc.), and PSI market and industry size and economic contribution. In some cases, econometric models have been used to estimate economy-wide impacts.
The data requirements for these approaches vary, with some relying on supply-side (agency) data and others on demand-supply-side (user) data, although government agencies can be major users of PSI as well as producers and publishers. Indeed, the OAIC issues paper appears to see PSI producers and users as separate entities when many may not be; and see PSI "producers", "holders" and
"publishers" as the same entity when they may not be. It will be important for the agency survey to clearly address specific PSI-related activities, including: funding, production/collection, acquisition, data assurance, curation/holding/hosting, archival preservation, dissemination, permission, access, use and re-use.
Table 1: Preliminary matching of methods to data types and mechanisms for collection
Method Agency Survey User Survey Web Use Data Other Economic Data
Investment Value
Required Helpful Required Required
Use Value Helpful Required Required Required
Contingent Value
... Required Required ...
Welfare / Net Economic Value
Helpful Helpful Required ...
Efficiency Impacts
Helpful Required Required Required
Return on Investment
Required Helpful Required Required
PSI Market / Industry
Helpful Required Required Required
Macro Models:
I-O Helpful Required Required Required CGE Helpful Required Required Required Note: Other Data includes ABS industry and labour force data, I-O tables and multipliers. Source: Authors' analysis.
It will also be important that the method or methods chosen to measure the value of PSI go beyond availability (access free or at the marginal cost of transfer) and look at the impacts of accessibility (discoverability, metadata, persistence of links, standardised formats, etc.), transparency (standardised and readily
understandable licensing conditions, etc.), and preservation (long-term archival accessibility). All are important in determining the costs faced and potential value available from PSI, and all should be the topic for qualitative and quantitative questions.
4.1
Activity costing of direct costs and benefits
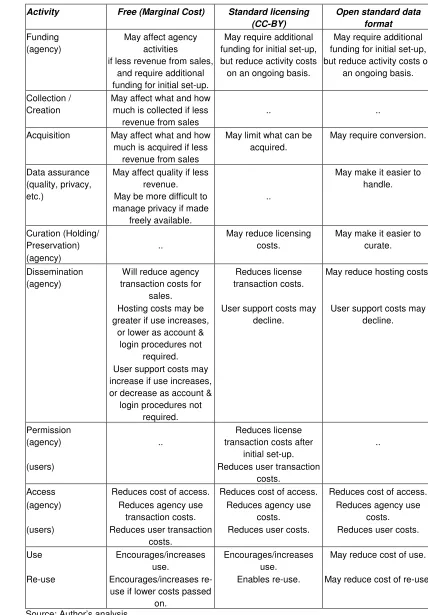
For PSI producing agencies and users, it may be useful to think about possible cost impacts in terms of agency and user activities (i.e. an activity cost model). Based on the analysis of Houghton (2011),21 Table 2 shows some of the main
standardised licensing that is as liberal as possible (Creative Commons - BY), and using standard (open) data formats - which all contribute to the accessibility of PSI.
4.1.1 Agency costs and cost savings
Agency costs and cost savings are the most direct and easily measured. While they will vary from case to case, there are many common elements.
Funding: Making PSI more freely and openly available can have some impacts on agency funding and expenditures. For example, it may affect agency activities if there is less revenue from sales, and it may require additional funding for initial set-up, even though it is likely to reduce activity costs on an ongoing basis.
Collection / Creation / Acquisition: In general, making data freely available will have little or no effect on the activities and costs associated with data collection / creation / acquisition. However, there can be some impacts on what is collected if making information freely available reduces the feedback from users as to what is of most value to them (i.e. reduces market signals). Agencies may also collect / create less, if they lose revenue from data sales and need to manage costs. Loss of revenue may also limit what can be acquired (e.g. consulting reports).
Standardised licensing and data formats are unlikely to have any material impacts on agency collection costs once the standard systems are in place, although acquired data may require conversion to standard format if that standard is not a part of the acquisition requirements.
Data Assurance (e.g. quality, privacy, etc.): Making information freely available may impact data quality positively or negatively: positively if greater exposure and use raises awareness of the importance of quality; negatively if the loss of revenue from data sales puts downward pressure on costs. Free access may increase the costs associated with managing privacy and confidentiality as access and use increases.
Standardised licensing is unlikely to have any substantial impact on data
Table 2: Activity cost impacts for agencies and users
Activity Free (Marginal Cost) Standard licensing (CC-BY)
Open standard data format
Funding (agency)
May affect agency activities
if less revenue from sales, and require additional funding for initial set-up.
May require additional funding for initial set-up, but reduce activity costs on an ongoing basis.
May require additional funding for initial set-up, but reduce activity costs on
an ongoing basis.
Collection / Creation
May affect what and how much is collected if less
revenue from sales
.. ..
Acquisition May affect what and how much is acquired if less
revenue from sales
May limit what can be acquired.
May require conversion.
Data assurance (quality, privacy, etc.)
May affect quality if less revenue. May be more difficult to manage privacy if made
freely available.
..
May make it easier to handle.
Curation (Holding/
Preservation) ..
May reduce licensing costs.
May make it easier to curate. (agency)
Dissemination (agency)
Will reduce agency transaction costs for
sales.
Reduces license transaction costs.
May reduce hosting costs.
Hosting costs may be greater if use increases,
or lower as account & login procedures not
required.
User support costs may decline.
User support costs may decline.
User support costs may increase if use increases, or decrease as account &
login procedures not required. Permission
(agency) ..
Reduces license transaction costs after
initial set-up.
..
(users) Reduces user transaction costs.
Access Reduces cost of access. Reduces cost of access. Reduces cost of access. (agency) Reduces agency use
transaction costs.
Reduces agency use costs.
Reduces agency use costs. (users) Reduces user transaction
costs.
Reduces user costs. Reduces user costs.
Use Encourages/increases use.
Encourages/increases use.
May reduce cost of use.
Re-use Encourages/increases re-use if lower costs passed
on.
Enables re-use. May reduce cost of re-use.
Curation (agency): Data curation costs are unlikely to be affected by making information freely available or standardised licensing, although associating
licensing conditions and licenses to particular datasets would be somewhat easier. It may also be that openness would enable users to contribute to curation (e.g.
identifying problems and suggesting solutions). Standardisation of data formats would be likely to make digital curation easier and reduce curation costs.
Dissemination (agency): Making information freely available is likely to have substantial impact on agency dissemination costs. Agency transaction costs associated with data sales will be reduced/eliminated (e.g. operation of sales outlets or e-commerce functions, banking charges associated with sales
transactions, operation of access controls, etc.). Data hosting costs may decrease with reduced access control and purchase association and tracking, and/or they may increase if use increases. User support costs may also decrease with fewer access issues, and/or increase as use increases.
Standardised licensing is likely to reduce agency costs associated with developing and managing licensing, and reduce license-related user enquiry and support costs. Standardised data formats are also likely to reduce hosting and user support costs.
Which is the biggest and most important costs and cost savings will vary for each agency and each data type.
4.1.2 User costs and cost savings
There will be differences in user cost impacts from case to case and the dividing line between agency and user cost issues will vary. Nevertheless, there are likely to be common elements.
Permission (users): Standardised licensing is likely to reduce the user costs related to licensing (e.g. easier to understand licenses, standardisation across datasets and agencies, fewer license-related enquiries, reduced transaction cost in accessing / obtaining licenses, etc.). Free access and standardised data formats are unlikely to have any material impact of user permission related costs. As noted above, agency license-related transaction costs are also likely to fall after the initial one-off set-up costs have been met.
Access (users): Free access obviously reduces the users’ cost of access in terms of the prices paid and the transaction costs involved in each transaction/use. As noted above, agency access-related transaction costs will also be lower. Standardised licensing and data formats may also reduce user access and transaction-related costs.
Re-use: Similarly, as another form of use, free access is likely to encourage greater re-use of the information, while standardised licensing and data formats are also likely to reduce the cost of, and thereby encourage greater re-use.
4.2
Efficiency and productivity impacts
In addition to the more direct agency and user activity costs and cost savings, there are a number of possible efficiency and productivity impacts arising from free or marginal cost access and standardised licensing and data formats.
For agencies, potential efficiency and productivity impacts include:
• An increase in the level of use and uses per funding dollar, and enhanced performance against key performance indicators;
• Enhanced agency profile from greater use and exposure, which can result in greater appreciation and central funding, and/or bring greater demand for enhanced products and services, thereby increasing revenue; and
• Greater focus on core business activities (e.g. reduced shopfront and e-commerce operations, reduced legal and IT user support costs, etc.).
For users, potential efficiency and productivity impacts include:
• Purchase cost savings and savings in handling and transaction costs (noted above), enabling cost reduction and efficiency gains (i.e. doing the same for less);
• Greater licensing certainty / reduced risk and freedom to use, leading to more predicable investment decisions, as well as savings in licensing enquiry efforts;
• Use of better / fuller / more detailed data, rather than settling for a lesser / cheaper substitute;
• The possibility of using automated analysis, making new forms of content and enabling serendipitous connections to be made and new uses and applications discovered; and
• Enhanced access and greater certainty encouraging innovation, with significant growth effects for users and their customers.
There are also some important dynamics affecting the costs and benefits of more open access to PSI. For example, there may be first mover costs for agencies and users, making more open access, standardised licensing and data formats less cost-effective for the pioneers than it is for the followers who can learn from the pioneers. There may also be first mover advantages, such as the kudos of being a leader. This may mean that the costs and benefits experienced by first movers will tend to understate the longer-term advantages.
experienced in the early years of implementation tend to understate the longer-term advantages.
There may be timing impacts and costs, as it is important how quickly data are available and how quickly licensing can be understood and affected (e.g.
immediacy of access is important in use and avoids potentially costly delays and workflow/decision making interruptions).
There may also be timing impacts relating to learning, as understanding of the conditions of access and licensing become more familiar to users over time and as more agencies embrace more open access and standardised licensing and data formats. Again, this may mean that the costs and benefits experienced in the early years of implementation tend to understate the longer-term advantages.
There may also be scale economies, with greater benefits accruing as an agency’s and/or user’s suite of activities fall under the more open access and standardised regime. These can be significant, and may also mean that the costs and benefits experienced in the early years of implementation tend to understate the longer-term advantages.
4.3
Wider economic impacts and benefits
In the longer term, there may also be unforseen uses and re-uses that simply cannot be accounted for, and again this may mean that the costs and benefits experienced in the early years of implementation tend to understate the longer-term advantages. Use and re-use can also have wider impacts, in longer-terms of innovation and the development and introduction of new products, services and processes that, in turn, generate new economic activity, new business
opportunities, better informed and potentially better government and business decisions.
While there are a number of approaches to measuring the wider benefits of enhanced access to PSI, here we focus on four that have some track record. The first uses a simple welfare approach and might be interpreted as indicative of the lower bound impact, the others use macro-economic approaches in an attempt to include the multiplier impacts that are not captured in the first.
4.3.1 Welfare
The benefit that a consumer derives or consumer surplus is the difference between the price that the consumer is willing to pay and the price actually paid (i.e. the net economic benefit to consumers). The level of consumer surplus depends on the price elasticity of demand, which is the percentage change in demand resulting from a percentage change in price. While there are many limitations when the price change is large and the price approaches zero, consumer surplus can be
Where there has never been a market for the information, an alternative way of estimating consumer surplus is through contingent valuation using stated preference techniques - asking users what they would be willing to pay for, or accept in return for giving up, their access. Using stated preference techniques in surveys is challenging,23 but has been done successfully in studies of information
and related services.24 In a non-market context, all the willingness to pay is
consumer surplus because there is no market price. In practice, however, some expenditure, be it in the form of time or money, will be incurred in obtaining the non-market good or service (e.g. the time spent accessing the data). In this case, the consumer surplus will be the net gain (i.e. willingness to pay minus the cost of obtaining).
4.3.2 Returns to investment
There are similarities between some forms of observational and survey-based PSI and the publications and data arising from publicly funded research. To that extent, in some cases, it may be possible to use methods relating to returns to R&D to explore the wider impacts of making some forms of PSI freely available online (Houghton 2009).25
The standard Solow-Swan model makes some key simplifying assumptions, including the assumptions that all knowledge is equally accessible to all entities that could make productive use of it, and all R&D generates knowledge that is useful in economic or social terms. Obviously, this is not realistic. In the real world, there are limits to efficiency and barriers to access. Houghton and Sheehan (2009) developed and applied a modified Solow-Swan model in which they introduced
accessibility and efficiency as negative or friction variables, and then looked at the impact on returns to R&D of reducing the friction by increasing accessibility and/or
efficiency.26
While there are limitations when applying average returns to specific forms of data, indicative changes in return on investment can be estimated from agency
expenditure data and information on the change in demand (e.g. change in the level of use reflected in downloads). Other estimation parameters can be drawn from the literature and existing work on R&D satellite accounts.
4.3.3 Contribution to innovation
In an exploration of the accessibility and use of research and technical information, Houghton et al. (2011) adapted innovation survey questions to estimate the contribution of academic research to innovation and the value of that innovation to firms.27 In their survey of knowledge-based small to medium-sized enterprises
So academic research was contributing the equivalent of around 12% of sales revenue among these firms.
Such an approach could inform user surveys and provide the foundation for estimates of the innovation impacts of access to PSI. This would also help to establish a number of parameters for economic analysis (e.g. average and marginal returns to PSI, impact lags and durations, etc.).
4.3.4 PSI market and industry contribution
The brief review of studies estimating the value of PSI presented above, and that in the OAIC Issues Paper, include a number of major studies that have estimated the PSI market and user / re-user industry size, primarily in the US and Europe, based on agency and user surveys. Typically, market or industry value is estimated from the average revenues multiplied by the average number of users/re-users in each PSI domain, minus the cost of PSI collection/creation. Estimates can then be made of the PSI industries' contribution to employment and value-added (i.e. as a share of GDP). Such estimates tend to be at the upper end of valuations.
Wider multiplier effects might then be explored using Input-Output (I-O) or General Equilibrium (GE) models. An example of this is the series of studies by ACIL Tasman, who used a value-added approach based on General Equilibrium (GE) modelling, with input data derived from case studies, which were used as a guide to estimating the direct impacts of spatial information on selected sectors in the Australian economy, and a GE approach to modelling economy-wide impacts.28
5 A guide to data requirements
As suggested by Houghton (2011),29 the background information required for
analysis includes an understanding of the PSI producing agency, its PSI holdings and "business models", its users and PSI uses. For example, it may be important to:
• Clarify exactly what is and what is not freely available (free gratis and free
libre), and to understand the mix and shares of each, costs of and revenues from each;
• Consider the issue of incentives for the agency of the various charging policies and agency funding sources (e.g. is revenue foregone from PSI sales lost or will government increase funding to compensate?);
• Explore agency revenue models (e.g. ‘freemium’ – free basic and charged premium), and what the relationship may be between free and priced products and services (e.g. is ‘freemium’ revenue maximising?); and
• Examine agency revenue trends from all possible sources.
the money and time spent on the activities, plus materials and overheads. For example, this might include:
• Costs of data and access to the data for users (use) and for the providing agency (provision);
• Costs of data and data access related activities for users (use) and for the providing agency (provision);
• Costs of a pay and/or licensing system, including: time spent on licensing requests (users and agency), and the number of requests processed, time spent and transaction costs of priced access (users and agency), and the number of transactions;
• Revenues gained and/or foregone, for the data directly and for other agency and/or related products and services;
• Impacts on business (e.g. freemium issues, such as to what extent making the PSI freely available affects priced business lines); and
• Agency incentives (e.g. level of collection if supporting revenue is lost, possible impacts on quality, etc.).
For use, it is necessary to understand how the change to making the PSI freely available affects demand and use. The key data required will be usage trends, in terms of visits, inquiries, purchases, datasets accessed, downloads, website hits, etc. It will be necessary to:
• Tease out the issues of format (print versus digital online) from those of revenue model (priced versus free), so it is necessary to know use trends for both online and print materials and priced and free materials (i.e.
longer-term usage trends);
• Consider adjusting these usage data for other factors and wider trends, such as: the impacts of online volumes on use to explore intensification versus extension of use (e.g. adjust for downloads per item available); the context of increasing downloads of everything (e.g. national or other trends in the volume of data downloaded by Internet users); and the influence of information cycles on usage trends, such as special PSI data release cycles (e.g. ABS Census release cycles), government cycles (e.g. pre/post elections), general business cycles, etc.; and
above); and the contribution of PSI to innovation and the value of that innovation in terms of sales and cost savings.
For basic measures of the value of the PSI, it is necessary to explore: • The cost of production (collection/generation) of the PSI (i.e. minimum
value / investment value);
• The costs of access and use of the PSI (i.e. minimum value / use value);
• Estimates of price elasticities of demand by PSI type and domain and/or estimates of users’ willingness to pay by PSI type and domain (e.g. to use for estimates of consumer surplus);
• Estimates of the efficiency and innovation impacts from user surveys and reports (e.g. to use for estimates of efficiency and innovation impacts);
• Estimates and records of use increases and cost per use (e.g. to use in estimates of returns on investment); and
• Estimates of the market revenues and value-added of users and re-users (i.e. to use in estimates of macroeconomic impacts).
Of course, it is unlikely that any agency or user survey will collect all of the data necessary for a complete analysis. Nevertheless, the methods outlined above have been used, more or less successfully, to value publications, data and services similar in many respects to PSI, as well as PSI itself. All are feasible on the basis of agency and user surveys, website statistics and download data, and other general national statistical data. A selected combination of methods could be used to build up a more complete picture of the value derived from more open PSI publication.
6 A model for reporting
Initially, the feasibility testing of a selection of these methods for measuring the value derived from more open PSI publishing might be approached through agency case studies. Face-to-face interaction with the case study agencies would help to establish what information might, and might not, practically be collected from surveys, and help in the subsequent design of questions for survey questionnaires.
Then agency and user surveys might be designed in such a way as to solicit the information required for the selected method or methods, with some confidence that agencies can and will respond, and preliminary analysis done to ascertain the feasibility and operational practicality of the methods vis-à-vis data that can be collected through surveys. Recent experience in studies of the value of PSI and research data services suggests that there will be a number of issues to resolve before a sufficient level of confidence can be assured in the findings (e.g.
weighting the survey data to reflect wider activities and use).
surveys, website and download reports could be combined to generate PSI publishing value and benefit/cost results for individual agencies and, perhaps, government(s) as a whole, on an annual basis. This is not to suggest that it is only about quantitative issues, and throughout the analysis it will be important to integrate qualitative 'valuations' with the quantitative (e.g. using a balanced scorecard approach).
Endnotes and references
1 OAIC (2011) Understanding the value of public sector information in Australia, OAIC Issues Paper 2, Canberra. Available http://www.oaic.gov.au/news/consultations.html#issues_paper2 (January 2012).
2 OECD (2006) Digital Broadband Content: Public Sector Information and Content, OECD, Paris. Available http://www.oecd.org/document/62/0,3746,en_2649_34223_32160190_1_1_1_1,00.html
(April 2011).
3 Imholz, S., & Arns, J. (2007) Worth Their Weight: An Assessment of the Evolving Field of Library Valuation, New York: Americans for Libraries Council. Available
http://www.ala.org/ala/research/librarystats/worththeirweight.pdf (December 2011). Oakleaf, M. (2010) Value of Academic Libraries: A Comprehensive Research Review and Report, Chicago: Association of College and Research Libraries (ACRL). Available
http://www.ala.org/acrl/sites/ala.org.acrl/files/content/issues/value/val_bibliography.pdf (December 2011).
4 Tenopir, C., Love, A., Park, J., Wu, L., Baer, A., & Mays, R. (2010) University Investment in the Library, Phase II: An International Study of the Library's Value to the Grants Process, Elsevier Connect White Paper. Available http://libraryconnect.elsevier.com/whitepapers/roi2/lcwp021001.html
(December 2011).
5 British Library. (2004) Measuring the Economic Impact of the British Library, [note: a powerpoint slide presentation based on unpublished report]. Available
http://www.bl.uk/aboutus/stratpolprog/increasingvalue/publicvalue/confpres/pungelwesmarks.pdf
(December 2011).
6 Houghton, J.W., Rasmussen, B., Sheehan, P.J., Oppenheim, C., Morris, A., Creaser, C., et al. (2009) Economic Implications of Alternative Scholarly Publishing Models: Exploring the Costs and Benefits, Report to The Joint Information Systems Committee (JISC) by Victoria University & Loughborough University. Available http://www.cfses.com/EI-ASPM/ (January 2012). Houghton, J.W., & Sheehan, P. (2009) Estimating the potential impacts of open access to research findings, Economic Analysis and Policy 39(1). Available http://www.eap-journal.com/vol_39_iss_1.php
(January 2012).
7 Mansfield, E. (1991) Academic research and industrial innovation. Research Policy 20(1), pp1-12. Mansfield, E. (1998) Academic research and industrial innovation: an update of empirical findings. Research Policy 26(7/8), pp773-776. Beise, M., & Stahl, H. (1998) Public Research and Industrial Innovations in Germany, ZEW Discussion Paper No. 98-37. Available
http://ideas.repec.org/p/zbw/zewdip/5209.html (December 2011). Houghton, J.W., Swan, A., & Brown, S. (2011) Access to Research and Technical Information in Denmark, Forsknings- og Innovationsstyrelsen and Denmark's Electronic Research Library (April 2011). Available
http://www.fi.dk/publikationer/2011/adgang-til-forskningsresultater-og-teknisk-information-i-danmark
(December 2011).
8 Beagrie, N., Chruszcz, J., & Lavoie, B. (2008) Keeping Research Data Safe: a cost model and guidance for UK Universities, Joint Information Systems Committee. Available
http://www.jisc.ac.uk/publications/publications/keepingresearchdatasafe.aspx (December 2011). Beagrie, N., Lavoie, B., & Woollard, M. (2010) Keeping Research Data Safe 2 Final Report London: JISC. Available
http://www.jisc.ac.uk/publications/reports/2010/keepingresearchdatasafe2.aspx#downloads
(December 2011).
http://www.jisc.ac.uk/media/documents/programmes/digitalrepositories/jiscdataproposal-public.pdf
(December 2011).
10http://blog.beagrie.com/2011/11/10/new-projects-for-2011-2013/.
11 PIRA. (2000) Commercial exploitation of Europe’s public sector information, Brussels: European Commission. Available
http://www.epsiplus.net/psi_library/reports/commercial_exploitation_of_europe_s_public_sector_info rmation_pira_study (December 2011).
12 Dekkers, M., Polman, F., te Velde, R., & de Vries, M. (2006) MEPSIR: Measuring European Public Sector Information Resources, Brussels: European Commission. Available
http://www.epsiplus.net/psi_library/reports/mepsir_measuring_european_public_sector_resources_r eport (December 2011).
13 DotEcon. (2006) The commercial use of public information (CUPI), Report oft861, London: Office of Fair Trading. Available
http://www.oft.gov.uk/OFTwork/publications/publication-categories/reports/consumer-protection/oft861 (December 2011).
14 Pollack, R. (2009) The Economics of Public Sector Information, CWPE 0920, Cambridge: University of Cambridge. Available http://www.econ.cam.ac.uk/dae/repec/cam/pdf/cwpe0920.pdf
(December 2011).
15 ACIL Tasman. (2008) The Value of Spatial Information, Spatial Information Systems Limited. Available www.crcsi.com.au/uploads/publications/PUBLICATION_324.pdf(April 2011).
16 WIPO (2003). Guide on Surveying the Economic Contribution of Copyright-Based Industries, Geneva. Available
http://www.wipo.int/ip-development/en/creative_industry/economic_contribution.html (January 2012).
17 Paul Uhlir ed. (2009) The socioeconomic effects of public sector information on digital networks: Towards a better understanding of different access and reuse policies, National Academies Press, Washington DC. Available http://www.nap.edu/openbook.php?record_id=12687&page=40 (April 2011).
18 Corbin, C. (2009) A review of indicators used in PSI studies, EC PSI Group. Available
http://www.docstoc.com/docs/38748503/A-review-of-indicators-used-in-Public-Sector-Information
(January 2012).
19 Vickery, G. (2011) Review of recent studies on PSI re-use and related market developments, Report to the European Commission by Information Economics, Paris. Available
http://ec.europa.eu/information_society/policy/psi/docs/pdfs/report/psi_final_version_formatted.docx
(January 2012).
20 Houghton, J.W. (2011) Costs and benefits of data provision, Report to The Australian National Data Service, Canberra. Available http://ands.org.au/resource/cost-benefit.html (December 2011).
21 Houghton, J.W. (2011) Costs and benefits of data provision, Report to The Australian National Data Service, Canberra. Available http://ands.org.au/resource/cost-benefit.html (December 2011).
22 DotEcon. (2006) The commercial use of public information (CUPI), Report oft861, Office of Fair Trading, London, Annexe G, p34. Available http://www.oft.gov.uk/OFTwork/publications/publication-categories/reports/consumer-protection/oft861 (April 2011).
23 DTLR. (2002) Economic Valuation with Stated Preference Techniques, London: Department of Transport, Local Government and the Regions, for a summary guide. Available
http://www.communities.gov.uk/documents/corporate/pdf/146871.pdf (November 2011).
24 British Library. (2004) Measuring the Economic Impact of the British Library, [note: a power point slide presentation based on unpublished report]. Available
(November 2011). Beagrie, N., Houghton J.W., Palaiologk, A. and Williams, P (2012 forthcoming) Economic Evaluation of Research Data Service Infrastructure, Economic and Social Research Council (forthcoming).
25 Houghton, J.W. (2009) 'Exploring the impacts of enhanced access to publicly funded research,' in Paul Uhlir (ed.) The socioeconomic effects of public sector information on digital networks: Towards a better understanding of different access and reuse policies, National Academies Press,
Washington DC. Available http://www.nap.edu/openbook.php?record_id=12687&page=40 (April 2011).
26 For details of the method see Houghton, J.W. and Sheehan, P. (2009) ‘Estimating the potential impacts of open access to research findings,’ Economic Analysis and Policy 39(1). Available
http://www.eap-journal.com/vol_39_iss_1.php (April 2011); and Houghton, J.W., Rasmussen, B., Sheehan, P.J., Oppenheim, C., Morris, A., Creaser, C., Greenwood, H., Summers, M. and Gourlay, A. (2009) Economic Implications of Alternative Scholarly Publishing Models: Exploring the Costs and Benefits, Report to The Joint Information Systems Committee (JISC) by Victoria University & Loughborough University. Available http://www.cfses.com/EI-ASPM/ (April 2011).
27 Houghton, J.W., Swan, A., & Brown, S. (2011) Access to Research and Technical Information in Denmark, Forsknings- og Innovationsstyrelsen and Denmark's Electronic Research Library (April 2011). Available http://www.fi.dk/publikationer/2011/adgang-til-forskningsresultater-og-teknisk-information-i-danmark (December 2011).
28 See, for example, ACIL Tasman. (2008) The Value of Spatial Information, Spatial Information Systems Limited. Available www.crcsi.com.au/uploads/publications/PUBLICATION_324.pdf(April 2011).
29 Houghton, J.W. (2011) Costs and benefits of data provision, Report to The Australian National Data Service, Canberra. Available http://ands.org.au/resource/cost-benefit.html (December 2011).
Disclaimer
While every effort has been made to ensure its accuracy, neither Lateral