Electronic Thesis and Dissertation Repository
8-14-2013 12:00 AM
Investigation of Auditory Encoding and the Use of Auditory
Investigation of Auditory Encoding and the Use of Auditory
Feedback During Speech Production
Feedback During Speech Production
Laura E. Beamish
The University of Western Ontario
Supervisor Dr. David Purcell
The University of Western Ontario Graduate Program in Neuroscience
A thesis submitted in partial fulfillment of the requirements for the degree in Master of Science © Laura E. Beamish 2013
Follow this and additional works at: https://ir.lib.uwo.ca/etd
Part of the Neuroscience and Neurobiology Commons, and the Speech and Hearing Science Commons
Recommended Citation Recommended Citation
Beamish, Laura E., "Investigation of Auditory Encoding and the Use of Auditory Feedback During Speech Production" (2013). Electronic Thesis and Dissertation Repository. 1591.
https://ir.lib.uwo.ca/etd/1591
This Dissertation/Thesis is brought to you for free and open access by Scholarship@Western. It has been accepted for inclusion in Electronic Thesis and Dissertation Repository by an authorized administrator of
(Thesis format: Monograph)
by
Laura Beamish
Graduate Program in Neuroscience
A thesis submitted in partial fulfillment of the requirements for the degree of
Master of Science
The School of Graduate and Postdoctoral Studies Western University
London, Ontario, Canada
© Laura Beamish 2013
ii
Abstract
Responses to altered auditory feedback during speech production are highly variable. The extent to which auditory encoding influences this varied use is not well understood. Thirty-nine normal hearing adults completed a first formant (F1) manipulation paradigm where F1 of the vowel /ε/ was shifted upwards in frequency towards an /æ/–like vowel in real-time. Frequency following responses (FFRs) and envelope following responses (EFRs) were used to measure neuronal activity to the same vowels produced by the participant and a prototypical talker. Cochlear tuning, measured by SFOAEs and a psychophysical method, was also recorded. Results showed that average F1 production changed to oppose the manipulation. Three metrics of EFR and FFR encoding were evaluated. No reliable relationship was found between speech compensation and evoked response measures or measures of cochlear tuning. Differences in brainstem encoding of vowels and sharpness of cochlear tuning do not appear to explain the variability observed in speech production.
Keywords
iii
Acknowledgments
First and foremost I would like to thank my supervisor Dr. David Purcell for his
unwavering support and guidance over the past two years. I am extremely grateful for all your encouragement, ideas and kindness over the past two years.
I would like to thank my advisory committee, Dr. Jessica Grahn, Dr. Lisa Archibald and Dr. Derek Mitchell for their knowledge and expertise throughout this research project.
To my SAFER lab mates and friends, thank-you for your support and advice over the past two years.
iv
Table of Contents
Abstract ... ii
Acknowledgments ... iii
Table of Contents ... iv
List of Tables ... vii
List of Figures ... viii
List of Appendices ... x
List of Abbreviations ... xi
Chapter 1 ... 1
1 Introduction ... 1
1.1 Introduction to Canadian English Vowels ... 2
1.2 Auditory Feedback ... 4
1.2.1 Pitch Shifts ... 6
1.2.2 Formant Perturbations ... 6
1.3 Psychoacoustic and Physiological measures of cochlear tuning ... 9
1.4 Auditory Evoked potentials ... 12
1.5 Frequency Following Response (FFR) ... 14
1.6 Envelope Following Response (EFR) ... 16
1.7 Rationale ... 17
1.8 Hypotheses ... 17
Chapter 2 ... 19
2 Methods ... 19
2.1 Participants ... 19
2.2 Summary of Procedures ... 19
2.3 Perceptual Measures ... 20
2.3.1 Vowel goodness ... 20
2.3.2 F1 discrimination threshold ... 22
2.3.3 Psychoacoustic tuning curves ... 22
v
2.4.1 Equipment ... 23
2.4.2 Formant Estimation ... 24
2.4.3 Procedure and experimental conditions ... 24
2.4.4 Online voice detection and formant shifting ... 25
2.4.5 Offline formant analysis ... 26
2.5 Otoacoustic Emissions ... 26
2.5.1 Stimulus generation and recording ... 26
2.6 Evoked Potentials ... 27
2.6.1 Stimuli ... 27
2.6.2 Polarity asymmetry in the EFR ... 28
2.6.3 Stimulus presentation and response recording ... 29
2.6.4 Offline response analysis ... 30
2.6.5 Envelope and frequency following response estimation ... 30
2.6.6 Response detection ... 30
Chapter 3 ... 32
3 Results ... 32
3.1 Speech ... 32
3.1.1 F1 Discrimination threshold ... 32
3.1.2 Vowel goodness ratings ... 32
3.1.3 Speech compensation for English /ε/ in “head” ... 32
3.2 Relationships between perception and production ... 33
3.3 Auditory Filter Bandwidth ... 33
3.3.1 Fast psychoacoustic tuning curves ... 33
3.3.2 Stimulus frequency otoacoustic emissions ... 37
3.3.3 Comparison between SWPTC and SFOAE ... 37
3.4 Electrophysiological measures ... 37
3.4.1 Envelope following response and frequency following response ... 37
3.4.2 Relationships between the EFR and FFR and speech compensation ... 51
Chapter 4 ... 68
4 Discussion ... 68
4.1 Compensation ... 68
vi
4.3 Envelope Following Response ... 71
4.4 Frequency Following Response ... 72
4.5 Compensation versus EFR and FFR ... 73
4.6 Tuning and Compensation ... 77
4.7 Perception & Compensation ... 79
4.8 Closing remarks, limitations, and future work ... 79
vii
List of Tables
Table 1. Significant individual correlations (p<0.05) between vowel goodness ratings and
F1 compensation in vowel production. ... 42
Table 2. EFR Responses for Polarity A. ... 53
Table 3. EFR Responses for Polarity B. ... 54
Table 4. EFR Response magnitude for Polarity A and B. ... 55
Table 5. FFR Responses for Polarity A. ... 57
Table 6. FFR Responses for Polarity B. ... 58
Table 7. EFR and speech compensation linear correlations for polarity A. ... 62
Table 8. EFR and speech compensation linear correlations for polarity B. ... 63
Table 10. FFR and speech compensation linear correlations for polarity B. ... 67
viii
List of Figures
Figure 1. Canadian-English vowel space. ... 3
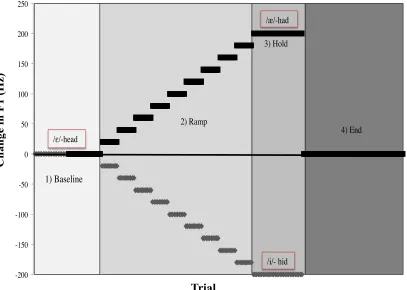
Figure 2. Representation of the phases in formant-shift paradigms. ... 8
Figure 3. Example of psychoacoustic tuning curves. ... 11
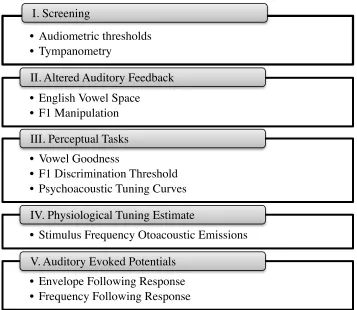
Figure 4. Overview of study methodology and measurements ... 21
Figure 5. Plot of group and individual F1 discrimination thresholds. ... 34
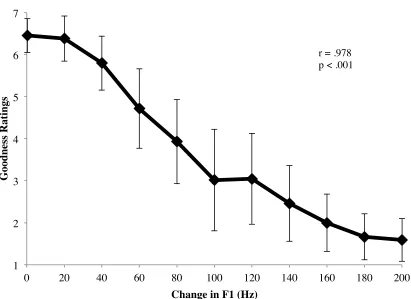
Figure 6. Mean vowel goodness ratings. ... 35
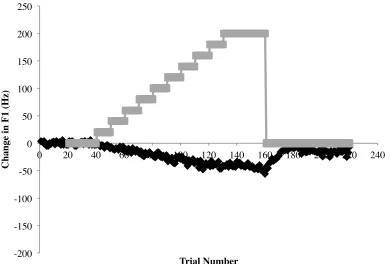
Figure 7. Average normalized F1 compensation during altered auditory feedback. ... 36
Figure 8. Average normalized F1 results for English /ε/ as in “head” across the Ramp phase, the Hold phase and the End phase. ... 38
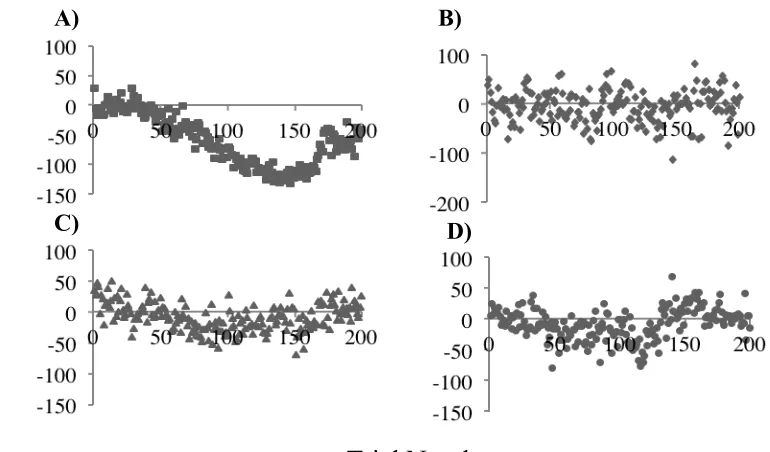
Figure 9. Individual variation in F1 production during altered auditory feedback. ... 39
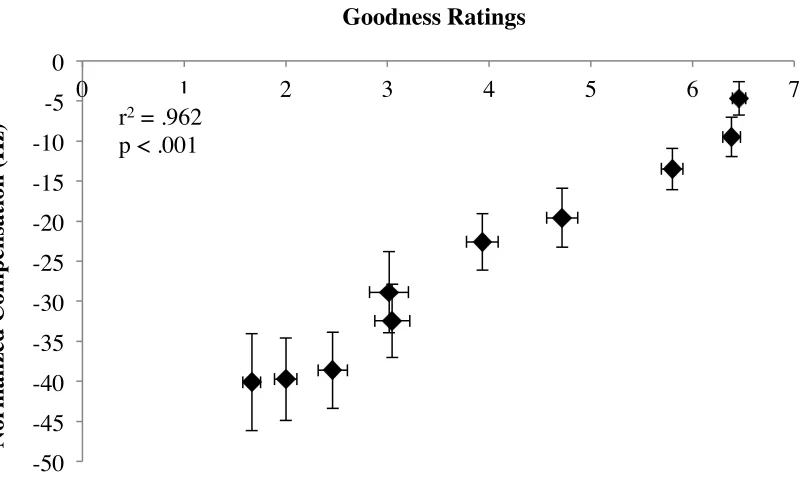
Figure 10. Correlation between goodness ratings and F1 compensation for /ε/ in “head” on a continuum towards /æ/ in had. ... 40
Figure 11. Plot of individual vowel goodness ratings compared to F1 compensation values for each Ramp step. ... 41
Figure 12. Example of individual trial from the SWPTC program. ... 43
Figure 13. Estimated individual and group average auditory filter bandwidth from the SWPTC program. ... 44
Figure 14. Correlation between SWPTC filter bandwidth and compensation. ... 45
Figure 15. Example of individual SFOAE analysis. ... 46
ix
Figure 17. Correlation between SFOAE filter bandwidth and compensation. ... 48
Figure 18. Correlation between SFOAE bandwidth and SWPTC bandwidth. ... 49
Figure 19. Average EFR Amplitude for significant responses. ... 52
Figure 20. Average FFR Amplitude for significant responses. ... 56
Figure 21. Absolute amplitude (nV) of EFR to “head” correlated with compensation magnitude (Hz). ... 59
Figure 22. Change in EFR amplitude (nV) from “head” to “had” (no phase) correlated with compensation magnitude (Hz). ... 60
Figure 23. EFR Change in magnitude (nV) from “head” to “had” (including response phase) correlated with compensation magnitude (Hz). ... 61
Figure 24. Absolute amplitude (nV) of FFR to “head” correlated with compensation magnitude (Hz). ... 64
Figure 25. Change in FFR amplitude (nV) from “head” to “had” (no phase) correlated with compensation magnitude (Hz). ... 65
x
List of Appendices
Appendix A: Ethics approval notice ... 92
Appendix B: Forms and questionnaires for participant ... 93
xi
List of Abbreviations
2AFC Two-alternative forced choiceµs Microseconds
AEP Auditory evoked potentials
ASSR Auditory steady-state response
BMO Best model order
BM Basilar membrane
CN Cochlear nucleus
CVC Consonant vowel consonant word
DAF Delayed auditory feedback
dB Decibels
DPOAE Distortion product otoacoustic emissions
DIVA Directions in an orosensory space Into Velocities of Articulators
DNLL Dorsal nucleus of the lateral lemniscus
EEG Electroencephalography
EFR Envelope following response
ERB Equivalent rectangular bandwidth
ƒ0 Fundamental frequency
F1 First formant
F2 Second formant
F3 Third formant
FFR Frequency following response
HL Hearing level
Hz Hertz
xii LPC Linear predictive coding
ms Milliseconds
OAE Otoacoustic emissions
OHC Outer hair cells
nV Nano volts
PTC Psychoacoustic tuning curve
SD Standard deviation
SFOAE Stimulus frequency otoacoustic emissions
SNR Signal to noise ratio
SOAE Spontaneous otoacoustic emissions
SPL Sound pressure level
SWPTC Fast psychoacoustic tuning curve program
TEOAE Transient evoked otoacoustic emissions
VNLL Ventral nucleus of the later lemniscus
VOT Voice onset time
yr Years of age
Chapter 1
1
Introduction
Auditory information from one’s own voice during speech production plays a role in
maintaining its accuracy and fluency. Auditory feedback provides talkers with
information regarding different elements of their ongoing speech (i.e. intensity, spectral,
and temporal information) and allows individuals to monitor and adjust their production
when required. Speech production can be greatly affected if the feedback received is
disrupted while talking.
Studies have examined the consequences of perturbations to auditory feedback through
pitch-shifted auditory feedback (Burnett, Freedland, Larson, & Hain, 1998), temporal
disruptions to running speech (Yates, 1963), loudness changes (Summers, Pisoni,
Bernacki, Pedlow, & Stokes, 1988) and spectral changes (Garber, Seigel, & Pick, 1981).
Results from these studies demonstrate that individuals vary substantially in their use of
auditory feedback, however, in general, all perturbations are met with a speech
production response that opposes the manipulation.
The influence of auditory feedback during speech production is well documented,
although the mechanisms underlying the processing of acoustic information and how this
in turn influences production are not completely understood. The role the auditory system
plays in encoding the acoustic signal into useful information to guide production requires
further investigation.
Incoming auditory information is processed by both the peripheral and central auditory
systems. The peripheral auditory system is obviously essential for using auditory
feedback during speech production, but further investigation into what aspects of
peripheral function are influencing how individuals use auditory feedback is required.
One way to assess peripheral auditory function is with the measurement of otoacoustic
emissions (OAEs). OAEs can provide a physiological measure of cochlear tuning
encoded. No current research has explored if there is a relationship between cochlear
tuning (measured by OAEs) and the use of auditory feedback in real-time.
Electroencephalography (EEG) techniques can show that complex spectral and temporal
aspects of speech are encoded in the central auditory system at the level of the brainstem
with the synchronous firing of neurons (Worden & Marsh, 1968; Greenberg, Marsh,
Brown, & Smith, 1987). Neurophysiological approaches to speech production and
perception may allow a more comprehensive understanding of how both the cochlea and
brainstem neurons process complex acoustic stimuli such as auditory feedback and how
this affects speech.
This research project investigated the peripheral and neural encoding of vowels at the
level of the brainstem and how this might influence the use of auditory feedback in
real-time. In the following introduction, a review of Canadian English vowels, auditory
feedback, and speech perception will be presented, followed by a detailed summary of
research on cochlear tuning and auditory evoked potentials from the brainstem.
1.1
Introduction to Canadian English Vowels
The Canadian English language has ten different vowels /i, e, ɪ, ε, æ, ɑ, ʌ, ʊ, o, u/
(Hagiwara, 2006). Each vowel has its own unique spectral characteristics, which can be
represented most simply by the frequencies of the first and second formants, F1 and F2
respectively (see Figure 1). Pioneering research demonstrated that only F1 and F2 are
required for accurate vowel recognition although higher formants also contribute
(Peterson & Barney, 1952). Unlike other English dialects, the vowels /a/ and /ɔ/ in
Canadian English overlap substantially, a phenomenon called the Canadian Shift (Clarke,
Elms, & Youssef, 1995). This shift has been documented in both Ontario (Clarke et al.,
1995) and Manitoba (Hagiwara, 2006). Although this shift is well documented, it does
not occur in all regions within Canada, such as the Maritime provinces (Boberg, 2000).
Formant 2 (Hz)
F
or
m
ant
1
(H
z)
Figure 1. Canadian-English vowel space.
Vowels are represented by their first formant on the vertical axis and their second formant on the horizontal axis. This chart was adapted from
1.2
Auditory Feedback
The role of auditory feedback during language learning and speech production is well
established (Callan, Kent, Guenther & Varperian, 2000; Guenther, Ghosh & Tourville,
2006). Dynamic acoustic environments require moment-to-moment adaptations to
maintain accurate and fluent speech. These changes are similar to motor changes in
adaptation studies examining perturbations of the arm and hand. When an individual
grasps an object, the force of their grasp changes with the load force of the object, such
that an increase in load force results in an increase in grasp (Flanagan & Wing, 1993). In
bimanual reaching, compensation to moment-to-moment changes in force applied by a
robotic arm suggested that participants made pre-planned adjustments to the perturbation
and could correct for it rapidly (Jackson & Miall, 2007). This idea of motor adaptation is
relevant to speech production as many of the same principles apply. It is important for the
talker to monitor and adjust ongoing speech to ensure accurate and appropriate
production in changing environments. Speech production relies on two types of feedback:
somatosensory and auditory. Somatosensory feedback guides production based on the
position of the articulators such as the jaw, lips and tongue (Lindblom & Sundberg, 1971)
and works with auditory feedback to control speech production.
Theoretical models of the speech-motor system create a framework from which to
interpret experimental results. A number of models have been proposed, establishing a
relationship between somatosensory and auditory feedback mechanisms and internal
feed-forward models involved in speech production (Perkell et al., 1997; Guenther,
Hampson, & Johnson, 1998; Callan et al., 2000; Guenther, 2006; Guenther et al., 2006).
Perkell and colleagues (1997) theorized that segmental speech production (e.g. vowels
and consonants) involves auditory perceptual goals, which are based on a harmony
between articulation and sound. Due to the latency of auditory processing, they
hypothesized that solely relying on auditory feedback to guide production is unlikely,
thus the system must rely on a sophisticated feed-forward internal model. The internal
model is proposed to arise during development, and maps on to different anatomical areas
in the brain. The model is made up of a series of auditory perceptual goals that act as a set
somatosensory feedback play the role of training and maintaining the internal model.
Once established, the internal model contributes information in a feed-forward manner
alongside the feedback. Guenther and colleagues (1998) postulated that the auditory
perceptual goals that make up this internal model are acquired during development and
create a network of acoustic and somatosensory information within the auditory system.
Although both senses play a role in speech production, our focus is on auditory feedback.
The importance of auditory feedback and its role in speech production was first
investigated over a century ago. It was recognized that when talking in noise, individuals
raise the intensity of their voice (Lombard, 1911), a result that is now called the Lombard
effect. To better characterize these changes in intensity under more controlled conditions,
researchers recorded subjects’ speech while talking in different noise levels ranging from
0 to 100 dB sound pressure level (SPL). In addition to an increase in amplitude, increases
in duration and vocal pitch were noted as well as changes to vowel formant frequencies
compared to speech in a quiet environment (Summers et al., 1988; Siegel & Pick, 1974).
Auditory feedback also plays a role in the temporal accuracy of speech production. This
was first identified with delayed auditory feedback (DAF). Lee (1950) demonstrated that
when speech is played back to an individual with a slight delay during production, the
speaker becomes disfluent. A similar study using DAF revealed that the temporal
information in auditory feedback influences not only the timing of production, but also
other characteristics such as duration and accuracy (Yates, 1963).
Changes to other properties of speech production have been observed when the feedback
received is altered in some way. Young cochlear implant users asked to produce the
vowel /ε/ in “head” had significant changes in formant frequencies when their implants
were off, thus receiving no auditory feedback, compared to when their implant was on
(Tobey & Murchison, 1989). Studies examining speech production in post-lingually
deafened adults reveal changes in voice-onset timing for voiceless stops, more restricted
vowel spaces, increased vowel duration, and longer sentence duration compared to
alterations to auditory feedback result in clear and significant changes in speech
production.
1.2.1
Pitch Shifts
Pitch is an important characteristic of the voice and carries perceptual information such as
emotion and talker identity. Voice pitch is strongly influenced by the fundamental
frequency (ƒ0) of the voice, which, in turn is determined by the mass, tension, and length
of the vocal folds. Studies show that upward shifts to the ƒ0 of speech feedback resulted
in compensation of voice ƒ0 in the downward direction and vice versa (Elman, 1981).
Opposition is the most typical response to a given manipulation (Larson, Burnett, Kiran,
& Hain, 2000; Jones & Munhall, 2000) and suggests the use of internal pitch
representation. In some instances however, individuals will follow the manipulation
suggesting the feedback is used as an external cue (Burnett et al., 1998). Similar results
have been found in cross cultural studies using tonal languages such as Mandarin (Yi Xu,
Larson, Bauer, & Hain, 2004; Jones & Munhall, 2002).
Compensation to pitch-shifts is generally only a fraction of the manipulation introduced.
Burnett et al. (1998) noted that responses to shift magnitude were not proportional,
suggesting that vocal motor control does not rely entirely on auditory feedback. This
result agrees with other similar studies (Larson, 1998; Larson et al., 2000; Chen, Liu, Xu,
& Larson, 2007).
1.2.2
Formant Perturbations
Various other laboratory studies have investigated speech compensation during vowel
formant manipulation. Positive and negative frequency shifts in the F1 of an isolated
English vowel resulted in a compensatory response in F1 production in the opposing
direction (Purcell & Munhall, 2006a). Similar results have been found using normally
voiced words (Purcell & Munhall, 2006b; Villacorta, Perkell & Guenther, 2007) and
whispered speech (Houde & Jordan, 1998). The formant manipulation paradigm is often
organized into four distinct phases: the Baseline phase, the Ramp phase, the Hold phase
and the End phase (see Figure 2). The F1 shift takes place during the Ramp phase once a
/ε/ in “head” was shifted in 4 Hz steps across 50 trials (+200 Hz total) to produce the
vowel /æ/ in “had” while production was recorded (Purcell et al., 2006a). In the Ramp
phase, F1 is gradually filtered and increased or decreased in frequency so the change goes
undetected by the talker. However, compensation to the manipulation appears to be an
unconscious process, occurring automatically (Munhall et al., 2009; Elman, 1981).
A challenge in formant shifting paradigms is to maintain a natural sounding vowel
throughout the manipulation. One way to accomplish this is by shifting both F1 and F2 at
the same time. However, estimates of F2 can be quite variable, which can result in
undesirable feedback during real-time processing. Studies have demonstrated that the
speech motor control system can independently adjust for changes in F1 and F2
(MacDonald, R. Goldberg, & Munhall, 2010; Munhall, MacDonald, Byrne, & Johnsrude,
2009). Further, results showed that changes to F1 did not affect the whole vowel
spectrum, just the energy around the manipulated formant (MacDonald, Purcell, &
Munhall, 2011). Therefore, the independence of formant control does not necessitate
manipulations of both formants together, allowing researchers to manipulate F1 with its
more stable estimates.
Compensation to formant manipulations is not complete and generally is only a fraction
the manipulation. Studies have found that on average, subjects compensate around 25%
to 50% of the manipulation (Houde & Jordan, 1998; Purcell & Munhall, 2006b;
Villacorta, Perkell, & Guenther, 2007; MacDonald et al., 2010; MacDonald et al., 2011).
Studies examining the effects of post-lingual deafness indicate the importance of auditory
feedback for accurate production (Waldstein, 1991). However, the incomplete
compensation observed in this paradigm indicates that other types of feedback are
contributing to the control of speech. Studies such as Tremblay, Shiller, & Ostry (2003)
and Dhanjal, Handunnetthi, Patel, & Wise (2008) outline the role of the somatosensory
system in the control of speech. One explanation for this partial compensation is an
integration of the two signals into a speech-motor control system, which then weighs the
importance of each signal based on the feedback received (MacDonald et al., 2010). At a
-200! -150! -100! -50! 0! 50! 100! 150! 200! 250! C h an ge i n F 1 (H z ) ! Trial Number! /ε/-head! /æ/-had! /i/- hid! 1) Baseline! 2) Ramp! 3) Hold! 4) End! Trial C h an ge in F 1 (H z)
inputs that the system relies more heavily on the somatosensory feedback to guide
production. Based on the altered auditory feedback literature, incomplete compensation is
expected.
The perception of auditory feedback is critical for speech-motor control. Perceptual
organization of the vowel space, vowel categories, and vowel goodness all influence
formant control (Mitsuya et al., 2011). Vowel goodness is defined as the ability of an
exemplar to fit into a specific category (Kuhl, 1991). Goodness ratings are established by
having participants rate a vowel prototype on its apparent “goodness”. Individuals tend to
give high ratings to the prototype and lower ratings to exemplars that move farther away
from the prototype (Iverson & Kuhl, 1996). A robust correlation has been found between
individuals’ vowel goodness ratings and compensation measures (Nguyen, 2012).
Auditory feedback plays an important role in guiding speech production while working
concurrently with learned, internal models of speech. Having established an introductory
understanding of how alterations to auditory feedback manifest at the behavioural level,
the next step is to determine how alterations are represented in the peripheral and central
auditory systems. The following sections will review past research investigating
physiological and psychoacoustic measures of cochlear tuning as well as brainstem
auditory evoked potentials.
1.3
Psychoacoustic and Physiological
measures of cochlear tuning
The peripheral auditory system (i.e. the human ear) is a highly complex sensory organ
that is not completely understood. Sound travels to the cochlea via the tympanic
membrane, setting into motion the ossicles, which in turn set the fluid of the cochlea in
motion. The mechanical sound wave energy in the cochlea is then transformed into
electrical signals via the hair cells. These signals travel to the central auditory system via
the auditory nerve (Seikel, King & Drumright, 2010). The aim of this research project
was to investigate the role of acoustic output from the cochlea (via the hair cells) and
behavioural measures of cochlear function in the use of auditory feedback during speech
The tonotopic organization of the auditory system begins with the basilar membrane
(BM). The frequency selectivity of the BM can be represented as a series of auditory
filters, with the centre of each filter corresponding to a specific frequency location (Sek,
Alcantara, Moore, Kluk, & Whicer, 2005). Cochlear tuning, the frequency selectivity of
the cochlea, can be investigated through the use of psychoacoustic tuning curves (PTC).
One way to measure PTCs is with a sinusoidal signal presented at a low level and a set
frequency. A narrow-band noise masker is added and the level required to just mask the
signal is determined (Small, 1959). PTC results are graphed on a logarithmic scale with
masker/signal level on the vertical axis and frequency on the horizontal axis. In normal
hearing individuals, the low frequency part of the curve is negative sloping followed by a
steep positive slope above the signal frequency (Sek et al., 2005; see Figure 3).
Traditional PTC measures require testing times of approximately 1 hour (Small, 1959),
however, new attempts to reduce this time requirement have been made. Sek et al (2005)
have begun work on a program that aims to measure PTCs in less than 5 minutes. Their
results demonstrated that the PTCs obtained in both normal and hearing-impaired
listeners were highly correlated with PTCs measures using traditional methods. A similar
method has also been developed for testing in children (Malicka, Munro, & Baker, 2009).
A faster PTC measurement would be beneficial in both research and clinical settings.
When the cochlea is stimulated with acoustic input, the outer hair cells (OHCs)
depolarize and hyperpolarize causing them to move. This motility results in the OHCs
acting as an amplifier to the acoustic signal as it travels up the auditory system. The
additional energy can also reverse and travel back out to the ear canal (Kemp; Robinette
& Glattke, 2007; pg. 56). This additional energy from the OHCs results in acoustic
outputs from the cochlea called otoacoustic emissions (OAEs), which are detectable in
the ear canal using a sensitive microphone (Kemp, 1978; Kemp, 1979). A number of
different types of OAEs can be recorded. Click or transient evoked OAEs (TEOAE) and
distortion product OAEs (DPOAEs) are commonly used in a clinical setting as a measure
of cochlear health (i.e. hearing loss). Two other types of OAEs commonly encountered
M
as
ke
r/
S
igna
l l
eve
l (
dB
S
PL
)
Masker/ Signal frequency (Hz)
Figure 3. Example of psychoacoustic tuning curves. Example of PTC data. The vertical axis represents the noise masker and sinusoidal signal level in dB SPL and the vertical axis represents the noise masker and
of OAE is evoked with different stimuli and thus has a unique response pattern (Kemp;
Robinette & Glattke, 2007; pg. 28). TEOAEs are evoked by a brief stimulus and reflect
all the frequency components of the evoking stimulus in a complex sound waveform.
SOAEs are natural pure tones produced by the cochlea at certain frequencies unique to
the individual. DPOAEs are evoked by a pair of pure tone stimuli, which stimulate the
OHCs at the same time and produce a distortion emission at their place of interaction on
the basilar BM. Finally, SFOAEs are evoked by pure tone stimuli and can be used to
estimate cochlear tuning (Kemp; Robinette & Glattke, 2007; pg. 28). Cochlear tuning
plays a role in our ability to distinguish between acoustic stimuli (Shera & Guinan, 2003),
which is important for speech perception. Tuning therefore was selected as an appropriate
measure of peripheral auditory function for the current study.
PTCs and SFOAEs measures can provide behavioural and physiological information
about the frequency selectivity of the cochlea, respectively. Knowledge of cochlear
frequency selectivity may reveal that more narrow auditory filters might better detect
formant changes, which may influence how speech errors are remedied in real-time.
1.4
Auditory Evoked potentials
Currently, an understanding of how acoustic elements of speech are encoded and how
this neural representation may influence the changes observed in speech production is
missing from the literature. To establish a thorough understanding of the neural processes
involved in the human auditory system, the following section will review the
methodology and findings from a number of auditory evoked potential investigations.
Due to the scope of this project, we will only be considering brainstem auditory evoked
potentials. Although the cortex evidently plays an integral role in speech perception, our
focus will remain on the brainstem (which precedes cortical processing) and more
specifically, the frequency following response (FFR) and the envelope following
response (EFR).
The electrical signals produced by the brain can be measured using a technique called
electroencephalography (EEG). During EEG measurements, surface electrodes placed on
in response to brain activity. EEG can be employed to record both cortical and brainstem
electrical activity to specific sensory events in time. Evoked potentials (EPs) are the
summed, time-locked activity from a large number of neurons produced by the
presentation of a sensory stimulus (Kandel, Schwartz & Jessel, 2000) and can provide us
with information (spectral and temporal) with regards to how the brain processes
different sensory stimuli (i.e. somatosensory, visual, and auditory).
When the human auditory system is presented with a sound, the EEG signal undergoes
specific changes that are related to the spectral and temporal properties of that stimulus
(Burkard, Don & Eggermont, 2007). Auditory evoked potential (AEPs) are measured
from the surface of the scalp and reflect neural activity in response to acoustic stimuli.
AEPs can provide information about the function and integrity of the auditory pathway
and can reveal pathology that may not be detectable at the level of the cochlea (Berger &
Blum, 2006; p. 475) or through traditional behavioural methods.
The AEP signal is composed of contributions from different neural generators in the
central auditory system. AEPs can be characterized into near-field and far-field
potentials, depending on the location of the electrode placement. Near-field recordings
are those collected from electrodes placed directly on structures of the auditory nervous
system (e.g. cochlear nucleus), whereas far-field potentials are recorded from electrodes
more removed (i.e. scalp) from their source (Moller et al., 2006; p. 152). Far–field
potentials are less specific, because they receive inputs from a number of different neural
and anatomical sources as well as from muscle activity (e.g. eye blinks and swallowing).
The sensitivity of the EEG to muscle movements makes it necessary to collect a large
number of samples in order to reduce the influence of unwanted artifacts through
averaging. The technique of averaging allows the response, which is time-locked to an
acoustic stimulus, to be emphasized while all the random background noise is reduced.
Input from multiple anatomical generators along the auditory pathway results in the
neural response containing multiple components with different latencies, reflecting the
different origins (Moller, 2006; p. 164). The different components with varied latencies
acoustic stimulus. A number of different AEPs have been identified and characterized
based on their response characteristics.
In 1974, Picton and colleagues identified 15 discrete components of AEPs in humans
using vertex-mastoid electrode placements (Picton, Hillyard, Krausz, & Galambos,
1974). These components were reliably evoked using tone bursts and clicks at 60 dB SPL
in a number of participants. The 15 identified components were divided into early, middle
and late responses depending on their latency, with each representing different locations
along the auditory pathway from the cochlea to the cortex. It was determined that the
early components (occurring within 8 ms of stimulus presentation) represent activity at
the cochlea and the brainstem auditory nuclei (Gerken, Moushegian, Stillman, & Rupert,
1975). The later components are from generators located higher up in the auditory
pathway. Studies revealed that no significant changes in the peak latency of any
brainstem EP component are observed when an individual is asked to attend versus
ignore the stimuli (Picton & Hillyard, 1974). The same study showed that AEP
measurements taken while the participant was sleeping were less noisy. Three common
AEPs encountered in the literature include the auditory brainstem response (ABR), the
FFR and the EFR. Our focus will be on the FFR and EFR because they readily reflect the
frequency characteristics of vowels.
1.5
Frequency Following Response (FFR)
The human FFR was first described in the early 1970s. The FFR represents synchronous
neural activity in upper brainstem structures, with response spectrum peaks
corresponding to the periodicity of the stimulus frequency (Moushegian, Rupert, &
Stillman, 1973). Band-pass filtered recordings from implanted electrodes in a cat brain
demonstrated a persistent electrical response that recreated the sine wave of the auditory
stimulus (Worden & Marsh, 1968). The response and the stimulus spectral profiles were
very similar and suggested that the central auditory system was capable of closely
representing acoustic stimuli.
Experiments using multi-electrode recordings in the cat revealed the FFR was made up of
ventral nucleus of the lateral lemniscus (VNLL), the dorsal nucleus of the lateral
lemniscus (DNLL), and the inferior colliculus with some contribution from the superior
olivary complex (Marsh, Brown, & Smith, 1974; Smith, Marsh, & Brown, 1975). There
is agreement that the synchronous phase-locked activity of upper brainstem nuclei are
involved in the generation of the FFR (Greenberg et al., 1987), however there was some
dispute regarding the degree to which each neural site contributes to the response (see
Gardi, Merzenich, & McKean, 1979). Animal studies revealed that electrode placement
influences the degree to which different structures contribute to the FFR signal (Davis &
Britt, 1984).
Worden et al (1968) ruled out electrical inputs solely from peripheral auditory structures
(e.g. cochlear microphonic) as the source of the FFR due to the long onset latency
(approximately 6 ms) and a reduction in the amplitude of the FFR in the presence of
masking noise (Glaser, Suter, Dasheiff, & Goldberg, 1976). The long onset latency
suggests neural origins within the classical auditory pathway, more specifically, within
nuclei in the upper brainstem region (Batra, Kuwada, & Maher, 1986). The discovery of
the FFR and its role in brainstem level encoding of basic sound stimulus properties in
humans led researchers to investigate how this response might play a role in representing
more complex sounds such as frequency modulated tones, synthetic speech and natural
speech.
Phase-locking in the FFR may play a role in representing speech and processing
information at the level of the brainstem that is critical for perception. Perceptual
elements of speech such as pitch, intonation, prosody and loudness all carry information
that influences the speech signals’ intelligibility. In normal hearing individuals, the FFR
was recorded using spectrally complex tones and responses were found to contain energy
concentrated at the ƒ0, with pitch-relevant information being encoded by phase locked
activity in upper brainstem nuclei (Greenberg et al., 1987). This demonstrates that the
brainstem is robustly encoding important elements of the speech signal such as pitch. In a
more recent study, the FFR waveform showed clear spectral peaks at the two formant
frequencies of three English ‘vowel-like’ sounds (Krishnan, 1999). These results suggest
components of the stimuli, whereby the first and second formant frequency are robustly
represented. Similar results were shown for more complex synthetic English vowel
sounds (Krishnan, 2002), natural English vowels (Aiken & Picton, 2008a), and four
different Mandarin tones (Krishnan, Yisheng Xu, Gandour, & Cariani, 2004). Other
laboratory studies have measured FFRs in response to the ƒ0 of a synthetic speech sound
[da], with more robust FFRs occurring after auditory training (Hayes, Warrier, Nicol,
Zecker, & Kraus, 2003; Russo, Nicol, Zecker, Hayes, & Kraus, 2005; Russo, Nicol,
Musacchia, & Kraus, 2004).
1.6
Envelope Following Response (EFR)
The EFR is an AEP where the neural activity follows the periodicity of the stimulus
envelope (Hall, 1979). The EFR is recorded from surface electrodes placed on the scalp
and can be used to objectively assess the hearing of individuals that cannot participate in
traditional behavioural tests of hearing. The EFR is elicited by complex auditory stimuli
such as a modulated sinusoidal or noise carriers and speech (Levi et al., 1995; Levi,
Folsom, & Dobie, 1993). It has been demonstrated that when adult participants are
presented with amplitude modulated tones ranging from 150 to 450 Hz, the neural
response closely follows the amplitude modulated envelope of the stimulus (Kuwada,
Batra, & Maher, 1986). Similar results have been found when presenting young infants
with 80 Hz amplitude modulated tones (Levi et al., 1995).
Prosodic features of sound such as rhythm and intonation carry a lot of communicative
information in the envelope of speech. The ability to follow and perceive changes in the
speech envelope is important for accurate speech perception. In studies such as Purcell,
John, Schneider, & Picton (2004), behavioural measures of temporal acuity (e.g. gap and
modulation detection tasks) were closely related to the frequency at which the EFR was
no longer detected. A similar study by Dajani, Purcell, Wong, Kunov, & Picton (2005)
noted that the human EFR accurately tracks the pitch contour of a natural vowel, and
reflects small changes in the periodicity of speech which can be detected behaviourally.
In another study, EFRs were found to follow the speech envelope of three different
Similarly, significant EFR peaks were detected at the fundamental frequency of two
different vowels (/a/ and /i/) in all normal hearing participants included (Aiken & Picton,
2008a). Most recently Choi et al. (2013) recorded EFRs to five English vowels present in
three different sentences or as a steady-state string of vowels. Both the steady-state
vowels and the vowels embedded within sentences elicited significant responses.
1.7
Rationale
The objective of the proposed research study is to better understand how the human
auditory system encodes the information in auditory feedback at the peripheral and
central levels and how this information influences production. More specifically, this
project sought to investigate how the auditory brainstem encodes changes in vowel
formants during speech production. From this information, it may be possible to
determine if individual differences in peripheral and neural encoding are related to the
varied use of auditory feedback across different individuals. No study has investigated if
SFOAE measures and AEP measures (EFRs and FFRs) influence the use of auditory
feedback in real-time. In order to investigate this relationship further, measures of central
and peripheral function were paired with a real-time auditory feedback perturbation task.
1.8
Hypothes
e
s
For the present study, it is hypothesized that 1) individuals who produce a greater
compensation response (i.e. reduction in vowel F1 frequency) to real-time perturbations
in vowel F1 feedback, will have greater amplitude AEPs (EFR and FFR), 2) individuals
who produce a greater compensation response to real time perturbations in vowel F1
feedback will have a greater difference between AEP response amplitude (excluding
phase) to two different vowels (in the present case /ε/ and /æ/) and 3) that individuals who
produce a greater compensation response to real time perturbations in vowel F1 feedback
will have a greater vector difference between AEP response magnitude (including phase)
to two different vowels (in the present case /ε/ and /æ/). The predictions were generated
under the assumption that those who have higher amplitude responses and who show
more of a change from “head” to “had” are receiving better auditory information and
the formant manipulation. Further, it is hypothesized that 4) individuals who produce a
greater compensation response to real-time perturbations in vowel F1 feedback will have
narrower auditory filters when measured both physiologically (i.e. using SFOAEs) and
behaviourally (i.e. using PTCs) than those who compensate to a lesser degree. More
narrow auditory filters may allow improved detection of frequency changes in the vowel
Chapter 2
2
Methods
2.1
Participants
Thirty-nine participants were recruited from the Western University community and the
city of London. All participants were English talkers (25 females, 15 males; ages 17-29
yr, mean: 22, SD: 3.35). Participants had learned English as their first language in
Canada, predominantly in Ontario. Hearing thresholds were measured for each ear at
octave intervals between 250 Hz and 4 kHz. Individuals were included if their thresholds
were in the normal range (≤ 20 dB HL). There was one participant with a slightly
elevated threshold at 2000 Hz in one ear. This was not expected to influence the results
using supra threshold speech so the participant was retained. Each participant attended
two testing sessions. No participants had known neurological, language, hearing, or speech impairments as determined by questionnaires.
2.2
Summary of Procedures
The following paragraph provides a brief summary of all the experimental procedures
carried out for this research project. Detailed descriptions of each procedure follow in
subsequent sections (see Figure 4 for a brief overview). This study was completed over
two separate testing sessions lasting for approximately 1 hour and 1.5 hours, respectively.
The experiment was first explained to the participant and she/he was asked for informed
consent and to complete some short questionnaires concerning demographic information,
language experience, and music history. Audiometric thresholds were then determined to
ensure that the participant’s hearing fell within normal limits. An altered auditory
feedback task was then performed with the participant seated comfortably in an Eckoustic
C-26 sound booth. After completion of the altered feedback task, participants completed
two perceptual tasks in a quiet laboratory environment to determine vowel goodness
ratings and F1 discrimination thresholds. In the second testing session, middle ear
function was evaluated using a tympanometer, to ensure typical middle ear function.
measure of cochlear tuning (Sek, et al., 2005). Once the behavioural measure was
complete, a physiological estimate of tuning was obtained with SFOAEs. Participants
were then fitted with surface electrodes on the scalp, and brainstem FFRs and EFRs were
recorded. Once all tasks were complete, participants were provided with a summary of
the experiment and compensation for their time and effort. The Western University
Health Sciences Research Ethics Board approved all questionnaires and experimental
procedures (see Appendix A).
2.3
Perceptual Measures
2.3.1
Vowel goodness
Vowel goodness is a perceptual measure of vowel quality that is highly correlated with
speech compensation (Nguyen, 2012). The term goodness is defined as the ability of an
exemplar of a specific sound to fit into its respective category (Kuhl, 1991). This measure
allows for identification of individuals who do not perceive vowel goodness in a typical
fashion. To determine the goodness of different exemplars of the vowel /ε/, 11 different
versions were created on an F1 continuum from “head” to “had” using filtering similar to
during online formant shifting (see 2.4.4). The F1 of the unaltered “head” was shifted
upwards in 20 Hz steps to +200 Hz (i.e. +20, +40, +60, +80 ... +200 Hz) towards /æ/. The
11 utterances were randomly ordered and presented nine different times for a total of 99
trials. The first four repetitions of the set of sounds were not used in order to allow the
participant to know the full range of /ε/-like sounds. Each participant was asked to rate
the versions of “head” on a scale of 1 to 7, where 1 is a very poor version of the word
“head” and 7 is an excellent version. These vowel goodness ratings were taken to
• Audiometric thresholds • Tympanometry
I. Screening
• English Vowel Space • F1 Manipulation
II. Altered Auditory Feedback
• Vowel Goodness
• F1 Discrimination Threshold • Psychoacoustic Tuning Curves III. Perceptual Tasks
• Stimulus Frequency Otoacoustic Emissions IV. Physiological Tuning Estimate
• Envelope Following Response • Frequency Following Response V. Auditory Evoked Potentials
2.3.2
F1 discrimination threshold
F1 Discrimination threshold is the smallest change in F1 that the listener can detect
perceptually. A two-alternative forced choice procedure (2AFC) was used to determine
the F1 discrimination threshold for /ε/ in “head”, with shifts of F1 in the positive
direction towards /æ/ in “had”. A continuum of “head” was produced by shifting F1
upwards in 5 Hz steps using a method similar to that done in the goodness task and online
(see 2.3.1 and 2.4.4). An adult male whose first language was English produced the
unaltered version of “head”. Dinosaur, an AXB 2AFC program developed by Dorothy
Bishop (Oxford University), was used to complete this measure. During the program,
participants were asked to make a judgment about which sound, the first or the last, was
most like the unaltered, middle presentation of “head”. As the Dinosaur program
continued, the F1 difference between the two sounds became smaller and more difficult
to detect. When the participant made two correct selections consecutively, the task was
made harder, by having the participant hear a smaller shift, and when the participant
made an incorrect selection, the task was made easier by having the participant hear a
larger shift: this was considered one reversal. After eight reversals, the program ended
and the participant’s F1 discrimination threshold was found by averaging the shift
magnitude for the final four reversals.
2.3.3
Psychoacoustic tuning curves
Psychoacoustic tuning curves (PTCs) can be used to measure the frequency selectivity of
the auditory system. This measurement was performed using a fast PTC measurement
program (SWPTC) developed by Aleksander Sek at Mickiewicz University (see Sek, et
al., 2005 for more information).
The SWPTC program (Sek, et al., 2005) was run on a laptop computer while participants
were seated comfortably in a sound booth. The stimuli were presented over Sennheiser
HD 280 pro over-the-ear headphones to the left and then right ear. Trials were
approximately 3 minutes in duration.
Following methods used by Sek and colleagues (2005), participants were instructed to
right ear. The signal beep was 200 ms in duration, with a 200 ms gap between each beep.
The task was initiated by the participant and began with repetitions of the pure-tone beep
in isolation presented at 40 dB SPL. Following this introduction to the pure-tone beeps, a
noise masker was added with a centre frequency of 500 Hz at 40 dB SPL and was swept
upwards to 1500 Hz. Participants were instructed to hold down a button until they could
no longer hear the pure-tone beep. Holding down the button increased the level of the
noise at a rate of 2 dB per second. To avoid any discomfort the maximum output level of
the masker was 80 dB SPL. Once the beep was inaudible, participants were instructed to
let go of the button: this was considered one reversal. The frequency of the masker
changed only after the first four reversals. As soon as the beep was heard again,
participants once again pressed the button. Regression lines were fit to each side of the
PTC and the width of the PTC was measured 10 dB above where the lines intersected
(Malicka, Munro, & Baker, 2009). Q10dB was calculated to measure the sharpness of the
PTC and therefore cochlear tuning.
2.4
Altered auditory feedback
2.4.1
Equipment
Participants were prompted on a computer screen to speak the target word at a rate of
approximately one word every two seconds. Participants wore a Shure WH20 headset
microphone. The microphone signal was amplified using a microphone amplifier
(Tucker-Davis Technologies MA3) with a +20 dB gain switch active and adjustable gain
set individually as described below. The signal was low pass filtered with a cut-off
frequency of 4500 Hz (Frequency Devices type 901). The analogue signal was then
digitized at a 10 kHz sampling rate with 18-bit precision (Natural Instruments
PXI-6289M input/output board). During altered auditory feedback, the signal was analyzed
and filtered in real time to create the formants shifts (National Instruments PXI-8106).
The digital signal was converted back to analogue sound at 10 kHz with 16-bit precision
by the National Instruments PXI-6289M and routed to a Madsen Itera audiometer for
amplification. During practice trials, the microphone MA3 amplifier gain was adjusted
between 20 and 40 dB gain for each participant. The setting chosen for each talker
VU meter. This VU meter reading corresponded to 80 dBA SPL at the listeners’ ears
using Sennheiser “HD 265 linear” headphones. The Madsen Itera audiometer also added
background speech shaped noise of 50 dBA SPL to hide small imperfections that may
have occurred during filtering. All equipment reported was similar to Purcell and
Munhall (2006b).
2.4.2
Formant Estimation
Estimating formants in speech signals is commonly approached through LPC, linear
predictive coding (O’Shaugessy, 1988). Linear filter coefficients are determined by the
LPC method, which can predict the current speech sample from a weighted combination
of previous samples. When the coefficients’ filtering characteristic is represented in the
frequency domain as a spectrum, it resembles a spectral envelope fitted over the actual
speech harmonics. Formant estimates are given by the peaks in this LPC envelope, where
the number of formants is set by the model order. An optimization procedure was carried
out to determine the best model order (BMO) for producing stable formant estimates
before the altered auditory feedback was completed. Tokens of /ε/ in “head”, recorded
with the English vowel space, were used to calculate formant estimates using various
models from 8 to 12. The model order that produced the least variable F1 and F2
estimates was considered the best.
2.4.3
Procedure and experimental conditions
After participants arrived, informed consent was obtained and three short questionnaires
were completed (medical background, language background and music history; see
Appendix B). Screening questionnaires were completed to ensure that participants were
in good health, had normal hearing and were native English speakers. Participants were
asked about their music history because of the potential influence musical training could
have on the results. Participants’ hearing thresholds were then tested using a pure-tone
audiogram. Normal thresholds were ≤ 20 dB HL at octave intervals between 250 Hz and
4 kHz using TDH-296 headphones and a Madsen Itera Audiometer.
Participants were seated comfortably in a chair in the sound booth. The task was
consonant-vowel-consonant (CVC) words used in the study. Individuals were asked to speak normally and
to keep the loudness and pitch of their voice relatively consistent as they uttered each of
the prompted words on the monitor. Microphone amplification adjustments took place at
this time and then participants were prompted with the following words: head, had, heed,
hid, hayed, hawed, and who’d to collect their English vowel space. Talkers then went
through five phases of an F1 positive shift for the English vowel /ε/, where they repeated
the word “head” 220 times. The five phases were Acclimatization, Baseline, Ramp, Hold
and End. In the Acclimatization phase (first 40 utterances) and the Baseline phase
(utterances 41 to 60) individuals received normal, unaltered feedback. In the Ramp phase,
(utterances 61 to 140) auditory feedback was shifted upwards by 20 Hz every 10
utterances to a maximum shift of +200 Hz. In the Hold phase (utterances 141 to 160)
participants received the maximum +200 Hz F1 shift. Finally, in the End phase
(utterances 161 to 220), the manipulation was removed and participants received
unaltered feedback.
2.4.4
Online voice detection and formant shifting
Auditory feedback was altered in real-time by filtering the utterance during the voiced
part of speech. A statistical amplitude threshold technique was used to detect the onset of
voicing in each trial. This was accomplished by determining the mean and standard
deviation of the microphone input level during a quiet period prior to the prompt. When
the microphone input level exceeded this mean input level by six standard deviations,
voice onset was assumed to have occurred. From this point onwards, the voice was
filtered using coefficients determined from real-time LPC formant estimates, which were
updated every 900 μs. The formant manipulations were achieved through two filters that
simultaneously processed the speech signal. One filter deemphasized harmonics near the
current F1 and the second emphasized harmonics near the desired F1, thereby shifting the
2.4.5
Offline formant analysis
Prior to analysis, all trials containing overt pronunciation errors were removed from the
data set. Subsequently, each vowel was cropped from its utterance by a semi-automated
program. The experimenter then verified vowel boundaries.
Offline estimates were calculated for the first three formants (F1, F2 and F3) for each
utterance. A single steady-state value for each formant was calculated by averaging the
estimates from the middle 60% of the vowel for that formant. The analysis only includes
the middle 60% of the vowel because the first and last 20% of the vowel have formants
that may be in transition or estimates that are unstable. A graph of all the F1, F2 and F3
values for each participant was inspected for any incorrect categorization of formants (i.e.
F1 being characterized as F2, etc.) by the offline LPC algorithm. If categorization errors
were present, the experimenter corrected them. Formant values were graphed in the order
that they were produced during the experiment.
2.5
Otoacoustic Emissions
2.5.1
Stimulus generation and recording
Pure tone stimuli used to elicit the SFOAE ranged in frequency from 960 Hz to 1920 Hz
with a resolution of 48 Hz and were digitally generated using Matlab (Mathworks Inc,
MA, USA). This frequency range was selected under the assumption that filter
bandwidths will be similar near the F1 of the vowel /ε/ (approximately 530 Hz and 610
Hz in men and women, respectively; Baken, 1987) to filter bandwidths near 1 kHz. Practically, it is challenging to measure SFOAE below about 750 Hz due to background
noise. A custom LabView program (National Instruments, TX, USA) was used to record
responses. The total measurement duration was approximately 15 minutes.
The digital stimulus was converted to analog signals in the digital-to-analog (and
analog-to-digital) converter at a sampling rate of 32000 Hz (National Instruments, TX, USA,
type 6289M series acquisition card). The levels of all output signals were controlled
using PA5 attenuators (TDT Tucker-Davis Technologies, FL, USA). Following
Etymotic ER2 transducers connected to an ER-10B+ otoacoustic emission probe that
delivered the signals in the ear-canal. The system was calibrated using a Bruel and Kjær
sound level meter and ear simulator. An online in-the-canal calibration was also
performed at the beginning of every frequency to adjust the level of the stimulus to
produce the desired SPL at the probe tip regardless of the size and acoustic impedance of
the individual ear canal. The minimum acceptable signal to noise ratio (SNR) to consider
a response an OAE was set at 12 dB. In the SFOAE recording, it is common to see poor
SNRs at some frequencies due to the interaction of the forward and reverse traveling
waves called microstructure (Goodman et al., 2003). Participants whose responses did not
meet the SNR criteria (except for microstructure) were not included for further analysis in
SFOAE.
Participants sat in a comfortable chair in a sound attenuated booth and were encouraged
to relax and try their best to swallow as little as possible and sleep if possible. SFOAEs
were recorded from only the left ear. To extract SFOAEs, the “suppression method”
(Brass and Kemp, 1993; Kalluri & Shera, 2007) was used. In this method the stimulus
tone was presented at 40 dB SPL continuously. When the stimulus tone is presented in
isolation, the recording contains the stimulus and OAE. Periodically, a suppressor tone of
60 dB SPL and frequency +16 Hz relative to the stimulus is introduced to eliminate the
OAE. This results in just the stimulus tone being recorded. A vector subtraction between
the two conditions is then done to eliminate the stimulus tone and obtain an estimate of the SFOAE. Tuning is determined from the SFOAE measure through SFOAE group delay. Group delay is determined by calculating the slope of the SFOAE phase across frequency. From group delay, we can calculate the equivalent rectangular bandwidth (ERB), a simplified estimate of the filter bandwidth, which can be used to estimate QERB (QERB = 1 kHz/ERB).
2.6
Evoked Potentials
2.6.1
Stimuli
The stimuli for the EEG recording were developed from two separate sources. A standard
male talker with most of his schooling in Western Canada and Ontario. A version of the
vowel /æ/ in “had” was created by shifting the F1 of this standard “head” upwards by 200
Hz. In addition to the standard talker, a token of the subject’s own version of the English
vowel /ε/ was selected from the 20 baseline trials in the formant manipulation paradigm
mentioned above. Each baseline utterance of the word “head” was analyzed to determine
its duration. Of the five longest vowel productions, the ƒ0, and quality were determined
using Praat (Boersma & Weenink, University of Amsterdam). The quality of tokens was
assessed based on the overall perceptual quality of the vowel, the stability of the pitch,
the duration, and the absence of any glottal fry (i.e. creaky voice). Based on these criteria,
the best exemplar was selected and it was filtered using MATLAB (Math Works, Natick
MA) to produce an exemplar of the English vowel /æ/ in “had”. Again, this was
accomplished by shifting the first formant of the vowel /ε/ upwards by 200 Hz. These
tokens were then combined into a single stimulus consisting of the standard talker’s
versions of the words “head” and “had” and the subject’s versions of the words “head”
and “had”. The stimulus was presented in its original polarity, then inverted and
presented in the opposite polarity. Together these were considered one full stimulus
sweep. The duration of each polarity presentation varied between subjects because each
participant’s vowels were different durations. Vowel duration ranged from 0.13 s to 0.25
s. The utterances were presented repeatedly at an overall level of 80 dB SPL for 500
sweeps or a total duration of approximately 55 minutes.
2.6.2
Polarity asymmetry in the EFR
Early in analysis, it was noted that responses elicited by the speech stimuli in polarity A
differed in amplitude from the responses elicited by the speech stimuli in polarity B (a
stimulus flip of 180˚ relative to polarity A). The typical procedure for EFR analysis is to
average the two individual polarities, however this could result in a significant reduction
in the overall response because sometimes the response to one polarity was very small.
This phenomenon was not observed in every individual and was not consistent across a
specific polarity. This interesting observation was independently verified using different
University). Moving forward, responses from polarity A were treated separately from
responses to polarity B.
2.6.3
Stimulus presentation and response recording
Participants were fitted with three disposable MEDI-TRACE Ag/AgCl electrodes placed
at the vertex, just below the hairline at the posterior midline of the neck, and on the
collarbone (as a ground). Electrode impedances were measured using an F-EZM5
GRASS impedance meter to ensure impedances were <5000 Ohm with inter-electrode
differences <2000 Ohm. The stimulus was presented to the left ear of each subject using
an Etymotic ER2 earphone, sealed in the ear-canal with a disposable foam insert. The
experiment was controlled by software developed using LabVIEW (Version 8.5, National
Instruments, Austin TX). Digital-to-analog conversion of the stimuli and analog-to-digital
capture of the EEG were performed by a National Instruments PCI-6289 M-series
acquisition card. Stimuli were output at 32000 S/s with 16-bit resolution and responses
were recorded at 8000 S/s with 18-bit resolution. A Tucker-Davis Technologies PA5
attenuator and SA1 power amplifier controlled stimulus levels at 80 dB SPL through the
Etymotic ER2 earphone acoustic transducer.
Participants were seated comfortably in a reclined chair in a sound insulated and
electromagnetically shielded sound attenuated booth. A rolled towel was placed under
their neck to help support their head and a blanket was provided for comfort. The booth
lights were turned off and the participants were encouraged to sleep for the 55-minute
duration of the measurement.
The stimulus transducer leads and the recording leads were positioned as far apart as
possible to reduce the possibility of stimulus artifacts during the recording. An artifact
check was also performed. The system was set up as usual with an individual fitted with
electrodes; however, the acoustic tube from the ER2 was sealed in a Zwislocki coupler
while the EEG was measured from the individual. In this set up, the transducer
experiences a typical acoustic load however no true response is present, as the stimulus is
not delivered to the ear. The recording showed typical EEG and myogenic noise without
2.6.4
Offline response analysis
While the measurement was running, the EEG time waveform and spectrum were
displayed; however analysis was completed offline using noise rejection and a Fourier
analyzer developed in MATLAB (Math Works, Natick MA). Noise metrics for each
subject’s EEG data were calculated from a frequency band of 80 to 120 Hz. Certain 1.024
s data blocks whose noise metric exceeded the mean noise metric plus two standard
deviations were rejected (see Choi et al., 2013). Remaining data were analyzed
independently for Polarity A and Polarity B. To isolate the brain’s response to vowels,
the time segments of the average EEG that corresponded with vowel boundaries were
selected. This was performed manually, such that the central part of each vowel was
selected to exclude the brief ramp-in and ramp-out sections at the beginning and end of
each vowel segment.
2.6.5
Envelope and frequency following response estimation
The EFR to each vowel condition (i.e. standard head, standard had, subject head and
subject had) was estimated from the averaged EEG for each polarity (A and B) using a
Fourier analyzer (Choi et al., 2013). Using the instantaneous frequencies in the stimulus f0
track, reference cosine and sine sinusoids were created. The average EEG data were
corrected back 10 ms to account for brainstem processing delays for the EFR (Aiken &
Picton, 2006; Purcell et al., 2004). The data were then multiplied with the reference
sinusoids to obtain real and imaginary components of the EFR. An identical procedure
was used for the FFR, except the f0 track was multiplied by a positive integer to mimic
the frequency track followed by the harmonic closest to F1.
2.6.6
Response detection
EEG amplitudes in ten frequency tracks adjacent to the f0 track for both vowels were
estimated (five above f0 and five below). The distance in Hz between each track was
determined by the reciprocal of vowel duration (i.e. the duration submitted to analysis),
which is the bandwidth of the Fourier analyzer. These ten frequency tracks were averaged
to obtain an estimate of the noise at frequencies neighbouring f0. An F-ratio (John &
was likely to be from the distribution of the observed noise. This statistical approach
determines if a significant EFR was present at p<0.05. As above, the same method was