Interpolation algorithm with Edge
Enhancement for Image and Video
Processing – A Comparative Study
Syed Fasiuddin1
Research Assistant, Black Buck Engineers Pvt Ltd, Hyderabad, India 1
ABSTRACT: Image enhancement is an important processing task in image processing field. By applying image
enhancement blur or any type of noise in an image can be minimized, so that the resultant image quality is better. Image enhancement can be obtained by different interpolation and edge detection techniques.The points at which image brightness changes sharply are typically organized into a set of curved line segments termed edges. These edges are detected using various edge detection techniques like sobel, canny, prewitt and Roberts edge detection methods. Interpolation is applied on edge detected Image interpolation is process of finding unknown pixel values from known pixel values. Here we are using bilinear, bicubic and cubic-spline interpolation techniques for image and video processing. Here we are comparing these edge detection and interpolation techniques to determine which technique is suitable for different applications. This is done by comparing parameters like MSE, PSNR and 2-D correlation.
KEYWORDS: Image enhancement, sobel, canny, prewitt, Roberts, Interpolation, Bilinear, Bicubic, Cubic Spline,
MSE, PSNR, 2D CORRELATION
I.INTRODUCTION
Digital image processing is an ever expanding and dynamic area with applications reaching out into our everyday life such as medicine, space exploration, surveillance, authentication, automated industry inspection and many more areas. Edge detection is a basic operation in image processing, it refers to the process identifying and locating sharp discontinuities in an image, the discontinuities are abrupt changes in pixel intensity which characterize boundaries of objects in a scene. It can be shown that under rather general assumptions for an image formation model, discontinuities in image brightness are likely to correspond to discontinuities in depth, discontinuities in surface orientation, changes in material properties and variations in scene illumination. It is a very important first step in many algorithms used for segmentation, tracking and object recognition. Edge detection is a process of locating an edge of an image. Edges consist of meaningful features and contained significant information. It’s reduce significantly the amount of the image size and filters out information that may be regarded as less relevant, preserving the important structural properties of an image (Yuval, 1996). Applying an edge detector to an image may significantly reduce the amount of data to be processed and may therefore filter out information that may be regarded as less relevant, The image quality reflects significant information in the output edge and the size of the image is reduced. The problems of storage, transmission over the Internet and bandwidth could be solved when edges are detected (Vincent, 2007). Since edges often occur at image locations representing object boundaries, edge detection is extensively used in image segmentation when images are divided into areas corresponding to different objects.
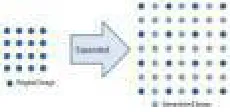
Image enhancement is an important processing task in image processing field. By applying image enhancement, blur or any type of noise in the image can be removed so that the resultant image quality is better. Image enhancement is used in various fields like medical diagnosis, remote sensing, agriculture, geology, oceanography.The polynomial- based methods are nearest neighbour interpolation, bicubic interpolation, and bilinear interpolation. One of the simplest methods is nearest neighbour interpolation, where each interpolated output pixel is assigned to the value of nearest sample point in the input image. . So it is unable to use in high quality imaging applications. The advantage this method are easy to implement and computationally fast, but it does not give good quality of images. . Bilinear interpolation method which uses linear interpolation can be performed in both horizontal and vertical directions. This method is most widely-used because it reduces the blocking and aliasing effects. The interpolated surface is smoother than corresponding surfaces obtained by above mentioned methods bilinear interpolation and basic interpolation method. Hence this is the best among linear methods. The interpolated value in this is the weighted average of 16 closest pixels. The cubic spline interpolation is a piecewise continuous curve, passing through each values.
Fig 1: Interpolation
size to a larger size by finding the average (Mean) of its neighbor pixels. Image processing finds various Analysis of an image is important to know about features of the respective image which is needed for further processing. The analysis requirements are enhancement and edge detection. Therefore different interpolation and different edge detection techniques are came into existence. It is very important to choose appropriate approach for the enhancement of an image needed for specific application. The better approach towards specific applications can be obtained by comparing these methods with respect to various parameters. We use different parameters like MSE, PSNR and 2-D correlation for determining better method for specific application.
The objectives of this paper are listed:
1. To review literature on Image Interpolation and Edge detection techniques.
2. To arrive at design specification of different Interpolation techniques for image and video.
3. Comparison of these techniques with respect to various parameters.
The proposed work is implemented using MATLAB. MATLAB has many built-in functions which provides many tools. Linear computations, data analysis, signal processing, quadrature, numerical solutions and many other types of scientific computations all are supported by the MATLAB tools. The most used algorithm is state-of-art algorithm.
II. DESIGN AND IMPLEMENTATION
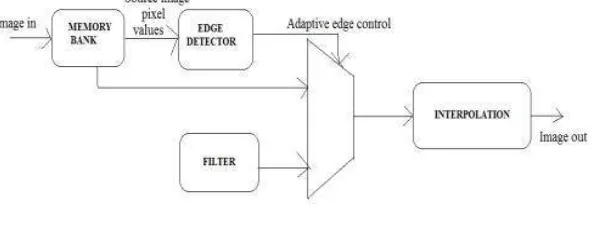
Fig 2: Block diagram
The aim of coordination packet that is generated by a node with message is to inform its path about the frequency channel decided for the message copying.
Fig 2 shows the block diagram of an adaptive edge enhanced scalar architecture. It consists of a sobel filter, edge detector, and bilinear interpolation. Initially, a color image is converted into gray level image using MATLAB. Now gray level image converted into binary image. This binary image is resized and written into a text file. Store the binary image (Text file) into the RAM. Read the Text File from memory Bank. Memory bank provides the input to the sobel filter and edge detector.
EDGE ENHANCEMENT
Edge detection is a basic operation in image processing, it refers to the process identifying and locating sharp discontinuities in an image, the discontinuities are abrupt changes in pixel intensity which characterize boundaries of objects in a scene. It significantly reduces the amount of the image size and filters out information that may be regarded as less relevant, preserving the important structural properties of an image. The purpose of detecting sharp changes in the image brightness is to capture important events. Applying an edge detector to an image may significantly reduce the amount of data to be processed and may therefore filter out information that may be regarded as less relevant, The problems of storage, transmission over the Internet and bandwidth could be solved when edges are detected. Since edges often occur at image locations representing object boundaries, edge detection is extensively used in image segmentation when images are divided into areas corresponding to different objects. Common edge detection algorithms include SOBEL, CANNY, PREWIT, ROBERTS.
SOBEL EDGE DETECTOR
Sobel operator is also used to detect two kinds of edges in an image:
Vertical direction
Horizontal direction
The SOBEL operator performs a 2-D spacial gradient measurement on an image and so emphasizes regions of high spatial frequency that corresponds to edges. Edge areas define strong intensity contrasts which darker or brighter. Gradient magnitude is given by
The angle of orientation of the edge giving rise to spatial gradient is given by,
Angle=tan (Hy/Hx) (2)
The kernel for Sobel is given by:
Vertical mask
This mask works exactly same as the Prewitt operator vertical mask. There is only one difference that is it has “2” and “-2” values in center of first and third column. When applied on an image this mask will highlight the vertical edges.
How it works
When we apply this mask on the image it prominent vertical edges. It simply works like as first order derivate and calculates the difference of pixel intensities in a edge region. As the center column is of zero so it does not include the original values of an image but rather it calculates the difference of right and left pixel values around that edge. Also the center values of both the first and third column is 2 and -2 respectively.
Horizontal
Above mask will find edges in horizontal direction and it is because that zeros column is in horizontal direction. The only difference between it is that it have 2 and -2 as a centre element of first and third row.
How it works
This mask will prominent the horizontal edges in an image. It also works on the principle of above mask and calculates difference among the pixel intensities of a particular edge. As the center row of mask is consist of zeros so it does not include the original values of edge in the image but rather it calculate the difference of above and below pixel intensities of the particular edge. Thus increasing the sudden change of intensities and making the edge more visible.
CANNY EDGE DETECTOR
The Canny edge detection algorithm is known to many as the optimal edge detector.
The canny edge detector first smoothens the image to eliminate and noise. It then finds the image gradient to highlight regions with high spatial derivatives after the edge directions are known, non-maximum suppression now has to be applied.
The magnitude or edge strength of the gradient is then appropriated using the formula:
PREWITT EDGE DETECTOR
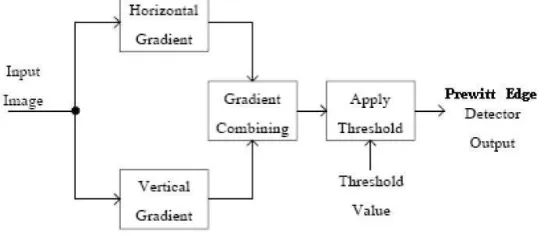
The edge detection algorithms are basically divided into two steps. The first step of edge detection requires the evaluation of derivatives of the image intensity. This operation is as shown in Fig. The
algorithms of first derivative or first difference based operator are the simplest one that is why it is selected for implementation on hardware device. It is defined in magnitude form as the sum of the magnitudes of vertical and horizontal gradient.
Fig 3: Operation of prewitt-edge detection algorithm
The kernel for Prewitt is given by:
The gradient magnitude is given by:
ROBERTS EDGE DETECTOR
BRIEF DESCRIPTION
HOW IT WORKS
In theory, the operator consists of a pair of 2×2 convolution masksas shown in figure. One mask is simply the other rotated by 90°. This is very similar to the Sobel operator. The kernel for Roberts is given by:
These masks are designed to respond maximally to edges running at 45° to the pixel grid, one mask for each of the two perpendicular orientations. The gradient magnitude is given by:
The angle of orientation is given by:
INTERPOLATION
DEFINITION OF INTERPOLATION: Interpolation is a process of constructing the new data points with known data points. It is important to construct the points within the range of data points.
The interpolation algorithms are classified into different types:
Non-adaptive interpolation algorithms. Adaptive interpolation algorithms.
ADAPTIVE INTERPOLATION
Adaptive interpolation method operates based on the structure of the image with different intensity of pixel values.
NON-ADAPTIVE INTERPOLATION
In the non-adaptive interpolation algorithms, irrespective of the contents of the image the computations are done. This kind of algorithm is usually employed in applications like adobe Photoshop cs5.
BILINEAR INTERPOLATION
U(x) = {0 {1-|x|
|x|>1
|x|<1
Where, x is the difference between the interpolated point and the actual point.
Fig4: Bilinear interpolation
Bilinear interpolation is an operation that determines the intensity from the weighted average of the four closest pixels to the specified input coordinates, and then assigns that value to the output co-ordinates. The key point of this idea is to perform linear interpolation first in one direction, and then again in the other direction. Fig depicts a block which includes four input pixels P(i, j), P(i+1, j), P(i, j+1), and P(i+1, j+1), where i=[0…M] and j =[0…N]. The M and N are the width and height of the original image. The temporary pixel P(k, j) is calculated by linear interpolation in x direction with P(i, j) and P(i+1, j), where i≦k≦i+1. Also, the temporary pixel P(k, j+1) can be calculated with P(i, j+1) and P(i+1, j+1).The temporary pixel P(k, j) and P(k, j+1) can be obtained by,
Where, dx is the scale parameter in horizontal direction. After interpolating in horizontal direction, the output pixel P ’(k, l) can be calculated by linear interpolation in y direction with P(k, j) and P(k, j+1) as ,
BICUBIC INTERPOLATION
This method includes the average of sixteen closest pixel’s values to get the interpolated point. The sharpness of the image is very high compared to the
bilinear interpolation method. The clarity of the image is also high in this bicubic interpolation method. This is formulated as:
{3/2|x|3-5/2|x|2+1 0<=|x|<1
U (x) = {-1/2|x|3+5/2|x|2-4|x|+2 1<=|x|<2
{0 2<|x|
Where, x is the difference between the interpolated point and the actual point.
In image processing, bicubic interpolation is often chosen over bilinear interpolation or nearest neighbor in image resampling, when speed is not an issue. In contrast to bilinear interpolation, which only takes 4 pixels (2×2) into account, bicubic interpolation considers 16 pixels (4×4). Images resampled with bicubic interpolation are smoother and have fewer interpolation artifacts.
CUBIC SPLINE
Spline Interpolation
In the mathematical field of numerical analysis, spline interpolation is a form of interpolation where the interpolant is a special type of piecewise polynomial called as spline.
Given a tabulated function fk = f(Xk), k=0,…….,N,
A spline is a polynomial between each pair of tabulated points,but one whose coefficients are determined slightly,non-locally.The non-locality is designed to guarantee global smoothness in the interpolated function upto some order of derivative. They produce an interpolated function that is continues through to the second derivative. Splines tend to be stabler than fitting a polynomial through the N+1 points, with less possibility of wild oscillations between the tabulated points.
Cubic Spline
boundarycondition that completes the system of m-2 equations. This produces a natural cubic spline and leads to simple tridiagonal system which can be solved easily to give the coefficients of the polynomials.
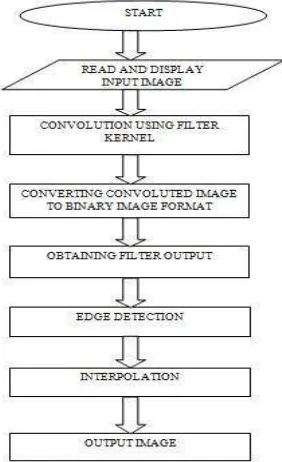
FLOW CHART
III. RESULTS AND CONCLUSION
Results of the paper are discussed here. It shows the comparison of different interpolation techniques with different edge detection techniques. From the results, we get to know which is better approach for an application. In this paper different images are considered for analysis.
Fig 5 : Input Image
SOBEL EDGE DETECTION
CANNY EDGE DETECTION
PREWITTS EDGE DETECTION
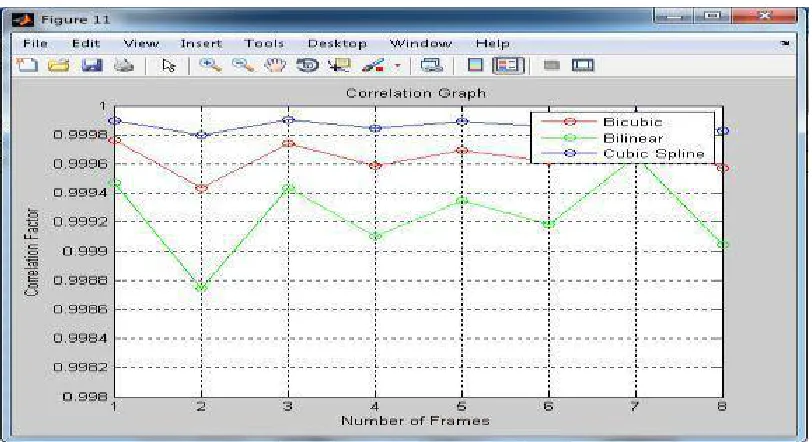
Fig 7: 2D- CORRELATION Graph
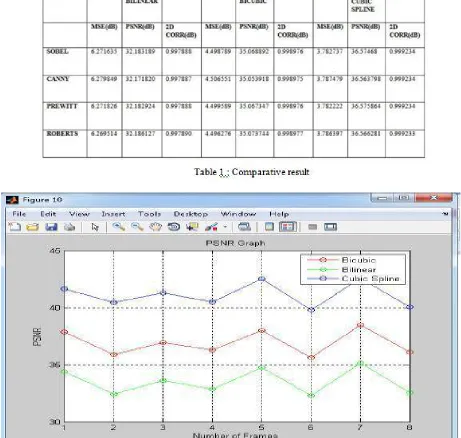
Here, different edge enhancement and interpolation techniques are used in order to increase the quality of an image. It is important to determine better approach for different applications. In this paper we have used different parameters like MSE, PSNR, 2-D CORRELATION to differentiate and to determine the better technique for image and video processing. Graphical representation for video and tabular representation for image makes the analysis easy. From the tabular representation we have found that cubic spline is more efficient compared to other two interpolation techniques
REFERENCES
1.Parth Bhatt, Ankit Shah, Sanjay Patel and Sachin Patel, “Image Enhancement Using Various Interpolation Methods”, International Journal of Computer Science and Information Technology & Security, Vol. 2, No.4, August 2012.
2.Shih-Lun Chen, ”VLSI Implementation of an Adaptive Edge Enhanced Image Scalar for Real Time Multimedia Applications”, IEEE Transactions on Circuits and systems for video Technology”, Vol 23,No 9,September 2013.
3.Vaishali Patel and Kinjal Mistree,” A Review on Different Image Interpolation Techniques for Image Enhancement”, International Journal of Emerging Technology and Advanced Engineering, Vol 3, Issue 12, December 2013
4.John Moses C, D Selvathi,” VLSI Architecture of an Area Efficient Image Interpolation”, International Journal of Engineering and Technology, Vol 6, No 2, April-May 2014.
5.B. Reddy, and B. Chatterji, “An FFT-based Technique for Translation, Rotation and Scale Invariant Image Registration”, IEEE Trans. On Image Processing, Vol. 5, No. 8, pp: 1266-71, 1996.
6.Q.Chen ,M. Defrise, and F. Deconinck, “Symmetric phase-only matched filtering of Mellin transforms for Image Registration and Recognition,” IEEE Transactions on Pattern Analysis and Machine Intelligence, vol 16 No. 12 pp 1156-1168.
7.R. Szeliski, “Video mosaics for virtual environments”, IEEE Computer Graphics & Automation, pp. 22-30, 1996. 8.R. Szeliski, “Image alignment and stitching: A tutorial”. Technical Report, January 2005.
9.T. R. Kumar, “A point Pattern based Image Registration for Mosaicing with Random Selection”, M.Tech Project report, 2002, Sri Satya Sai Institute Of Higher Learning.