Adaptive Neuro-Fuzzy Inference System Based
Grading of Basmati Rice Grains Using Image
Processing Technique
Dipankar Mandal1*
1 Centre of Studies in Resources Engineering, Indian Institute of Technology Bombay, Mumbai, India;
Abstract:Grading of rice grains has gain attentions due its requirement of quality assessment during import or export. Rice grain quality depends on milling operation, where rice hull is removed with a huller system followed by whitening operation. In such process, adjustment of rollers, control, and operation is important in terms of quality of milled rice. Especially, the basmati rice needed more quality assurance as it is not parboiled rice and exported globally with a high product value. In this present work, the basic problem of quality assessment in rice industry is addressed with digital image processing based technique. Machine vision and digital image processing provide an alternative with the automated, nondestructive, cost-effective, and fast approach as compared with traditional method which is done manually by human inspectors. A model of quality grade testing and identification is built based on morphological features using digital image processing and knowledge based adaptive neuro-fuzzy inference system (ANFIS). The qualities of rice kernels are determined with the help of shape descriptors and geometric features using the sample images of milled rice. The adopted technique has been tested on a sufficient number of training images of basmati rice grain. The proposed method gives a promising result in an evaluation of rice quality with 100% classification accuracy for broken and whole grain. The milling efficiency is also assessed using the ratio between head rice and broken rice percentage and it is 77.27% for the test sample. The overall results of the adopted methodology are promising in terms of classification accuracy and efficiency.
Keywords: ANFIS; basmati rice; image processing; grading; quality assessment; fuzzy inference system.
1. Introduction
India is the leading exporter of the basmati rice (Oryza sativa) to the global market. The annual export of basmati rice was∼4.05 million MT to the world during the year 2015-16 [1]. Basmati rice is a protracted slender grain variety of aromatic rice grown in Indian sub-continent. It has a high product value due to its flavour, delicate texture, delightful fragrance, and softness. The length of basmati rice grain is longer than the width, and it grows even longer during cooking [2].
In the food industry, quality of grains is an important issue regarding product standard as they are frequently subjected to adulteration. The adulteration of the highly priced basmati rice with cheaper varieties e.g. PR-106, Pusa-169, Saket-4, improved Sabarmati, is being practised in the supply chain [2]. So, quality assessment has become an important criterion for standards. Grain grading is a standard procedure in the quality determination which is essential in marketing and quality assurance. The quality of basmati rice depends on physical properties of grain. It can be determined based on some head rice and broken grains after milling of rice. However, the underlying problem of quality assessment in rice industry lies on analysis of rice kernels which is executed manually by human inspectors. Occasionally, the decisions taken by a human inspector may be affected by some external factors.
Moreover, this assessment process is time-consuming and inefficient. During last decade, researchers have investigated different techniques based on machine vision and digital image
processing for quality assessment of rice kernels which are fast, non-destructive, accurate, and cost-effective as compared to traditional methods [3,4]. Major axis/minor axis ratio is a decent descriptor of adulteration of basmati rice with other rice varieties [5], which are usually used for adulteration. Vaingankar and Kulkarni [5] reported the major axis/minor axis ratio of 3.92−4.09 as an indicator of pure Basmati-370 variety. The rice grain colour, morphology and textural features based classification technique for rejecting the broken basmati rice grains was illustrated in [6].
The marketing value of rice as an agricultural product depends on its physical qualities after processing. The percentage of head grain or whole grain is the most important parameter for the rice processing industry. So, the quality and grading depend on different features of the grains (objects) e.g. major axis to minor axis ratio, eccentricity, size, area, etc. Pazokiet al.[7] illustrated that determining grain variety using a simple mathematical function is difficult because the grain has various morphologies, colors, and textures. Artificial neural network (ANNs) techniques have been applied for grain quality control and discrimination of grain variety. Chenet al.[8] proposed a methodology to identify five corn varieties with the accuracy of more than 90% using pattern recognition techniques and neural networks.
Soft computing technique viz. ANN is a nonlinear model that is easy to use and understand compared to statistical methods. ANN with backpropagation learning algorithm is widely used in solving various classifications and forecasting problems. However, ANN is black box learning approach, cannot interpret the relationship between input and output and cannot deal with uncertainties. To overcome these several methods have been combined with ANN such as feature selection, etc. Neuro-fuzzy systems (networks) are one of the most visible sections of a hybrid system that can apply a combination of ANN and fuzzy systems. Furthermore, Fuzzy is quite good in handling uncertainties and can interpret the relationship between input and output by producing rules. Therefore, to increase the capability of Fuzzy and ANN, hybridization of ANN and fuzzy is usually implemented. Sabanciet al.[9] used ANFIS for wheat grain classification with 99.46% of classification accuracy. Zareiforoushet al.[10] coupled a fuzzy inference system (FIS) with image processing technique for a decision-support system for qualitative grading of milled rice. The results are reported with 89.8% agreement between the grading results obtained from the FIS system and those determined by the experts.
However, some head grains are easily misclassified with broken grain due to the resemblance in single feature (e.g. eccentricity) extracted from digital images and are not deterministically separable. In such cases, fuzzy approach [11] is more convenient for discrimination of head and broken rice grains. Shiddiqet al.[12] investigated the rice milling degree using colour features (RGB) with an adaptive network based fuzzy inference model. It was reported an error of 3.55−5.62% in milling degree using this process. However, the morphological features can improve the efficiency in terms of classification. In this present work, a model of quality testing and identification of basmati rice was built which is based on morphological features and shape using image processing and fuzzy inference system (FIS). This has been motivated by the fact that well-documented knowledge regarding rice kernels are usually available [13,14]. This knowledge has been incorporated in forming the rules of the fuzzy inference system used to determine head and broken rice kernels. A new image processing approach has also been assessed before FIS model building for feature extraction. The milling efficiency was also estimated with broken grain and head grain ratio for a test image.
2. Materials and Methods
2.1. Image acquisition
the camera to acquire an image; personal computer or microprocessor system to provide disk storage of images and computational capability.
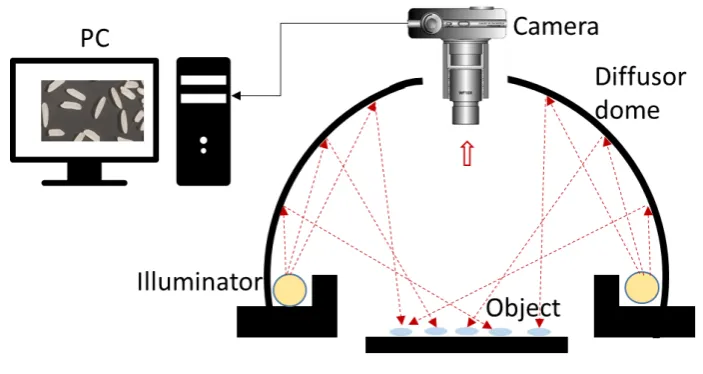
In an image acquisition system, choosing the right lighting strategy remains a difficult problem because there is no specific guideline for integrating lighting and machine vision application. Despite this, some rules of thumb exist [15]. In contrast, fluorescent bulbs are inherently more efficient and produce more intense illumination at specific wavelengths. Moreover, the fluorescent light provides a more even, uniform dispersion of light from the emitting surface [16]. A 25−40 kHz compact fluorescent light is used for illumination in this setup. Apart from the illuminant, the surface geometry is also important in the illumination design. In this present work, a diffuse illuminator is used to produce uniform lighting as shown in Fig. 1. Such a setup is extremely useful for visual inspection of grains and oilseed with a success rate almost reaching 100% [17].
Figure 1.Schematic diagram of image acquisition system equipped with a camera, illumination source and geometry, and connected PC.
The training sample images of Indian basmati rice grains were acquired with a Digital Camera (Canon EOS 1300D). The images were taken with a black background for basmati rice sample with different orientation and quality for training. Images were captured and stored in JPG format.
2.2. Image Processing
The image processing was carried out with MATLAB. At first, the acquired RGB image was separated in single R, G and B channel in grayscale mode. Then, the each channel grey image was converted to a binary image using ‘im2bw’ and ‘graythresh’ thresholding function [18] followed by creating a complementary image. The image segmentation considers the identification of objects within an image using an edge detection algorithm which identifies the boundaries of individual object and labels the centre of each object for further processing.
The similar operation was conducted for other training images of same basmati rice sample and for the test image too. Feature dataset for training as well as testing was created from the object properties and object class (Whole grain=1 or broken grain=0).
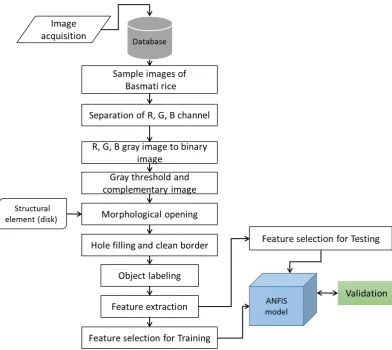
Figure 2.Schematic workflow for image processing
2.3. Features of basmati rice
Rice grains are generally considered as an ellipse. Based on this assumption of the object, the following features as reported by Shantaiya and Ansari [6] are considered for the present study. However, Mousavirad et al. [20] reported optimal morphological features for rice kernel identification using standard sequential forward (SFS) algorithm. These features are:
• Major axis length: It is the total number of pixels between the extreme points along the major axis of the rice kernel.
• Minor axis length: It measures the number of pixels between the extreme points of the along the minor axis of the rice kernel.
• Perimeter: It is the total number of pixels along the boundary of rice grain. • Area: It is the total number of pixels in rice grain object.
• Aspect ratio (a/b): It is the ratio of major axis length and minor axis length of the rice grain. • Eccentricity: The eccentricity is calculated by a fraction of the number of pixels between the
major axis length and foci of the ellipse containing the grain. The value of eccentricity ranges in between 0 to 1.
• Equivalent diameter: Equivalent diameter of rice grains is calculated as,Eqd=p
(4∗Area)/π
2.4. Fuzzy Inference System
A Fuzzy Inference System (FIS) incorporates the knowledge of an expert, during design a model in between input and output parameters. In FIS, the input–output relations are defined by a set of fuzzy rules, e.g. IF–THEN rules [21]. Fuzzy logic-reasoning involves the assignment of membership function to the input and output parameters; and the rule base which processes the fuzzy values of the inputs to fuzzy values of the outputs. The accurate selection of these membership function and the rules is one of the most critical stages in the FIS which needs expert knowledge. FIS consists of three segments viz. fuzzification, inference engine and defuzzifier. Fuzzification converts the numeric value of the input to a linguistic variable with the help of the membership functions e.g. triangular, trapezoidal, Gaussian, etc. The inference engine evaluates the degree of the membership function of the input variables (premise) to the fuzzy consequent part using the fuzzy IF-THEN rules. The conditional statement contains a premise, the if-part, and a conclusion, the then-part [22]. The knowledge involved in a fuzzy inference system contains a group of several rules [23]. At last, the defuzzifier converts the fuzzy output into a crisp value. The fuzzy inference engine is the core of FIS which can represent the human decision-making process [21].
The Takagi-Sugeno (T-S) FIS has fuzzy inputs and a crisp output which is a linear combination of the inputs or constant. This method is computationally efficient and suitable to work with optimization and adaptive techniques [24]. The T-S method involves a systematic approach to generating fuzzy rules from a given input-output data set. It uses a membership function of the input variables for producing the consequent (then part). It uses the fuzzy rule:IF x is A AND y is B THEN z is f(x,y)wherex,y, andzare linguistic variables,AandBare fuzzy sets and f(x,y)is a mathematical function [24]. T-S FIS uses a weighted average to generate the crisp output.
In this present work, zero order T-S was adopted for grading of basmati rice. The membership functions were taken as ‘gbellmf’ [25] for all inputs viz. eccentricity, equivalent diameter, perimeter and the major axis length/minor axis length (a/b); the outputs were taken as constant (for whole grain, output=1 and broken grain output=0). The rules of the T-S method were taken as follows:
• Rule 1: If (eccentricity is high) and (equivalent diameter is high) and (perimeter is high) and (a/bis high) then (output is Whole grain).
• Rule 2:If (eccentricity is low) and (equivalent diameter is low) and (perimeter is low) and (a/b is low) then (output is broken grain).
2.5. Adaptive neuro-fuzzy inference system (ANFIS)
The adaptive neural network based fuzzy inference system (ANFIS) is a hybrid system. It includes both the advantages of the self-adaptability and learning competence of the neural network and the ability of the fuzzy system to take into account of the prevailing uncertainty and imprecision of real systems. The neuro-fuzzy modeling approach is concerned with model extraction from numerical data which represents the dynamic behaviour of the scheme. With ANFIS method, an initial fuzzy model is generated with the help of the rules extracted from the input-output data. Next, the neural network is used to tune the rules of the initial fuzzy model to produce the final ANFIS model. The formulations and discussion of ANFIS architecture can be found in [26,27].
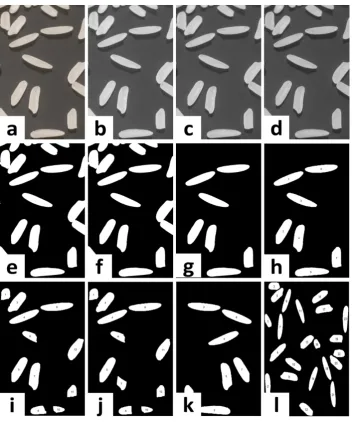
(objects). However, for representation we have kept only 1 image and have shown all image processing steps involved in result section.
Figure 3.Image processing outputs. a. Raw sample image (RGB); b. Red channel image; c. Green channel image; d. Blue channel image; e. Binary image; f. Image after morphological opening; g. Hole filled and border cleared image; h. Labelled objects in training sample1 image; i. Labelled objects in training sample 2 image; j. Labelled objects in training sample 3 image; k. Labelled objects in training sample 4 image; l. Labelled objects in test sample image.
3. Results and discussion
3.1. Image processing outputs
3.2. ANFIS output
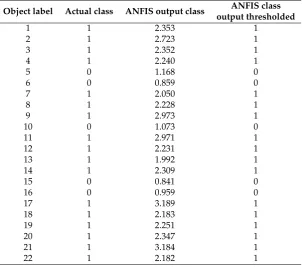
The feature extracted from processed training images were used to build the ANFIS model. Test error was found to be on training data for 20 epochs during ANFIS training (Fig.4). The error was zero for test data after thresholding (threshold at 2) on ANFIS output. The output of the testing data is shown in Table1.
Figure 4. Training and test error for sample images. During training, after 11 epochs the error significantly reduces. In test error plot, the blue dots are actual output, and the red stars are ANFIS output corresponding to each object.
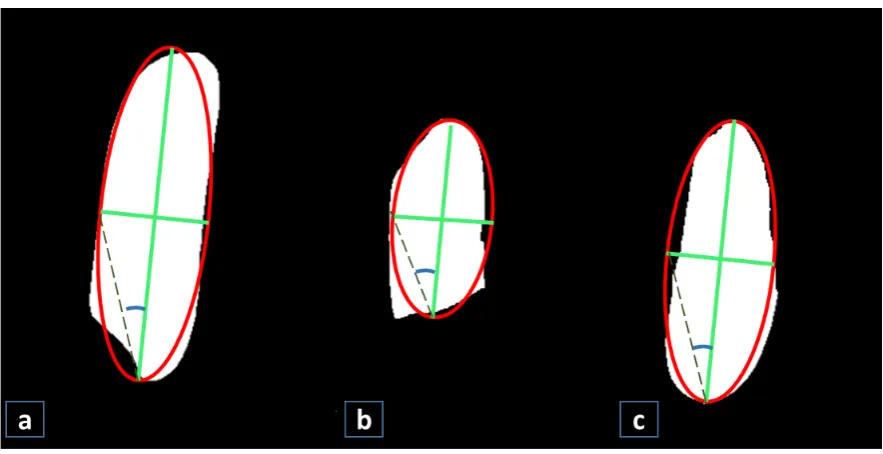
Figure 5.Variations in features in between different grains. a) Whole rice grain; b) Broken rice grain; c) Imperfect rice grain.
From Table1it is observed that for all the objects (rice grains in test image) the ANFIS output threshold class is similar to actual class (i.e. 0 or 1). So, the classification accuracy of ANFIS is 100%, as an actual class and ANFIS output class for the test objects are alike.
Table 1.ANFIS results for test image for each rice object. Threshold is applied with rule: If (ANFIS output class>2) Then (ANFIS output class thresholded=0).
Object label Actual class ANFIS output class ANFIS class output thresholded
1 1 2.353 1
2 1 2.723 1
3 1 2.352 1
4 1 2.240 1
5 0 1.168 0
6 0 0.859 0
7 1 2.050 1
8 1 2.228 1
9 1 2.973 1
10 0 1.073 0
11 1 2.971 1
12 1 2.231 1
13 1 1.992 1
14 1 2.309 1
15 0 0.841 0
16 0 0.959 0
17 1 3.189 1
18 1 2.183 1
19 1 2.251 1
20 1 2.347 1
21 1 3.184 1
22 1 2.182 1
For, an imperfect grain eccentricity will be ‘low’, (a/b) is ‘low’. Perimeter might be ‘medium’. However, in our case membership function is set to ‘High’ and ‘Low’. So, it will be classified as ‘broken grain’. By virtue of these, imperfect grain anyhow is separated from ‘whole grain’, thus it is not affecting ‘milling efficiency’. Fig.5illustrates a similar scenario which is analyzed from a test image. It is clearly
showing a dissimilarity between grain physical parameters for three grain types.
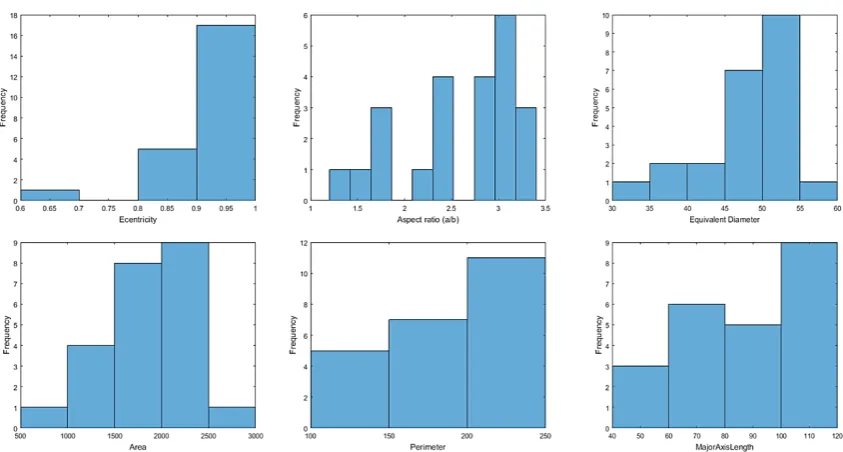
3.3. Histogram of features in testing images
Histograms of feature extracted from the test image objects are shown in Fig.6. All the features are positively skewed representing a positive relation with basmati grain size (head grain). The occurrence of eccentricity>0.9 is found for more than 16 rice objects in the test image. The aspect ratio is>2.4 for more than 17 objects. Similar results are also shown in the case of area, perimeter and major axis length. The histogram images as shown in Fig.6, also exemplify the head grain and broken grain percentage in the test images.
3.4. Milling efficiency
From the test image output results, the number of the whole grains=17 out of 22 objects. Whereas, the broken grain objects are=5 out of 22 objects. So, the percentage of whole grain= (17/22)×100= 77.27%. This milling efficiency was found for a specific roller characteristics (rpm= 2000 and gap between roller∼0.5mmof the milling machine [29]. However, the moisture content of basmati rice grain is also a significant factor during the milling operation.
4. Conclusions
Figure 6.Histogram of eccentricity, aspect ratio, equivalent diameter, area, perimeter and major axis length of test image objects.
was found to be zero with this technique for the test image. The milling efficiency was estimated in terms of percentage of whole grain or head grain and it was 77.27% for the test sample. However, the colour and texture based quality and grading was not considered during feature selection. The overall results of the adopted methodology were promising in terms of classification accuracy and efficiency. This work can be extended to discrimination of different rice varieties in adulteration. An efficient mobile application can be developed using the image processing technique for quality assessment of rice. Moreover, this model can be extended for optimization of milling machine parts characteristics during milling operation (roller parameter-speed, the gap between rollers) for process atomization using microcontroller units.
Acknowledgments:The author would like to thank Rice Processing Unit, Department of Postharvest Engineering, Bidhan Chandra Krishi Viswavidyalaya, India for providing sample images of basmati rice.
Author Contributions:Dipankar Mandal conceived the study, implemented the algorithms, processed the data and subsequently analyzed the results and wrote the manuscript
Conflicts of Interest:The authors declare no conflict of interest.
References
1. All India Rice Exporters Association. Export statistics of Basmati rice. http://www.airea.net/page/58/ statistical-data/export-statistics-of-basmati-rice/, 2015. Accessed: 2018-04-10.
2. Bhattacharjee, P.; Singhal, R.S.; Kulkarni, P.R. Basmati rice: a review. International journal of food science & technology2002,37, 1–12.
3. Fang, C.; Yi-bin, Y. Machine vision inspection of rice seed based on Hough transform.Journal of Zhejiang University-SCIENCE A2004,5, 663–667.
4. Jain, K.R.; Maheshwari, C. Parametric quality analysis of indian Ponia Oryza Sativa SSP Indica (Rice). International Journal for scientific research and development2013,1, 2321–0613.
5. Vaingankar, N.M.; Kulkarni, P.R. A cooking quality parameter as an indicator of adulteration of Basmati rice. Journal of the Science of Food and Agriculture1989,48, 381–384.
7. Pazoki, A.; Farokhi, F.; Pazoki, Z.; others. Classification of rice grain varieties using two Artificial Neural Networks (MLP and Neuro-Fuzzy). The Journal of Animal & Plant Sciences2014,24, 336–343.
8. Chen, X.; Xun, Y.; Li, W.; Zhang, J. Combining discriminant analysis and neural networks for corn variety identification. Computers and electronics in agriculture2010,71, S48–S53.
9. Sabanci, K.; Toktas, A.; Kayabasi, A. Grain classifier with computer vision using adaptive neuro-fuzzy inference system.Journal of the Science of Food and Agriculture2017,97, 3994–4000.
10. Zareiforoush, H.; Minaei, S.; Alizadeh, M.R.; Banakar, A. A hybrid intelligent approach based on computer vision and fuzzy logic for quality measurement of milled rice.Measurement2015,66, 26–34.
11. Mamdani, E.H. Application of fuzzy algorithms for control of simple dynamic plant. Proceedings of the institution of electrical engineers. IET, 1974, Vol. 121, pp. 1585–1588.
12. Shiddiq, D.M.; Nazaruddin, Y.Y.; Muchtadi, F.I.; Raharja, S. Estimation of rice milling degree using image processing and adaptive network based fuzzy inference system (ANFIS). Instrumentation Control and Automation (ICA), 2011 2nd International Conference on. IEEE, 2011, pp. 98–103.
13. Kamath, S.; Stephen, J.; Suresh, S.; Barai, B.; Sahoo, A.; Radhika Reddy, K.; Bhattacharya, K.R. Basmati rice: its characteristics and identification. Journal of the Science of Food and Agriculture2008,88, 1821–1831. 14. Singh, R.K.; Khush, G.S.Aromatic rices; Int. Rice Res. Inst., 2000.
15. Sun, D.W.Computer vision technology for food quality evaluation; Academic Press, 2016.
16. Abdullah, M.; Fathinul-Syahir, A.; Mohd-Azemi, B. Automated inspection system for colour and shape grading of starfruit (Averrhoa carambola L.) using machine vision sensor. Transactions of the Institute of Measurement and Control2005,27, 65–87.
17. Paulsen, M.; others. Using machine vision to inspect oilseeds. INFORM-International News on Fats, Oils and Related Materials1990,1, 50–55.
18. Otsu, N. A threshold selection method from gray-level histograms.IEEE transactions on systems, man, and cybernetics1979,9, 62–66.
19. Soille, P.Morphological image analysis: principles and applications; Springer Science & Business Media, 2013. 20. Mousavirad, S.; Tab, F.A.; Mollazade, K. Design of an expert system for rice kernel identification using optimal morphological features and back propagation Neural Network. International Journal of Applied information systems2012,3, 33–37.
21. Camastra, F.; Ciaramella, A.; Giovannelli, V.; Lener, M.; Rastelli, V.; Staiano, A.; Staiano, G.; Starace, A. A fuzzy decision system for genetically modified plant environmental risk assessment using Mamdani inference.Expert Systems with Applications2015,42, 1710–1716.
22. Cornelissen, A.; van den Berg, J.; Koops, W.; Grossman, M.; Udo, H. Assessment of the contribution of sustainability indicators to sustainable development: a novel approach using fuzzy set theory. Agriculture, ecosystems & environment2001,86, 173–185.
23. Klir, G.; Yuan, B. Fuzzy Sets and Fuzzy LogicPrentice HallUpper Saddle River. New Jersey1995.
24. Takagi, T.; Sugeno, M. Fuzzy identification of systems and its applications to modeling and control. In Readings in Fuzzy Sets for Intelligent Systems; Elsevier, 1993; pp. 387–403.
25. Gulley, N. Fuzzy logic toolbox for use with MATLAB1996.
26. Jang, J.S. ANFIS: adaptive-network-based fuzzy inference system.IEEE transactions on systems, man, and cybernetics1993,23, 665–685.
27. Walia, N.; Singh, H.; Sharma, A. ANFIS: Adaptive neuro-fuzzy inference system-a survey. International Journal of Computer Applications2015,123.
28. Uçar, T.; Karahoca, A.; Karahoca, D. Tuberculosis disease diagnosis by using adaptive neuro fuzzy inference system and rough sets. Neural Computing and Applications2013,23, 471–483.