PROBABILITY OF FIXATION AND MEAN FIXATION TIME OF AN OVERDOMINANT MUTATION*
MASATOSHI NE1 AND A. K. ROYCHOUDHURY
Center f o r Demographic and Population Genetics, University of Texas, Houston, Texas 77025
Manuscript received August 14, 1972
Revised copy received January 11, 1973 Transmitted by R. C. LEWONTIN
ABSTRACT
The probability of fixation of an overdominant mutation in a finite popu-
lation depends on the equilibrium gene frequency in an infinite population
( m ) and the product ( A ) of population size and selection intensity. If m
<
0.5(disadvantageous overdominant genes), the probability is generally much lower than that of neutral genes; but if m is close to 0.5 and A is relatively small, it becomes higher. If m
>
0.5 (advantageous overdominant genes), the probability is largely determined by the fitness of heterozygotes rather than that of mutant homDzygotes. Thus, overdominance enhances the prob- ability of fixation of advantageous mutations. The average number of gen- erations until fixation of an overdominant mutation also depends on m and A .This average time is long when m is close to 0.5 but short when m is close to 0 or 1. This dependence on m and A is similar to that of ROBERTSON'S retardation factor.
BECAUSE of its evolutionary importance, the probability of fixation of a new mutant gene in a population has been studied by many authors
(HALDINE
1927;FISHER
1930;WRIGHT
1942;KIMURA
1957; and others). These authors have worked out rather simple formulae for the probability of fixation of a domi- nant, semidominant o'r recessive gene. Very little attention, however, has been paid to an overdominant mutation, perhaps because this type of mutation creates a stable polymorphism in a large population. In nature, however, the effective size of populations is sometimes quite small, so that even overdominant genes may be fixed or lost from the populationby chance. This is true also in laboratory
experiments such as those conducted byTRACEY
(1972). I n a study of steady decay of genetic variability,ROBERTSON
(1962) showed that in a finite popula- tion overdominance may accelerate rather than retard fixation of genes, if the equilibrium gene frequency in an infinite population is outside the range of approximately 0.2 to 0.8.EWENS
andTHOMSON
(1970) and CARR andNASSAR
(1970b) obtained a similar result from a study of the average time to fixation or loss. These results suggest that the probability of fixation of an overdominant gene is rather complicated, depending on the relative values of selection coeffi- cients for homozygotes.
* Part of this work was done while the authors were tenured at the Division of Biological and Medical Sciences, Brown
3 72 111. N E 1 A N D A. K. R O Y C H O U D H U R Y
Theoretically, a general formula for the probability of fixation of a gene was derived by KIMURA ( 195 7, 1962). In the case of overdominant genes, however, numerical integration is required, though in very special cases simplified form- ulae can be obtained. CARR and
NASSAR
(1970a) numerically studied the rela- tion between the probability of fixation of overdominant genes and the initial gene frequency. This study appears to be important in relation to animal and plant breeding but apparently is not for evolutionary studies.In the study of evolution it is also important to know the mean fixation time for an overdominant gene.
KIMURA
and OHTA (1969) studied this problem for the special case of the equilibrium gene frequency equal to 0.5 and showed that overdominance prolongs the fixation time compared with that of neutral genes.EWENS
and THOMSON (1970) and CARR andNASSAR
(1970b) studied the ex- pected time until fixation or loss, without separating the events of fixation and loss.In the present paper we shall study the probability of fixation of a single over- dominant mutation that appears in a population of size
N .
Thus, the initial gene frequency is always 1/
(2N). We will also investigate the average number of gen- erations until fixation, excluding the event of loss.PROBABILITY O F F IXA TI ON O F A M U T A N T G E N E
Consider a randomly mating diploid population of size
N ,
in which an over- dominant gene a and its allelic geneA
are segregating. Letx
be the gene fre- quency of a. We designate the fitnesses of genotypes AA, Aa, and aa byWAA
=1
-
sl,WA,
= I, andWa,
= 1-
s,, respectively. Then, the mean ( M a x ) and variance (V,,) of the change of gene frequency per generation are given by( 1 )
V a z = x ( l -x)/(2N) (2)
M6z=
- (sl+ s,) ( X - m ) x ( l-
S)where m = s l / (sl -I- s,) is the equilibrium gene frequency in an infinitely large population. Putting these quantities into
KIMURA'S
(1962) general formula, the ultimate probability of fixation of gene a becomes(3)
where p is the initial gene frequency of a and A = 2 N ( s 1 -I- sz)
.
In the present paper p is I/ ( 2 N ) , unless it is mentioned otherwise. When A is small compared with unity, the above formula can be simplified by expanding the integrand(ROBERTSON
1962). Also, formula (3) can be written as U h b ) =y.4
(X-112)' d z /J:
&(z-m)' dxOVERDOMINANT MUTATION 3 73
Equilibrium Gene Frequency
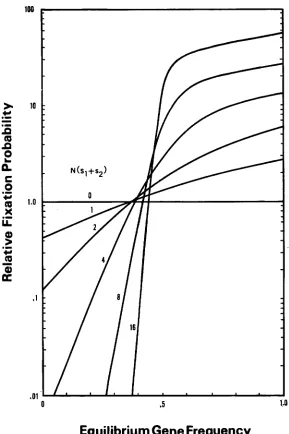
FIGURE 1.-Probability of €ixation of a n overdominant mutation relative to that of a neutral mutation.
(4) was used to check the numerical computations. Numerical results were also checked by evaluating the Taylor expansions of formula (3).
3 74 M. N E 1 A N D A. K. ROYCHOUDHURY
(exp A m 2 ) / ( 2 N ) approximately, so that the relative fixation probability is 2NUh ( p ) 1 dmz/ /:d(x-m)z dx
approximately. Thus, it depends only on A and m. It is seen that the relative fixa- tion probability is lower than 1 if m sl/(sl+ s,) is much smaller than 0.5. This is expected because in this case the fitness ( 1 - s,) of mutant homozygote aa is lower than that ( 1 - sl) of wild-type homozygote AA. The relative fixation probability increases as m increases, and the rate of increase is higher when N ( s ,
+
s,) is large. Here, a n interesting property emerges; the relative fixation probability becomes higher than 1 when m is close to but still smaller than 0.5.Namely, uh ( p ) is higher than the probability of fixation of a neutral gene even if aa is less fit than AA. This may be explained by the initial advantage of the a gene. When the frequency of the a gene is small, it is mostly in the heterozygous condition, so that it has a selective advantage over the wild-type allele. If m is larger than 0.5, uh ( p ) is always larger than that of neutral gene.
I t is known that for a n advantageous mutation to be fixed in the population the fitness of heterozygotes plays an important role. Thus, the probability of fixation of a completely dominant gene ( W A A = 1
-
si, W A , = 1,W,,
= 1) is almost thesame as that of a semidominant gene (W,,, = 1
-
sl, WA, = 1, W,, = 14- sJ. Thus, it is interesting to compare uh ( p ) with the probability of fixation of a semi- dominant gene. The probability of fixation of a semidominant gene is given byus ( p ) = 4Ns,p/(l
-
e-4Ns1)approximately, when s1 is small compared
with
unity. Then, the ratio uh ( p > / U 8 ( p ) is(1 - C Z A m )
eA”’
2Am J ; e ~ ( z - m ) ’ d x
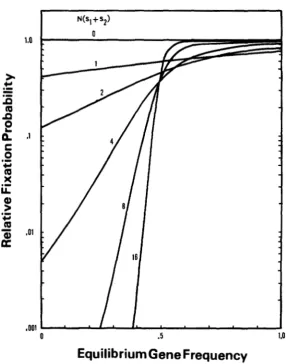
approximately. Note that 4Ns, is equal to 2Am. This value is again dependent only on A and m. This ratio is given in Figure 2. Clearly, this value is smaller than 1 when the fitness of aa is lower than that of AA ( m
<
0.5). That is, in this case the probability of fixation of an overdominant gene is affected by the fitness of aa as well as by the fitness of Aa. However, if the fitness of aa is higher than that of AA, uh(p) is largely determined by the fitness of heterozygotes. If m>
0.5 and N ( s , -k sz)>
16, uh ( p ) is ahnost the same as us ( p ) ._-_____.
M E A N FIXATION T I M E
KIMURA and OHTA (1969) derived a general formula for the average number of generations until fixation of a mutant gene in the population. It is given by
where
O V E R D O M I N A N T M U T A T I O N 3 75
C
0
c,
tu
X
.I
ii
0 )>
.I
Equilibrium Gene Frequency
FIGURE 2.-Probability of fixation of an overdominant mutation relative to that of a semi- dominant mutation.
G(z) = exp { - - 2 S ( M , , / V , , ) d 4 f
Therefore, using the expressions for
M,,
andV ,
given in (1) and(e),
we can derive the following formula.where
K
=j:
exp A ( x - m )2dx
and K‘ =1:
exp A (x-m) 2dx.3 76
E
i=
E
0
(0
K
E
(0
.-
+.rii
s
9)
>
c,
Q
aa
.-
-
a
C
M. NE1 A N D A . K . ROYCHOUDHURY
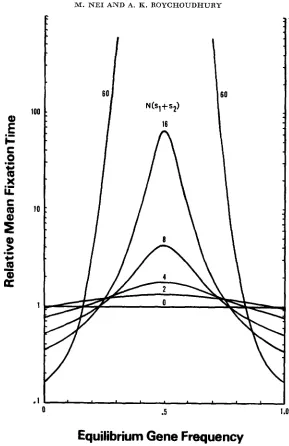
FIGURE 3.-Mean fixation time of an overdominant mutation relative to that of a neutral mutation.
-
tl ( p ) is given relative to the fixation time of a neutral mutation, i.e. LEN ( KIMURA
OVERDOMINANT MUTATION 377
the relative fixation time is virtually symmetric around m = 0.5. The relation between the relative mean fixation time and m is superficially similar to that between ROBERTSON’S (1962) retardation factor and n, though the absolute values are considerably different. For example, when N(sl
f
s,) = 16 and m 0.5, the relative fixation time is 68.3, while the retardation factor is slightly more than 100.Although the relative fixation time and retardation factor are superficially similar, the explanations must be entirely different. The retardation factor is the rate of decay of gene frequency distribution at steady state relative to that of
neutral genes. Mathematically, the rate of decay is given by h = -
-
,
in which + ( x ; t ) is the gene frequency distribution at steady state. On 1#J
( x ; t > ? + ( x ; t )---
at
the other hand, the average fixation time is defined as
where u(p,t) is the probability that a gene whose initial frequency is p is fixed in the population by generation t (KIMURA and
OHTA
1969).From the above definitions it is clear that the retardation factor 2Nh (the rate of decay for neutral genes = 1/(2N)) is symmetric around m =
0.5, since both
the loss and fixation of genes are taken into account. The reason for the symmetry ofil
( p )
is less obvious, but it is provided by studying the conditional sojourn time (MARUYAMA and KIMURA 1971; EWENS 1972). These authors have shown that the mean time the frequency of mutant gene a spends in the interval ( 5 ,x
-I-dx)
,
given that eventually a is fixed, is t i ( 5 )dx,
wheret * ( x ) =2{1 -u(p)}u(x) { u ( p ) ~ ~ ~ ( x ) } - l ~ ~ ( y ) d y .
o
5 xI
p
In the present case p = 1/(2N) is very close to 0 when N is large, so that we can neglect the range 0 I
x
5 p . Then, the conditional sojourn time, t*(x),
iswhere
K =
J:
exp A ( y - m ) *dY.It is now clear that t i (x,m) is equal to t* (1--z, l-m)
.
Therefore, the average fixation time, which may be obtained byJ,’
t* (x,m)d-z, becomes symmetric around m=0.5 when p-+ 0. Note that the first term in ( 5 ) is the same as,fi
t i (z,m)dx.
The second term of this equation appears because actually p is not 0, but this term, which causes a slight asymmetry of tl(p), is negligibly small compared with the first term.3 78 M. NE1 A N D A. K. R O Y C H O U D H U R Y
TABLE 1
Average numbers of generations uniil fixation and loss of an overdominant gene with N = 10 and sI
+
sg = 0.4.These results were obtained by the Markov chain method
Probability Fixation time Loss time
m of fixation (eenerations) leenerations)
0.1 .WO55 29.98 6.51
0.2 .00272 37.29 8.38
0.8 .4894 37.31 3.51
0.9 .5621 29.99 2.70
until fixation and loss were separately recorded. Some of the results obtained are given in Table 1. It is clear that even in a population of size 10 the symmetry about fixation time is observed. On the other hand, there is no such symmetry about the average loss time. We also studied the probability distribution of fixa- tion time, i.e. A u ( p , t ) / u ( p ) , where A u ( p , t ) is the absolute probability of fixation at generation t. The values for selected generations are given in Table 2. It is seen that the probability distributions of fixation times for mutant genes with m and
with
1-
m are virtually the same except for the first generation, of which the values are extremely small. While we have not fully understood why the two probability distributions should be virtually the same, this provides another explanation for the symmetry of average fixation time around m = 0.5. In this connection, it is worthwhile to note that in the four cases given in Table 2 the steady state distribution of gene frequencies (with the accuracy of the second significant value) was attained approximately at the 50th generation, by which time the mutant gene had been lost or fixed with probability 0.90-
.99.One of the interesting conclusions which can be made from this study is that
TABLE 2
Probabilities of fixation of an overdominant gene at selected generations (Au(p,t)/u(p)) with N =10 and s1
+
s, = 0.4.These results were obtained by the Markov chain method
Generation m = 0.1 m = 0.2 m = 0.8 m = 0.9
1 2 3 4 5 10 20 30 40 50 100 150 U(P)
.258 x 10-22
,448 x .I81 x .I18 x 10-4
.01224 .03525 .02412 ,01331
.
00 705.ia
x
10-3.279
x
10-3,110 x 10-4
.OW55
.116 X 10-*2
,208
x
16-10,889
x
10-7.mi
x 10-5.750
x
10-4.00742 .a71 1
.(I2293 .a1540 .(10986
.995
x
10-3.io0 x 10-3
.W272
.I65
x
10-22 .203x
10-10,871
x
10-6.594
x
10-5.744 x 10⁻⁴
.00741 .(M.711 .a294 .01541 .0987
.996 x 10-3
.loo
x
10-3.a94
.423
x
1 0 - 2 2.434 x 10⁻¹⁰
.176 x 10-6
. i f 6 x 1 0 - 4
.14o x 10-3
.01222 .a3526 02413 .01331 .00705 .279 x 10-3
,110 x 10-4
OVERDOMINANT MUTATION 3 79 the fixation time of a completely dominant mutation ( s z = 0) is the same as that of a completely recessive mutation (sl = 0) when N ( s l
4-
s p ) is the same for the two cases.DISCUSSION
We have seen that disadvantageous overdominant genes
( W A A
>
W,,)
are fixed in a population generally with a low probability. However, if m is close to0.5, the probability of fixation is higher than that for neutral genes in relatively
small populations. If such a gene is fixed, the fitness of the population is expected to decline by the amount W A , -W,,,
compared with the fitness before the mutant gene is introduced. On the other hand, advantageous overdominant genes ( W A A<
W,,) always have a higher probability of fixation than neutral genes.In this case overdominance enhances the probability of fixation considerably. In
large populations the probability is determined not byW ,
- W A A but byWA,
-
W A A .
IfLENS,
>>
1, it is roughly 2s,=
2(WAa
- W , , ) . This has an evolutionary implication. If an advantageous mutation has a slight overdominant effect in the heterozygous condition, it has a higher probability of fixation than a completely dominant mutation whenW,, -
WAa remains the same.One of the interesting results in this study is that the mean fixation time of a mutant gene is highly dependent on the value of m. If m is within the range of approximately 0.2 to 0.8, the fixation time is longer than that of neutral genes in relatively small populations, while if m is outside the range, it is shorter. This suggests that the contribution of the first group of genes (0.2
<
m<
0.8) to the genetic variability of a population is much larger than that of the second group of genes ( m<
0.2 or m>
0.8). Thus, it is likely that the majority of overdominant genes found in natural populations is of the first group. A similar conclusion has been derived by ROBERTSON (1962) in his study on the rate of decay of genetic variability at steady state.The mean fixation times of a mutant gene with m
<
0.2 and of a gene with m>
0.8 are both shorter than that of neutral genes in relatively small popula- tions. However, the former is fixed in the population with a very small proba- bility, so that it is unimportant in practice. On the other hand, the probability of fixation of advantageous genes with m>
0.8 is enhanced by overdominance, as mentioned above. It is interesting to note that the fixation of such genes is not retarded but accelerated by overdominance.EWENS and THOMSON (1970) studied the mean time to loss or fixation of an overdominant allele in finite populations. This mean time
(t(
p ) ) is related to the mean fixation time ( & ( p ) ) by t ( p ) = uh(p)il(p) -t (1 - uh(p)}to(p), where & ( p ) is the mean loss time (KIMURA 1971). When p = m, they found that the dependence of t ( m ) on m andN
( s184-
s2) is very similar to that of ROBERTSON’S retardation factor. This similarity. however, can be easily explained, since the phenomena studied by ROBERTSON (1962) and EWENS and THOMSON (1970) are essentially the same. The dependence of our mean fixation time (tl(p)) on M380 M. N E 1 A N D A. K. ROYCHOUDHURY
discussed, the explanation seems to be quite different from that of retardation factor.
This study was supported by NSF grant GB-21224, PHS grants GM-17719 and GM-20293. We thank DR. MOTOO KIMURA for his valuable comments.
LITERATURE CITED
ABRAMOWITZ, M. and A. STEGUN, 1964 Handbook of Mathematical Functions. National Bureau of Standards, Washington, D. C.
CAFUI, R. N. and R. F. NASSAR, 1970a Effects of selection on drift on the dynamics of finite popu- lations. I. Ultimate probability of fixation of a favorable allele. Biometrics 26: 41-49. -, 1970b
Ewens, W. J., 1972 Concepts of substitutional load in finite populations. Theoret. Population Biol. 3: 153-161.
EWENS, W. J. and C. THOMSON, 1970 Heterozygote selective advantage. Ann. Hum. Genet. 33:
365-376. FISHER, R. A., 1930 HALDANE, J. B. S., 1927
KIMURA, M., 1957
11. Expected time to fixation or loss of an allele. Biometrics 26: 221-227.
The Genetical Theory of Natural Selection. Clarendon Press, Oxford. A mathematical theory of natural and artificial selection. Part V. Se- lection and mutation. Proc. Camb. Phil. Soc. 28: 838-844.
Some problems of stochastic processes in genetics. Ann. Math. S t a t . 28:
882-902.
-,
1962 On the probability of fixation of mutant genes in a population. Genetics 47: 713-719. -, 1971 Theoretical foundation of population genetics at the molecular level. Theoret. Pop. Biol. 2: 174-178.The average number of generations until fixation of a mutant gene in a finite population. Genetics 61 : 763-771.
Some methods for treating continuous stochastic processes
in population genetics. Japan J. Genet. 46: 407-410.
Selection for heterozygotes in small populations. Genetics 47: 1291-1300. Sex chromosome translocations in the evolution of reproductive isolation. KIMURA, M. and T. OHTA, 1969
MARUYAMA, T. and M. KIMURA, 1971
ROBERTSON, A., 1962 TRACEY, M. L., 1972
WRIGHT, S., 1942
Genetics 72: 317333.