Electronic Thesis and Dissertation Repository
September 2014
Analytic Network Process (ANP) for Housing
Quality Evaluation: A Case Study in Ghana
Lucia Kafui HusseyThe University of Western Ontario Supervisor
Dr. Jacek Malczewski
The University of Western Ontario
Graduate Program in Geography
A thesis submitted in partial fulfillment of the requirements for the degree in Master of Arts © Lucia Kafui Hussey 2014
Follow this and additional works at:https://ir.lib.uwo.ca/etd
Part of theGeographic Information Sciences Commons,Human Geography Commons, and the Other Geography Commons
This Dissertation/Thesis is brought to you for free and open access by Scholarship@Western. It has been accepted for inclusion in Electronic Thesis and Dissertation Repository by an authorized administrator of Scholarship@Western. For more information, please [email protected], [email protected].
Recommended Citation
Hussey, Lucia Kafui, "Analytic Network Process (ANP) for Housing Quality Evaluation: A Case Study in Ghana" (2014).Electronic Thesis and Dissertation Repository. 2407.
ANALYTIC NETWORK PROCESS (ANP) FOR HOUSING QUALITY
EVALUATION: A CASE STUDY IN GHANA
(Thesis Format: Monograph)
By
Lucia Kafui Hussey
Graduate Program in Geography
A thesis submitted in partial fulfillment of the requirements for the degree of
Master of Arts
The School of Graduate and Postdoctoral Studies The University of Western Ontario
London, Ontario, Canada
ii
Quality of housing is crucial to an individual's quality of life as it is known to affect human
health and well-being. Several studies have employed different methods to assess housing
quality. These methods, however, failed to account for the interdependence among the
factors (criteria) used for evaluating the quality of housing. This thesis proposes an
Analytic Network Process (ANP)-based framework, integrated into Geographic
Information Systems (GIS), to assess housing quality. ANP is a multicriteria analysis
method. It provides a tool for identifying the relative importance of all the elements
(criteria) influencing a goal of decision/evaluation problem (e.g., the problem of evaluating
housing quality). The method allows for incorporating dependence relationships into the
multicriteria evaluation procedure. A case study of housing quality evaluation at the district
level in Ghana using the framework is presented. A set of quality based indicators related
to the physical (structural material, dwelling types, housing services), socio-economic
(tenure and household density (overcrowding) and environmental (modes of solid waste
and liquid waste disposal) aspects of dwellings was used for the evaluation. The results
demonstrate the effectiveness of the proposed approach. The GIS-based ANP approach
allows for examining spatial distribution of housing quality. It also identifies the most
important factors (indicators) contributing to the variability of housing quality in Ghana.
iii
To God be the glory! Indeed, your grace and mercies had brought me this far. This thesis
would not have been successful without the support of countless people. My profound
gratitude goes to my supervisor, Dr. Jacek Malczewski for his guidance and advice
throughout the writing of this thesis. It was truly an excellent learning experience. I would
also like to express my gratitude to my supervisory committee member, Dr. Godwin Arku,
who gave me valuable suggestions during my study. I extend thanks to my thesis examiners
(Dr. Michael Buzzelli, Dr. Isaac Luginaah and Dr. Girma Bitsuamlak) for the time spent
reading through my thesis and the useful comments provided.
Without the relevant data, this thesis would not have been completed. I would like to thank
Dr. Alex Barimah Owusu of the Department of Geography and Resource Development,
University of Ghana, for taking time off his busy schedule to follow up and obtain the data
used for this research. I am grateful to Mr. Frederick Armah, for his time spent reading
through my thesis. Your invaluable comments and suggestions on various drafts of this
work is very much appreciated. I wish to thank the staff in the Department of Geography
at Western University; especially Lori Johnson for all the help.
Finally, none of this would have been possible without the love and support of my family.
I appreciate all your prayers, encouragement and continuous support. Mr. Kuadzi and
Benedicta, this journey would not have been possible without your financial support, I am
grateful. Mum, your constant phone calls to check on me and your prayers gave me the
strength to come this far, thank you. Throughout the writing of this thesis, I have had the
support of many of my friends. Some supported me with their prayers, time and constant
iv
Abstract ... ii
Acknowledgement ... iii
Table of Contents ... iv
List of Tables ... vii
List of Figures ... viii
List of Plates ... x
List of Appendices ... xi
CHAPTER ONE ... 1
INTRODUCTION AND CHAPTER OUTLINE ... 1
1.1 Introduction ... 1
1.2 Objectives ... 6
1.3 Rationale and Contribution to Literature ... 8
1.4 Thesis Organization ... 9
CHAPTER TWO ... 10
LITERATURE REVIEW ... 10
2.1 Introduction ... 10
2.2 Overview of Analytic Network Process ... 10
2.2.1 Decision/Evaluation Problem ... 14
2.2.2 Input ... 15
2.2.3 Evaluation Criteria ... 16
2.2.4 Methodology and Software ... 18
2.2.5 Effectiveness of the ANP method and advantages of integrating GIS with ANP ... 19
2.3 Housing Quality ... 22
2.3.1 Introduction ... 22
2.3.2 Concept of Housing Quality ... 22
2.3.3 Measurement of Housing Quality ... 24
2.3.4 Types of Indicators ... 28
v
2.4 Summary and Conclusion ... 36
CHAPTER THREE ... 38
THE GIS-ANP METHOD ... 38
3.1 Introduction ... 38
3.2 Multicriteria Decision Analysis ... 38
3.3 Spatial Multicriteria Analysis ... 39
3.4 GIS-based (spatial) Multicriteria Decision Analysis Framework ... 40
3.5 Analytic Network Process (ANP) ... 42
3.6 The ANP Procedure ... 46
3.7 GIS-ANP Framework ... 53
3.8 Summary ... 56
CHAPTER FOUR ... 57
GIS-ANP: APPROACH TO EVALUATE HOUSING QUALITY ... 57
4.1 Introduction ... 57
4.2 Study Area Profile ... 57
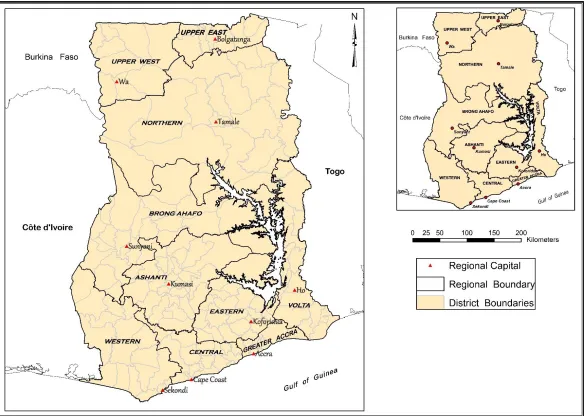
4.2.1 Location and Size and Administrative Characteristics ... 57
4.2.2 Housing Profile of Ghana ... 60
4.3 Data and Data Sources ... 62
4.4 An Illustrative Example: The ANP Housing Quality Evaluation ... 63
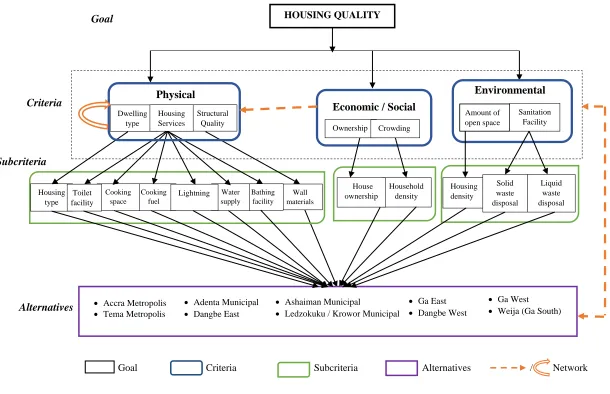
4.4.1 Structuring of the Decision Problem ... 63
4.4.1.1 1st Cluster: Physical Criterion ... 66
4.4.1.2 2nd Cluster: Socio-economic Criterion ... 66
4.4.1.3 3rd Cluster: Environmental Criterion ... 67
4.4.2 ANP Model Construction ... 68
4.4.3 Conducting the Pairwise Comparisons between Elements ... 71
4.4.4 Constructing the Supermatrices of ANP ... 96
4.5 GIS Integration ... 107
vi
5.1 Introduction ... 109
5.2 The Results ... 109
5.3 Discussion of the Results ... 110
5.3.1 Global Analysis ... 110
5.3.2 Analysis by Cluster ... 120
5.4 Sensitivity Analysis ... 122
5.5 GIS Integration ... 128
5.6 Summary and Conclusions ... 140
CHAPTER 6 ... 142
SUMMARY AND CONCLUSIONS ... 142
6.1 Introduction ... 142
6.2 Overview of Study and Strengths of the ANP-based Framework ... 142
6.3 Limitations of the ANP-based Framework for Housing QualityEvaluation . 144 6.4 Implications and Recommendations ... 145
6.5 Research Contribution and Recommendations for Future work ... 147
REFERENCES ... 149
APPENDICES ... 159
Appendix 1: Rating Model ... 159
Appendix II: Final Priorities (Limiting and Normalized by Cluster Priorities) for the Districts by Regions……...166
Appendix III: Unweighted Supermatrix ... 177
vii
Table 2.1: GIS-ANP Applications……….………...13
Table 2.2: Relevant Studies on Housing Quality………...…..………...26
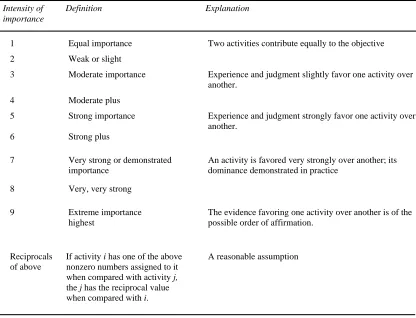
Table 3.1: Scale for Pairwise Comparison……….………..48
Table 3.2: Ratio Index for different values of n……….………..……..….…....50
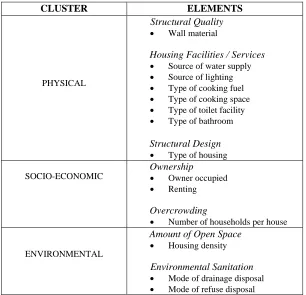
Table 4.1: List of housing quality criteria together with elements...67
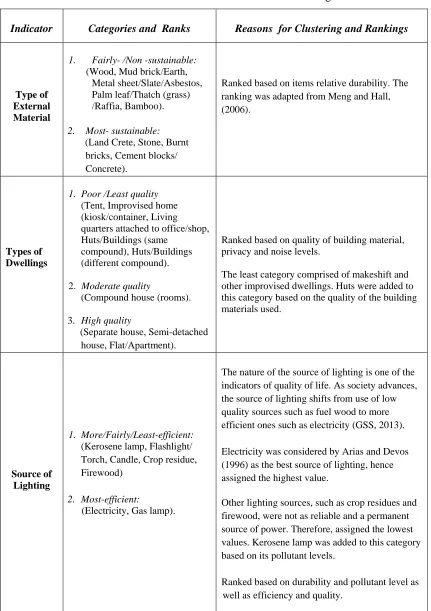
Table 4.2: Indicator Classification and Ranking………..……..….…74
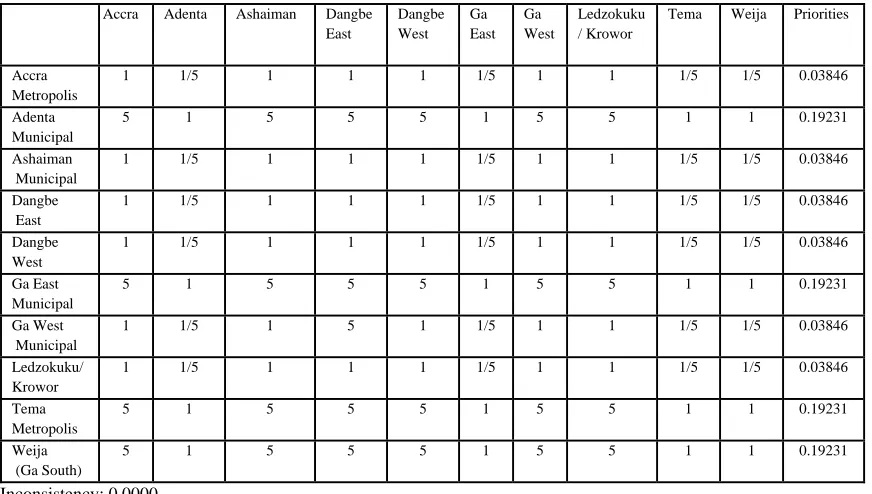
Table 4.3: Priorities for variables (Housing services and Environmental sanitation) for Greater Accra Region from the Rating Model……...……….….…..86
Table 4.4: Weights for each indicator from the Rating Model for Greater Accra Region………...……….………....87
Table 4.5: Pairwise Judgments of Dwelling type for Alternatives.…..………..…....89
Table 4.6: Pairwise Judgments of Housing Services for Alternatives...………....….89
Table 4.7a: Supermatrix of unweighted priorities for Greater Accra Region …….…..98
Table 4.7b: Supermatrix of Unweighted Priorities for Greater Accra Region (continuation)………..…...99
Table 4.8a: Weighted Supermatrix for Greater Accra Region……….101
Table 4.8b: Weighted Supermatrix for Greater Accra Region (continuation)…..…..102
Table 4.9a: Limit Supermatrix for Greater Accra Region……..……….104
Table 4.9b: Limit Supermatrix for Greater Accra Region (continuation)…..….……105
Table 4.10: Limiting Priorities and Normalized by Cluster Priorities………….……106
Table 5.1: Combination of Weights for the Sensitivity Analysis…….……...……123
viii
Figure 3.1: Spatial Multicriteria Decision Analysis Framework……….……….41
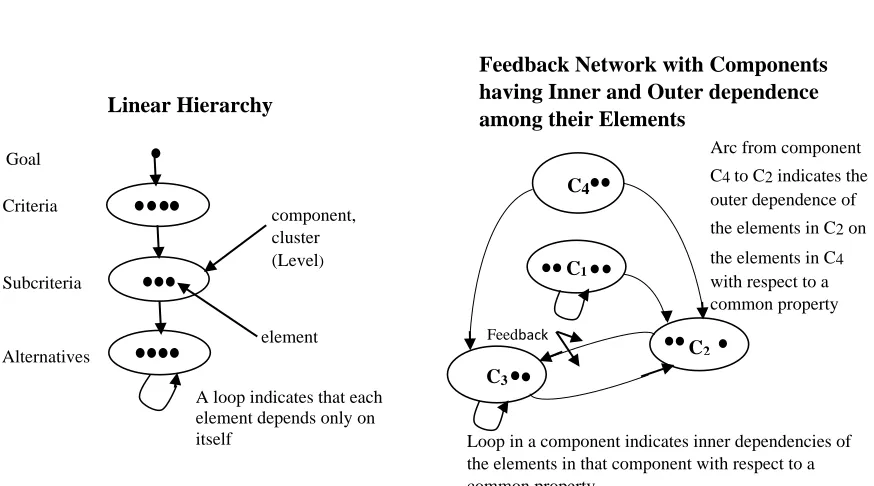
Figure 3.2: Comparison of a Hierarchy with a Network………..…...….44
Figure 3.3: The Bridge Model Presented in a Hierarchy (a) and Network (b) of Criteria (“clusters”, denoted by ovals) and Alternatives (“nodes”, dots within clusters) with Feedback……….……….………45
Figure 3.4: Steps followed in the Analytic Network Process ………..…………46
Figure 3.5: General structure of a Supermatrix………...……..…51
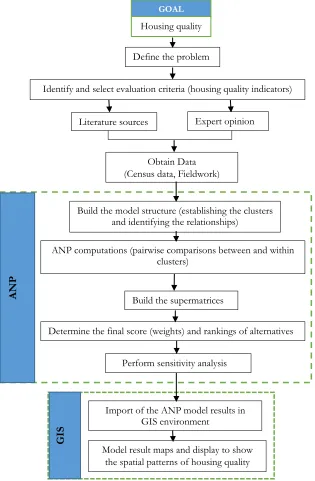
Figure 3.6: Framework for Evaluating Housing Quality……….….….54
Figure 4.1: Regional and District map of Ghana……….………...59
Figure 4.2: Structure of Housing Quality Evaluation Problem in Ghana……….…...65
Figure 4.3: The ANP Model for Evaluating Housing Quality at the District Level in Ghana………...………..70
Figure 4.4: Element Dwelling Type connected to Alternatives……….….…….70
Figure 4.5: Feedback structure with respect to the Accra Metropolis………..….71
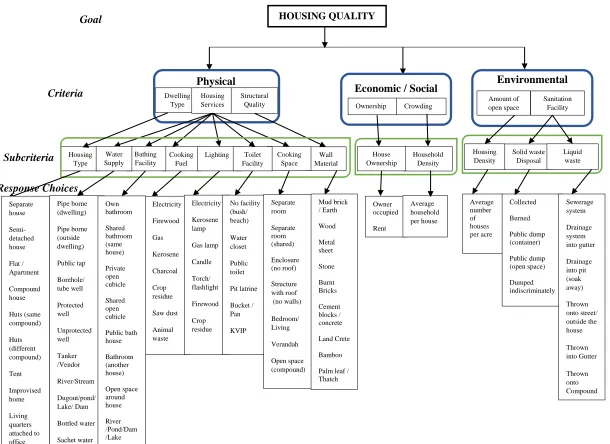
Figure 4.6: Housing Quality Evaluation Problem: The Response Choices for the Variables (Subcriteria)………...73
Figure 4.7: Cross section of the Rating model for Housing Quality….………81
Figure 4.8: Spreadsheet for Rating Model……….……….………..82
Figure 4.9: Deriving Priorities for the Outer Material Criterion Categories...82
Figure 4.10: The Questionnaire Mode for Comparing Alternatives with Respect to Dwelling Type Node in the Physical Cluster. ………...88
Figure 4.11: Comparison of Nodes in the Physical Cluster with respect to Accra Metropolis………..…91
ix
Figure 4.14: Inner Dependent Comparison for the Physical Cluster: Which Influences Housing Services more, Itself, Dwelling Type or Outer/ External material?...93
Figure 4.15: Outer Dependence Comparison of the Physical and Economic/Social Clusters: Which Influences Housing Services more: crowding or ownership………...96
Figure 4.16: Cluster Matrix for Greater Accra Region………..….….……….…...…..100
Figure 4.17: Final Results of Housing Quality for Districts in Greater Accra Region ………..106
Figure 4.18: Spatial Variation of Housing Quality for the Greater Accra Region....….107
Figure 5.1: Spatial Variation of Housing Quality for the Ashanti Region……….…..129
Figure 5.2: Spatial Variation of Housing Quality for the Brong Ahafo Region…...…130
Figure 5.3: Spatial Variation of Housing Quality for the Central Region…….…...…131
Figure 5.4: Spatial Variation of Housing Quality for the Eastern Region…………...132
Figure 5.5: Spatial Variation of Housing Quality for the Greater Accra Region...133
Figure 5.6: Spatial Variation of Housing Quality for the Northern Region…….…....134
Figure 5.7: Spatial Variation of Housing Quality for the Upper East Region…….….135
Figure 5.8: Spatial Variation of Housing Quality for the Upper West Region...136
Figure 5.9: Spatial Variation of Housing Quality for the Volta Region……….…....137
x
xi
List of Appendices
Appendix 1: Rating Model ... 159
Appendix II: Final Priorities (Limiting and Normalized by Cluster Priorities) for Districts by Regions………....……...….166
Appendix III: Unweighted Supermatrix ... 177
CHAPTER ONE
INTRODUCTION AND CHAPTER OUTLINE
1.1 Introduction
Housing is one of the basic necessities of life and a key aspect of human existence.
Irrespective of the level of society’s socio-economic development, it remains a basic
human need with its quality, cost and availability being vital to an individual's quality of
life (Bogdanović & Mitković, 2005; Jiboye, 2010a). Availability of housing constitutes a
critical component of quality of life and a vital indicator for measuring quality of life.
Previous studies have established relationship between quality of life and housing (Das,
2008; Oswald et al., 2003; So & Leung, 2004; Zebardast, 2009). These studies
demonstrated that housing is an important domain that contributes to the overall quality of
life of individuals. Das (2008) reported that, satisfaction from condition of housing is
strongly correlated with satisfaction with overall quality of life. Oswald et al. (2003) found
that housing related variables explains a substantial portion of the variance in life
satisfaction. So and Leung (2004) have shown that there is a strong correlation between
sufficient housing, visual acceptability of the houses and quality of life.
Housing may vary in its type, size and design, but whatever form it takes, there is a need
to measure its quality to ensure that it gratifies the resident’s family and cultural norms
(Mohit, Ibrahim & Rashid, 2010). Human beings spend more than 85 per cent of their
entire life inside buildings, hence, the characteristics of the buildings are of utmost
importance to an individual’s quality of life (So & Leung, 2004). Based on the need to
a person’s overall quality of life, numerous studies have employed different methods to
assess housing quality. Housing quality assessment have been applied in several studies.
Twitchell (1948) presented the appraisal method used by the Committee on the Hygiene of
Housing (USA) to evaluate housing quality in the United States. The method measured
housing quality based on a system of numerical scores. This was a unique feature of the
method. These numerical scores consisted of penalty points that are assigned to conditions
of the dwellings that fail to meet accepted housing standards as stipulated by the committee.
Houses that fail to meet these standards comprised of houses with deficiencies, which may
adversely affect health, safety or essential livability. Each deficiency in the houses is
graded according to the seriousness of that condition as a threat to health or safety or as an
impairment of general livability. For comparative purposes, the approach classified houses
into quality grades based on the median total penalty scores and shown on a map, which
summarizes the appraisal of the houses. This method is intended for use primarily in areas
known to contain mediocre or poor housing and not for city-wide applications.
Pollard (1953) adopted a method similar to the appraisal method to assess housing quality.
However, this method takes statistical equivalent as a point of departure (% of dwelling
units that are dilapidated in a given census tract is equivalent to the probability that any
one dwelling unit in that tract is dilapidated). Pollard argued that the appraisal method
would largely fail to produce a clear picture of the relative quality of housing. This is
because there are an uneven number of dwelling units in each group (a group being those
building blocks having the same number of penalty points). Just like the appraisal method,
buildings for each census tract. These methods were used in developed country,
specifically the USA.
Unlike the developed world, developing countries lack an active real estate (housing)
market with well-documented housing information, which can be used for effective
assessment of housing quality. As such, Rindfuss et al. (2007) proposed a new method
based on a standardized subjective rating process. This method involves observation from
outside including taking pictures of dwelling units, having an intuitive sense of their
relative value and ranking them on a five-point quality scale. They argued that, the standard
building-components method (asking questions on building materials used in the dwelling
unit) that was being used in developing countries is poor at measuring housing quality as
these surveys do not have a standardized set of questions.
Furthermore, Kurian and Thampuran (2011) developed a methodology for assessing
housing quality using requirements of a target population based on multivariate statistics.
The method identified various indicators (location, design of buildings, materials and
construction techniques, aesthetics etc.) that contributed to the housing quality
requirements of a homogeneous population in a community and their relative weightings.
In order to study the relationships between the various factors and indicators, they used a
stepwise multiple regression model.
Although different methods have been proposed and used to assess quality of houses, a
common limitation of these methods is that, except Twitchell (1948), none of them
accounted for the spatial patterns of housing quality as an important aspect in making
they are limited by their selected application areas; that is, their focus on homogenous
population and non-city-wide case studies. In addition, these methods used very basic
techniques for the evaluation, as a result not able to produce a comprehensive appraisal of
housing quality. Because of the simplistic nature of these methods, it is necessary to
consider a more comprehensive approach to evaluate housing quality. Moreover, the
indicators used for housing quality assessment have multiple and conflicting aspects that
need to be addressed as housing quality evaluation. Multicriteria Decision Analysis
(MCDA) techniques are suitable for addressing these challenges.
MCDA allows for capturing the diversity of indicators (criteria) for the assessment of
housing quality, providing decision makers (and policy makers) a better understanding of
the trade-offs between evaluation criteria (Natividade-Jesus, Coutinho-Rodrigues, &
Antunes, 2007). MCDA can combine a large number of evaluation criteria to obtain a
composite measure of housing quality and allows weighting of individual indicators. The
MCDA-based composite housing quality scores could inform subsequent housing
decision-making like tenants or buyers choosing suitable dwellings, and architects
selecting the best design alternatives during the preconstruction stages.
Studies that used MCDA to assess housing quality include Can (1992) and Meng and Hall
(2006). Can (1992) used generalized concordance-discordance analysis to assess
residential quality as a discrete multicriteria evaluation problem and generated a general
performance score for geographical units based on their socioeconomic attributes. Meng
and Hall (2006) employed a relatively simple multi-attribute analysis. The method
create an index. The weighted sum of the indicators was used to create the housing quality
index.
However, Can (1992) and Meng and Hall (2006) methods fail to account for the
relationships between the indicators used for the assessment of housing quality. To address
this limitation, Analytic Network Process (ANP) could be used. Thomas Saaty, who is also
the author of the well-known Analytic Hierarchy Process (AHP), proposed the ANP
technique (Saaty, 1996). The ANP is a MCDA method that incorporates the influences and
interactions among the elements of the system (decision problem) and allows for more
complex, interdependent, relationships, and feedback among elements in the hierarchy.
Furthermore, ANP makes it possible to consider all kinds of dependence and feedback in
the decision problem (Sipahi & Timor, 2010).
ANP is gaining popularity and has found application in various fields. In the field of solid
waste management, Khan and Faisal (2008) have used ANP for prioritizing and selecting
appropriate municipal solid waste disposal methods, Aragone´s-Beltra`n et al. (2010)
applied the method to select the optimal location of municipal solid waste plant in Valencia
(Spain). Other studies that have used ANP include Banar et al. (2007) for choosing one of
the four alternative landfill sites in Eskisehir (Turkey). In the transport sector, Banai (2010)
applied ANP in light rail route selection by taking into account the station area landuse
interaction and property value. Likewise, Bottero and Lami (2010) used the method to
support the decision-making process related to the choice of different transport scenarios
in the town of Venaria Reale, Northern Italy. In risk assessment, Nekhay, Arriaza, and
Boerboom (2009) used ANP for soil erosion risk evaluation in Spain by identifying
employed the method for landslide hazard assessment in Nepal, Spain. Other areas of the
ANP method applications include industrial management (Karsak, Sozer, & Alptekin,
2003; Partovi, 2006), construction planning and project selection (Chen et al., 2005; Cheng
& Li, 2005), energy policy (Erdogmus et al., 2006; Ulutas, 2005) and forest management
(Wolfslehner et al., 2004). Most of these studies (e.g. Banai, 2010; Nekhay et al, 2009)
have indicated the effectiveness of the ANP method in their application areas as it allowed
for interdependence and interrelationships among the factors and indicators used and
further measured dependencies among them. Other studies (e.g. Banai, 2010, Nekhay et
al., 2009) have stipulated that ANP can be used as a tool for making predictions under
uncertainty (limited data).
Although ANP has found its application in different fields with much success, it remains
to be explored in its application to housing quality evaluation. The method has not been
applied in this field, especially in the GIS-MCDA domain.This research therefore seeks to
apply ANP method to assess housing quality at the district level in Ghana to find out how
effective the method would be in evaluating housing quality by taking into account the
relationship between the indicators.
1.2 Objectives
There are three main objectives of this thesis:
1. to develop an ANP-based framework for housing quality evaluation,
2. to integrate the framework into GIS, and
Assessment of housing quality is a complex process that involves selecting and evaluating
several criteria (indicators) which affects the quality of houses. There are dependencies
among these criteria that have to be analyzed as housing quality evaluation. ANP as a
multicriteria decision analysis method is particularly suitable for dealing with complex
decision problems which are characterized by inter-relationships among the elements.
Using ANP for housing quality evaluation can help the decision maker(s) to translate a
number of indicators and the relationships between them into manageable units of
information. The ANP through its network structure can better capture the complex
evaluation problem of housing quality by allowing the dependence relationships among the
criteria (indicators) to be assessed, and the relative importance of all the indicators that
have an influence on housing quality to be evaluated.
Housing quality is considered as an abstract, theoretical entity with no straightforward
operational definition (Goodman, 1978). Ibem (2012) used the term housing quality to
denote those highly valued attributes that housing possesses that make it suitable in meeting
occupants’ needs. According to Meng and Hall (2006) a normative definition of housing
quality generally refers to:
The grade or level of acceptability of dwelling units and their associated and immediate residential environment, including the design and functionality of housing structures, building materials used, the amount of internal and external space pertaining to the dwelling, housing utilities, and basic service provision. (p. 415).
For the purpose of this research, Meng and Hall (2006) definition was adopted. In housing
quality assessment, two dominant approaches are used, objective (quantitative) and
physical, social and economic components. The subjective evaluation is based on user's
assessment of the ‘comfort’ or ‘quality of life’ that are afforded by different dwelling types.
Because of the difficulty in measuring housing quality with the subjective approach, the
objective measurements have often been used for housing quality index (e.g. Can, 1992;
Fiadzo et al., 2001; Meng & Hall, 2006; Muoghalu, 1991). The objective measurement
evaluates the physical features, amenities, services, and environment of the dwelling units.
However, objective measurements have been criticized for failing to explain the
psychosocial aspects of residential satisfaction (Mohit et al., 2010).Nevertheless, this study
adopted the objective approach, because the perceptions of residents are not incorporated
into the assessment.
1.3 Rationale and Contribution to Literature
The provision of housing has been a burden for some time now creating deficit in access
to housing in Ghana. The shortage in the housing availability is estimated at 1.7 million
housing units (Ansah, 2013). While trying to meet the general housing needs of the people,
access to decent and good quality housing still pose another serious challenge to sustainable
growth and development, as it is a stimulant to the national economy. There has been an
increasing demand for additional housing stock, the condition and total quality of the
existing stock, most of which falls short of the expected quality standards. Greatest of the
existing stock lack basic amenity and infrastructure and are deteriorating fast due to lack
of maintenance. What is currently known is that, there is difference in housing quality
between urban and rural areas. Further, within the urban areas, there exist a difference in
disparities at the district levels have not been examined. In order to address imbalances in
housing and housing quality, existing spatial variations in quality have to be identified. The
effectiveness of the MCDA method, specifically ANP, in assessing the spatial pattern of
housing quality, would be a precursor to any attempt at addressing this nagging issue of
housing imbalances at the districts in Ghana. In addition, the findings of this study is of
significance to housing policy and housing development in Ghana.
This study intends to contribute to the literature by demonstrating the usefulness of the
ANP method for analysing spatial patterns of housing quality. In this regard, the findings
of this work would advance research in the area of MCDA. Additionally, this study would
be useful to researchers who are interested in probing the usability of ANP in tackling other
spatial evaluation problems such as site selection and land use assessment problems.
1.4 Thesis Organization
The rest of the thesis is organized into five chapters. Chapter 2 overviews relevant literature
on housing quality evaluation (definition, indicators and measurement approaches) as well
as GIS-based ANP applications (various fields, criteria used, etc.). The GIS-ANP based
framework for housing quality evaluation is described in Chapter 3. Chapter 4 focuses on
application of the GIS-ANP framework to housing quality evaluation in Ghana. Results
and discussions are presented in Chapter 5. Finally, Chapter 6 provides a summary of the
research and concluding remarks. Discussion of the strengths and limitations of the
GIS-ANP approach for housing quality evaluation, implications of the study and suggestions
CHAPTER TWO
LITERATURE REVIEW
2.1 Introduction
The chapter presents a review of literature on Analytic Network Process (ANP) and
housing quality assessment. It is structured into two sections. The first section discusses
the ANP applications with a focus on those using Geographic Information System (GIS)
based ANP. Section two provides an assessment of the definition of the concept of housing
quality, measurement approaches of housing quality, followed by the types of indicators
used to operationalize the concept. The chapter concludes with a synopsis on how
GIS-ANP has been used and how housing quality has been assessed.
2.2 Overview of Analytic Network Process
Analytic Network Process as a multicriteria decision (evaluation) method is a more general
form of the Analytic Hierarchy Process (AHP). The AHP is a theory of measurement
introduced in 1980 by Thomas Saaty. It is used to derive relative priorities on absolute
scales from both discrete and continuous paired comparisons in multilevel hierarchic
structures (Saaty, 2006). This method adopts a hierarchical structuring of the decision or
evaluation problem. The top element of the hierarchy is the overall goal for a decision with
the alternatives listed in the bottom level of the hierarchy.
The AHP assumes independence between the elements of the same level and between
different levels (upper levels from lower levels) in the hierarchy. This implies that, AHP
relationships between a group of factors, or for interdependent relationships within a cluster
of factors (Taslicali & Ercan, 2006). Consequently, AHP is limited to rather static and
unidirectional interactions among the decision problems and alternatives with little
feedback. AHP has also been criticised for the problem of rank reversal (Belton & Gear,
1983; Dyer, 1990; Holder, 1990; Khan & Faisal, 2008; Leung & Cao, 2001). This problem
is attributed to the assumption of the hierarchic decomposition of the AHP method (Saaty,
1986), which can produce arbitrary results or the rankings of alternatives (Belton & Gear
1983; Dyer, 1990). Saaty (1996) proposed the generalization of AHP called Analytic
Network Process (ANP) in order to overcome the limitations of the AHP method.
The ANP method offers a general framework to deal with decisions without making
assumptions about the independence of higher level elements from lower level elements
and the independence of the elements within a level (Saaty, 1999). Many decision
problems cannot be designed hierarchically because they comprise the interaction and
dependence of higher-level elements in a hierarchy on lower-level elements (Saaty, 2006)
as independence of elements rarely occurs in real life situation. Therefore, ANP is
represented by a network, rather than a hierarchy and does not specify levels in a hierarchy.
As in most real world situations, the method considers elements to be interdependent of
each other. The replacement of the single direction relationships of AHP with dependence
and feedback of ANP makes it more powerful than AHP in the decision situations with
uncertainty and dynamics. In addition, ANP avoids the problem of rank reversal, making
the method more accurate and useful than AHP as a decision or evaluation tool for complex
analysis of AHP and ANP in assessing urban sprawl. They concluded that the results
obtained from ANP seem more rational than that of AHP.
Although AHP uses a linear hierarchic structure and ANP adopts a network structure, both
methods apply pairwise comparisons among elements using a 1-9 numerical scale (Saaty’s
fundamental scale); where one means equal importance of two factors (e.g., evaluation
criteria) and nine indicate an extreme level of importance of one criterion over the other.
While the two models rely on pairwise comparison matrix, both models use expert opinions
as inputs for decision factor weighting. But the benefit of ANP comprises the option of
network model structuring that echoes the interdependence between the things in the real
world quite well (Nekhay et al., 2009). ANP can help the decision makers to translate a
number of variables and the relationships between them into manageable units of
information (Aminu et al., 2013). Further, ANP can model complex decision problems
where AHP is not sufficient. Considering the ANP as an extension of the AHP, the
fundamental differences between the two MCDA methods can be summarized as:
1. with the AHP, decision problems are structured into a hierarchy (top to down),
whiles with the ANP, they are structured as a network.
2. in AHP, elements are considered/ assumed as independent, hence the
consideration of the decision criteria as such, whiles the ANP assumes
interdependence of the elements and decision criteria.
3. AHP considers alternatives as independent from each other as well as from the
decision criteria, whereas the ANP considers them to be dependent on the decision
A list of the GIS-ANP applications is shown in Table 2.1. Most of the studies were
conducted in Europe and Asia with only one study in Africa. Though ANP has been
popularized over the past decade, it is quite new to the field of spatial multicriteria decision
analysis as an applied model. GIS-ANP enable the method to account for the
spatial/geographical aspects of the problems being evaluated.
Table 2.1: GIS-ANP Applications
Study Decision/ Evaluation Problem Study Area Input (Data-Hypothetical / Real) Software (GIS) Software (ANP) Number of Criteria Neaupane and Piantanakulchai, 2006 Landslide hazard assessment.
Nepal Real N/A MATLAB 6
Nekhay Arriaza and Boerboom, 2007 Soil erosion risk evaluation. Olive groves of Montoro, Spain
Real ArcGIS
Super Decisions Software & MATLAB 6 Sabri and Yaakup, 2008
Urban Sprawl Iskandar, Malaysia
Real ArcGIS
Super Decisions Software & Excel 16 Nekhay, Arriaza and Boerboom, 2009 Soil erosion risk evaluation.
Spain Real N/A
Super Decisions Software 6 Babalola and Busu, 2011 Site suitability analysis for landfill siting in Damaturu town Nigeria.
Nigeria Real ArcGIS
Super Decisions Software 9 Ferretti, 2011 Land suitability assessment for siting a municipal solid waste landfill. Province of Torino, Italy.
Real ILWIS
Super Decisions Software.
24
Ferretti and Pomarico, 2012
Siting process of a waste incinerator plant.
Province of Torino, Italy
Real ILWIS
Super Decisions Software
19
Sarvar et al., 2012 Finding an optimum site for building neighbourhood parks. Bonab Township, Iran.
Real ArcGIS
Super Decisions Software
Isalou et al., 2013 Locating a suitable place for landfilling municipal solid wastes. Kahak Town, Qom City, Iran.
Real ArcGIS
Microsoft Office Excel 2007 & MATLAB
11
Agarwal et al., 2013 Delineation of groundwater potential zone. Unnao District, Uttar Pradesh India.
Real N/A N/A 10
Aminu, et al., 2013 Sustainable tourism planning in wetland environment.
Malaysia Hypothetical ArcGIS
Super Decisions Software N/A Shahmoradi and Isalou, 2013 Selection of a suitable site for establishing wastewater treatment plant
Kahak,
Iran. Real N/A
Super Decisions Software 12 Ferretti and Pomarico, 2013a Analysing land suitability for ecological connectivity Piedmont Region, Italy.
Real IDRISI
Super Decisions Software 12 Ferretti and Pomarico, 2013b Land suitability for ecological corridors Piedmont Region, Italy
Real IDRISI & ILWIS Super Decisions Software 12
2.2.1 Decision/Evaluation Problem
GIS-based ANP has found application in different fields across a number of decision or
evaluation problems. The major categories of problems are related to waste management
(Babalola & Busu, 2011; Ferretti, 2011; Ferretti & Pomarico, 2012; Isalou, Zamani,
Shahmoradi, & Alizadeh, 2013; Shahmoradi & Isalou, 2013) and risk assessment
(Neaupane & Piantanakulchai, 2006; Nekhay et al., 2007, 2009). In terms of waste
management, scholars have used the method to assess different decision problems
including site selection problems for landfilling municipal solid wastes (Babalola & Busu
2011; Ferretti, 2011; Ferretti & Pomarico, 2012; Isalou et. al., 2013) and wastewater
Nekhay et al. (2007, 2009) evaluated soil erosion risk. Neaupane and Piantanakulchai
(2006) assessed landslide hazard. Few studies have tackled other decision or evaluation
problems such as: land sustainable for tourism development (Aminu, et al., 2013),
evaluating urban sprawl (Sabri & Yaakup, 2008), delineation of ground water potential
zone location (Agarwal, Agarwal, & Garg, 2013), ecological land suitability (Ferretti &
Pomarico, 2013a; Ferretti & Pomarico, 2013b), and locating neighbourhood parks (Sarvar,
Hesari, Mousavi, & Orooji, 2012).
2.2.2 Input
The input utilized by these studies were real world problems as outlined above, except
Aminu et al. (2013) who adopted a hypothetical input (see Table 2.1). Although these
studies differed in terms of the specific problems, it was noted that, in terms of data inputs,
most of the studies used topographic and thematic maps (Agarwal et al., 2013; Babalola &
Busu, 2011; Ferretti, 2011; Ferretti & Pomarico, 2012; Ferretti & Pomarico, 2013b;
Neaupane & Piantanakulchai, 2006; Nekhay et al., 2009; Shahmoradi & Isalou, 2013),
field surveys and questionnaires (Agarwal et al., 2013; Nekhay et al., 2007, 2009; Sabri &
Yaakup, 2008; Sarvar et al., 2012), followed by expert opinion (Ferretti, 2011; Ferretti &
Pomarico 2012; Ferretti & Pomarico, 2013a; Ferretti & Pomarico, 2013b; Nekhay et al.,
2007, 2009; Sabri & Yaakup, 2008; Sarvar et al., 2012) and satellite and aerial photos
(Agarwal et al., 2013; Neaupane & Piantanakulchai, 2006; Nekhay et al., 2007). The
diversity of data inputs is a testimony to the usefulness of ANP in dealing with a wide
2.2.3 Evaluation Criteria
Once decision problems are identified, a set of evaluation criteria is used to operationalize
them. Different researchers have used varying criteria with the total number also varying
due mainly to the different problems that they assessed. This is in relation to the fact that
the set of evaluation criteria is problem-specific.
The number of criteria adopted by the studies varied and ranged from a minimum of three
(Ferretti & Pomarico, 2013a; Ferretti & Pomarico, 2013b; Sarvar et al., 2012) to a
maximum of twelve (Shahmoradi & Isalou, 2013). With the sub-criteria, ranging from a
minimum of eleven (Isalou et al., 2013; Sarvar et al., 2012) to a maximum of twenty-four
by Ferretti (2011). Agarwal et al. (2013) in delineating ground water potential zone location
used ten criteria. Ferretti and Pomarico (2013a) in their ecological land suitability analysis
relied on three criteria and twelve sub-criteria. Sarvar et al. (2012) used three criteria and
eleven sub-criteria to aid in finding an optimum site for building neighbourhood parks.
Sabri and Yaakup (2008) assessed urban sprawl problem using four criteria and sixteen
sub-criteria.
There were also substantial differences in the number of criteria and subcriteria used in
studies dealing with similar decision/evaluation problems. For example, different sets of
criteria were considered by the studies on the waste management decision/evaluation
problem. Whilst Shahmoradi and Isalou (2013) considered twelve criteria, Ferretti and
Pomarico (2012) took into consideration four criteria and twenty sub-criteria. Isalou et al.
(2013) used four criteria and eleven sub-criteria in their study of site suitability for
Some of the criteria and sub-criteria adopted by the studies (Babalola & Busu, 2011;
Ferretti, 2011; Ferretti & Pomarico, 2012; Isalou et al., 2013; Shahmoradi & Isalou, 2013)
were related and can be put under the broad index of hydrology (distance from rivers and
water bodies, wells and springs (groundwater), accessibility (distance from roads, and
residential areas and distance from city/town), natural-topography (slope, wind direction,
and aspect) and general public acceptance index (soil texture, land use, and geology).
Apart from these general criteria, Babalola and Busu (2011) in determining sites that are
appropriate for landfill siting in Damaturu town, Nigeria used rainfall as one of the criteria
whereby the annual average rainfall data of the study area were collected and used. In
addition, Ferretti (2011) and Ferretti and Pomarico (2012) used other sub-criteria in
combination with the above mentioned criteria. They are: slides, flood areas, ground water
depth, elevation, river basin, watershed protection plan, an index of naturalness, water
quality index, distance to dangerous industries and population density of the area. Ferretti
(2011) added distance to land reclamation areas and distance to waste production centre.
In the area of risk assessment, Nekhay et al. (2007, 2009) considered six factors, and
Neaupane and Piantanakulchai (2006) measured five factors in their studies of risk
assessment. Four factors (criteria) cut across the studies, they are: rivers and streams
proximity/ channel proximity, land use and vegetation cover/ grass vegetation cover
factors, slope steepness and slope length. In evaluating soil erosion risk in Spain, Nekhay
et al. (2007, 2009) also made use of rainfall runoff factor and soil erodibility. Whiles,
underlying geology and groundwater hydrology were used by Neaupane and
2.2.4 Methodology and Software
In terms of the methodology employed, apart from the GIS and ANP techniques, a few
studies included other methods. Example, Agarwal et al. (2013) combined remote sensing,
GIS and ANP. Ferretti (2013b) combined Ordered Weighted Average (OWA) with ANP
and GIS, while Shahmoradi and Isalou (2013) and Isalou et al. (2013) used GIS, integrated
fuzzy logic and ANP models. In applying the ANP method, the existing studies made use
of the various steps introduced by Saaty (2006) which include the following: (1) Definition
of the network structure; (2) Pairwise comparison of elements in clusters; (3) Forming the
super matrix by putting all weights yield from last step; (4) Forming the weighted matrix
by multiplying weights of clusters to super matrix; (5) Forming the limit matrix; and (6)
Synthesizing the results to get the priorities. In order to determine the weights among the
attributes as well as criteria, the studies used pairwise comparison and the matrix
manipulation method, which involve computing the unweighted supermatrix, weighted
supermatrix, and the limit matrix (Saaty, 1999; 2006).
The software utilized to carry out the ANP computations had variations among studies.
The most common software was the Super Decisions software (Babalola & Busu, 2011;
Ferretti, 2011; Ferretti & Pomarico, 2012; Ferretti & Pomarico 2013a, 2013b; Nekhay et
al., 2007, 2009; Sabri & Yaakup, 2008; Sarvar et al., 2012; Shahmoradi & Isalou, 2013).
Super Decisions software aids in the creation of the network structure of the
decision/evaluation problem, the interdependence of the clusters and further, implements
Few studies used MATLAB (Isalou et al., 2013; Neaupane & Piantanakulchai, 2006).
Others used MATLAB in addition to Super Decisions software (Nekhay et al., 2007, 2009).
Nekhay et al. (2007, 2009) argued that, Super Decisions software supports only a simple
cluster comparison and in order to reach the weighted supermatrix they relied on
MATLAB. Whiles Sarvar et al. (2012) used the MATLAB to process the results of the
questionnaire from experts. Aside Super Decisions and MATLAB, Isalou et al. (2013),
Sabri and Yaakup (2008) and Sarvar et al. (2012) used Microsoft office excel. For example,
Isalou et al. (2013) used Excel for the ANP calculations.
The ANP technique and its computation software do not include cartographic functions, as
a result, GIS software was employed by the existing studies. GIS software was used to
develop layers of spatial information (thematic maps), displaying and representing the
results of the ANP computations, standardization of maps, carrying out overlay analysis of
the weighted and criterion maps, site identification and modelling the final maps. Many of
the studies used ArcGIS (Babalola & Busu, 2011; Isalou et al., 2013; Nekhay et al., 2007,
2009; Sabri & Yaakup, 2008; Sarvar et al., 2012), few studies used ILIWIS (Ferretti, 2011;
Ferretti & Pomarico, 2012; Ferretti & Pomarico, 2013b) and IDRISI (Ferretti & Pomarico,
2013a).
2.2.5 Effectiveness of the ANP Method and Advantages of Integrating GIS with ANP
The effectiveness of the ANP method for tackling the decision/evaluation problems has
been reported in some of the reviewed studies. According to Khan and Faisal (2008) ANP
waste disposal alternative ought to be preferred. The capability of ANP to account for
interdependencies between the factors and the different importance of the factors used in
the evaluation was emphasised by several studies (Ferretti, 2011; Ferretti & Pomarico
2013a; Isalou et al., 2013; Neaupane & Piantanakulchai, 2006; Nekhay et al., 2009; Sarvar
et al., 2012). Nekhay et al. (2009) stated that ANP allowed them to model the
interdependence of the processes responsible for soil erosion and also resolved the
complexity of the physical process of soil erosion through the introduction of expertise into
the evaluation exercise. Further, Isalou et al. (2013) in their study of site selection for
landfilling municipal solid wastes acknowledged that applying the ANP model provided
the possibility of assessing effective relationships of each discrete criterion on each other
and on its overall goal in the form of network. Ferretti (2011) in her study of land
suitability assessment for siting a municipal solid waste landfill also argued that the
application of ANP allowed the dependence relationships among the criteria to be assessed,
and the relative importance of all the elements that play an influence on the final choice to
be evaluated. Therefore, ANP is a useful tool to help in making the decision/evaluation
process traceable and reliable.
The reviewed studies further indicated the ability of GIS as a veritable tool for decision
support. Babalola and Busu (2011) in their study demonstrated the efficiency of GIS in the
site selection process for landfill. The efficacy of integrating ANP and GIS has been
alluded to in the reviewed studies as giving a favourable result (e.g. Babalola & Busu,
2011; Sabri &Yaakup, 2008). Neaupane and Piantanakulchai (2006), Sarvar et al. (2012)
and Agarwal et al. (2013) acknowledged the efficiency of GIS-ANP in dealing with
(2006) in their study generated a hazard map of potentially unstable parts in lesser
Himalayas to demonstrate the successful application of the method. Sarvar et al. (2012)
specified that combining the final criteria weights using the ANP model with the GIS
capability showed proper areas for locating neighbourhood parks at districts of the city.
According to Ferretti and Pomarico (2013a) spatial ANP is a powerful tool for solving
complex problems with connections and correlations among multiple objectives as
recorded in their evaluation of land suitability for ecological connectivity. Thus, the
integration of GIS and ANP methods provides a mechanism with which complex issues
can be carefully explored and immediate feedback for decision-makers (DM) provided.
Further, other studies confirmed the ability of GIS-based ANP to be able to evaluate the
decision problem in the event of limited data; uncertainty (Neaupane & Piantanakulchai,
2006; Nekhay et al., 2007; 2009) as noted with the conventional approach by Banai (2010).
In addition, GIS-based ANP allows handling of heterogeneous information and provides a
significant contribution in the strategic decision-making phase (Ferretti & Pomarico,
2013b). The integrated approach affords the means by which to execute complex trade-offs
on multiple evaluation criteria while taking the DM’s preferences and the spatial variability
of the criteria into account (Ferretti & Pomarico, 2012). Ferretti (2011) and Ferretti and
Pomarico (2012) alluded to the suitability of the GIS-ANP method for assessing real world
problems. Through feedback enabled by the network structure of ANP, it better captures
2.3 Housing Quality
2.3.1 Introduction
This section first examines the definition of the concept of housing quality and the
measurement approaches used in evaluating housing quality. This is followed by the types
of indicators used to operationalize the concept.
2.3.2 Concept of Housing Quality
Housing quality has long been an important benchmark for measuring the condition of the
living environment of humans and how it meets their needs. Housing quality was originally
considered as one of the six housing norms including: space, tenure, structure type,
expenditure, and neighbourhood norms as identified in the housing adjustment and
adaptation theory of Morris and Winter (Morris et al., 1976, as cited in Ibem 2012; Yust,
Hadjiyanni & Ponce, 1997). Norms as put forward by the housing adjustment and
adaptation theory comprised of culturally derived criteria that households use to judge their
housing and that of others (Yust et al., 1997).
Housing quality has been interpreted in many ways. According to Lawrence (1995) the
concept is a complex one that is neither absolute nor static. As a result, it varies between
countries and among specific groups of people in each country at varying time scales. The
concept of housing quality has attracted the attention of researchers from many disciplines,
which has resulted in a wide range of contributions to the subject. Currently, there is no
universally accepted definition as the concept has been defined and interpreted variously
Aliu and Adebayo (2010) adopted a theoretical definition by considering housing quality
as a function of six latent indices, namely neighbourhood prestige, living convenience,
location, use value, structural design and mobility control. Lee and Oh (2012) defined the
scope of quality of housing as covering all areas including the characteristics of residential
service that are formed based on various elements. These elements include an indoor
residential environment, an environment of an inner complex, an environment of complex
surroundings, a service brand and other factors. Rindfuss et al. (2007) considered the
quality of housing from the health and affordability standpoint. They defined quality as
including characteristics (those required for public health, including toilet facilities,
cooking facilities, and protection from the elements) in addition to the value of housing.
Other scholars have adopted definitions that highlighted the characteristics of the dwelling
units; for example, Kurian and Thampuran (2011) argued that a good habitat requires
enough space, separate rooms for different purposes and enough privacy, good climatic
conditions such as enough sunlight, free passage of air and availability of water nearby,
good drainage and sanitary facilities. Likewise, Ibem (2012) used the concept to refer to
those highly valued attributes or defining characteristics of housing (such as durability of
construction materials, structural soundness, spatial adequacy etc.) that appeal to
occupants’ needs.
From the foregoing, it can be deduced that the definition of housing quality embraces
many factors, which include the physical condition of the building and other facilities and
services that make living in a particular area conducive (Aribigbola, 2008). In addition, it
can be observed that, housing quality as used by the different authors is a multifaceted
quantitative and qualitative aspects of residential units, their immediate surroundings, and
the needs of the occupants (Meng & Hall, 2006). Further, the concept can be seen as an
expression of an idea, which proposes that a project or development is closer to perfect or
further away from perfect (Ibem, 2012). This means that what constitutes an ideal is context
specific and varies among individuals and different socioeconomic groups. While for some
researchers, the ideal lies within existing standards and codes, for others, the ideal lies
within what users interpret as ideal (Amole, 2008).
2.3.3 Measurement of Housing Quality
Housing quality as a multi-dimensional and complex concept is difficult to define and to
measure. As a result, researchers have used different ways of measuring it. Lawrence
(1995) argued that given the wide range of contributionson the subject,there has been little
consensus about the means and measures used to assess housing quality. Lawrence (1995)
identified three approaches that focus on:
(i) the point-of-view of the individual, be it that of an architect, a building
contractor, a housing administrator, or a resident; by this approach, people are meant to
evaluate a specific residential environment using one or more sociological and/or
psychological research methods,
(ii) the material/quantifiable characteristics of housing, especially in terms of the
external appearance of residential buildings and their functional, technical and construction
components, and
(iii) the supply of housing (annual construction output), of the cost of new
residential buildings, of the rationale and outcomes of housing construction grants to public
A review of the housing quality literature indicates that two primary methodological
approaches are used in measuring housing quality: objective (quantitative) and subjective
(qualitative) approaches (see Table 2.2). The quantitative aspect of housing quality refers
primarily to the structural, material, social and economic constituents of housing products
or outcomes that can be measured and that result from the performance of the housing
sector. These factors include: price, tenure, economic impacts, environmental impacts and
structural norms of housing standards (Meng & Hall, 2006). Others include physical
characteristics, facilities and services in dwellings (Mohit, Ibrahim, & Rashid, 2010). On
the other hand, the qualitative dimension is much more subjective. It represents the
perceived meanings and values of factors such as the ‘comfort’ or ‘quality of life’ that are
afforded by different dwelling types, lifestyles, and the preferences and expectations of the
inhabitants (Meng & Hall, 2006). As a result, what is considered as perfect lies within the
purview of inhabitants. This implies that what is perceived as high quality, by one person
or group of persons may be of limited or low quality to other individuals. Therefore, this
perception is closely related to the psychosocial aspects of the resident. This approach is
therefore considered as ‘bottom-up’ approach, since the assessment is from the point of
Table 2.2: Relevant Studies on Housing Quality
Study (Year) City Approach Method and
Software Used
Data Indicators Mapped
Results
Spain, 1990 USA Objective Statistical
Annual Housing Survey data, 1983. Environmental Social Muoghalu, 1991 Benin, Nigeria. Objective Similar to Appraisal Method - assignment of penalty scores to houses that fail to meet minimum standards
Fieldwork Physical Social
Can, 1992 City of Syracuse (NY) Objective Multivariate statistics (Factor analysis) and Multicriteria analysis (Generalized Concordance-Discordance Analysis) US Census Bureau’s TIGER files and the Census of Population and Housing, 1980 Summary Tape File 1 Physical Economic Social Yes Beamish, 1994
USA Objective Stepwise Regression Census Data, 1980. Physical Social Cook and Bruin, 1994
USA Integrated Stepwise Regression National American Housing Survey (AHS), 1987. Environmental Social Fiadzo, Houston and Godwin, 2001
Ghana Objective
Cronbach’s Alpha and Factor Analysis. Core Welfare Indicators Questionnaire (CWIQ) survey of 1997. Social Physical Economic Environmental Meng and
Hall, 2006 Lima, Peru. Objective
Multicriteria Analysis- Simple Multi-attribute Analysis (MCA) Micro-level census data (households) Physical Social Economic Yes (ArcGIS) Olotuah, 2006 Oba-Ile-Nigeria.
Subjective Multiple Regression Analysis Field survey (questionnaire) Physical Environmental Rindfuss, Piotrowski, Thongthai and Prasartkul, 2007 Nang Rong District, North-East Thailand. Subjective Standardized subjective rating process (also called, Relative Housing Quality Method)
Coker, Awokola, Olomolaiye, and Booth, 2008
Ibadan Objective
American Public Health Association (APHA) Method- Penalty scoring Field survey: Housing quality Survey Form (HQSF) and Environmental Survey Form (ESF). Physical Aliu and Adebayo, 2010 Lagos State, Nigeria.
Objective Logistic Multivariate Technique Structured questionnaires Physical Environmental Aderamo and Ayobolu, 2010 Ilronin,
Nigeria. Objective Factor Analysis
Primary (structured questionnaire) and Secondary sources. Environmental Physical Economic Yes
Jiboye 2010b Osogbo, Nigeria. Subjective Descriptive statistics and Analysis of Variance (ANOVA)
Questionnaire Physical
Jiboye, 2011 Southwest Nigeria. Subjective Analysis of Variance test (ANOVA) and SPSS
Questionnaire Physical Environmental
Kurian and Thampuran, 2011
Kerala Subjective
Stepwise Multiple Regression Model and SPSS.
Survey
(questionnaire) Physical Environmental Amao, 2012 Apete- Ibadan, Nigeria. Objective Correlation Analysis Questionnaire administration and personal observation Physical Environmental Bradley and Putnick, 2012 28 Developing Countries. Objective Statistics (ANOVA) The Multiple Indicator Cluster Survey (MICS), 2005–2007 Physical Buckenberger 2012 Manukau City, Auckland Region, New Zealand. Subjective
Qualitative-Nvivo In-depth interviews and brainstorming
Physical Environmental
Ibem 2012 Nigeria Subjective
Descriptive statistics, Categorical Regression Analysis and SPSS Cross sectional Survey (structured questionnaires) Physical Environmental Management
Lee and Oh, 2012
Korea Integrated
Due to the high local and regional disparities in the quantitative and qualitative dimensions
of housing quality, it is challenging to define a standardized set of criteria and indicators
that apply equally to all areas at all times. Further, it is challenging to capture broad-based
meanings and principles of qualitative concepts such as comfort and quality of life if only
quantitative indicators are used (Meng & Hall, 2006). Currently, there are calls to integrate
both approaches.
With regard to the reviewed studies, the two major approaches (objective and subjective)
were dominant with few adopting an integrated approach (Table 2.2). Studies by Aliu and
Adebayo (2010), Amao (2012), Beamish (1994), Bradley and Putnick (2012), Can (1992),
Coker et al. (2008), Cook and Bruin (1994), Fiadzo et al. (2001), Meng and Hall (2006),
Muoghalu (1991) and Spain (1990) adopted objective approach. Aderamo and Ayobulu
(2010), Buckenberger (2012), Ibem (2012), Jiboye (2010b; 2011), Kurian and Thampuran
(2011), Olotuah (2006) and Rindfuss et al. (2007) provide examples of a subjective
approach. Cook and Bruin (1994) and Lee and Oh (2012) applied an integrated approach.
2.3.4 Types of Indicators
Housing quality is usually evaluated from the perspective of economic, social and/or
physical conditions (Francescato, Weidemann, Anderson & Chenoweth, 1979; Jiboye,
2010b). Economic criterion seeks to provide the relationship between rent and income;
physical criterion focuses on the integrity of the dwelling in terms of design, appearance
and appropriateness of fixtures; while social criterion relates to the incidences of diseases
According to Meng and Hall (2006) four criteria provide the basis for identifying indicators
to produce a meaningful housing quality index (HQI). These include objective,
scientific/technical, management, and socio-cultural criteria. Each class of criteria has its
own concerns that govern the selection of specific indicators from available data resources.
The indicators of the objective criteria should represent the local environment and must be
comprehensive enough to address problems that include poverty and inequity in the
housing sector. With regard to the scientific/technical criteria, the indicators ought to be
separable into geographically localized components and must be based on household-level
data so that they can be measured both locally and globally as well as spatially in order to
identify statistical and spatial distributions of HQI. Regarding the management criteria,
indicators should be easily obtained from available data and succeeding calculations and
must be easy to understand, and cost-effective so that the analysis of housing quality and
housing segregation can be effectively utilized by policy makers within a study area.
Lastly, the indicators of social and cultural criteria should contain the preferences and
priorities of the community in the housing programs. And that, local participants should be
able to appraise indicators selected from the above criteria to make housing enhancement
proposals acceptable relative to local norms and expectations.
Kutty (1999) stipulated that commonly used indicators of housing quality include structural
adequacy, neighbourhood quality, residents’ perception of neighbourhood safety, level of
public services provided, access to work and other amenities, room density and housing
2.3.4.1 Indicators used by Empirical Studies
As suggested above, there is little consensus about the indicators that should be used to
examine housing quality within specific cities. This has resulted in considerable variability
in the indicators that are adopted. They can broadly be grouped under four headings:
physical, environmental, social and economic criteria. Each class of criteria incorporates
variables/ indicators that are used to operationalize them.
The physical criterion of housing quality considers the quality of housing in terms of
adequacy and availability of basic housing infrastructures, suitability of the building
design, integrity of the building elements (physical sustainability) as well as that of fixtures
within the dwellings. Indicators such as the adequacy and availability of basic housing
infrastructures (internal facilities/amenities or housing services) include variables such as
the presence of water, presence of electricity, access to solid and liquid waste treatment,
type of toilet, type of kitchen etc.; suitability of the building design have aesthetics, number
of storeys; the integrity of the building elements (physical sustainability) looks at physical
quality and have variables such as material quality (type of wall materials, type of floors,
type of roof, whether walls are painted or not etc.).
The environmental criterion reflects environmental quality of neighbourhoods and takes
into account location, environmental sanitation and neighbourhood facilities (basic
infrastructures). That is, accessibility/ proximity to facilities (schools, market, banks etc.),
mode of refuse collection and frequency, external environment of house, landscape,