Threat Target Classification Using ANN and SVM Based
on a New Sensor Array System
Abdalrahman R. Al-Qubaa1, *, Abeer Al-Shiha1, and Gui Yun Tian2
Abstract—Electromagnetic imaging is based upon the fundamentals of electromagnetic (EM) fields and their relationship with the material properties under evaluation. A new system based on a Giant Magneto-Resistive (GMR) sensor array was built to capture the scattered EM signal returned by metallic objects. This paper evaluates the new system’s capabilities through the classification of metallic objects based on features extracted from their response to EM fields. A novel amplitude variation feature as well as the combinations of typical features is proposed to obtain high classification rates. The selected features of metallic objects are then applied to well-known supervised classifiers (ANN and SVM) to detect and classify ‘threat’ items. A collection of handguns with other commonly used metallic objects are tested. Promising results show that a high classification rate is achieved using the proposed new combination features and classification framework. This novel procedure has the potential to produce significant improvements in automatic weapon detection and classification.
1. INTRODUCTION
The struggle against the abuse of guns and knives is on-going, and the detection and characterisation of weapons which pose a threat to public safety is of great interest in relation to public and homeland security. Electromagnetic (EM) methods have been preferred for this purpose due to the fact that EM fields interact with various metallic objects, giving an indication of both the presence and electrical properties of the objects [1]. Systems built upon the principle of EM induction are prevalent in airports, stations and stadiums for the detection of suspicious metallic items carried by persons under interrogation. Screening procedures for the detection of concealed weapons such as handguns and explosives are common in controlled access settings, for example the entrances to sensitive buildings and at public events. Many weapon detection systems with enhancements to enable weapon classification and to discriminate threats from not-threats have been proposed [2–7]. However, metallic object classification and discrimination capabilities are still limited.
A walk-through metal detector (WTMD) is a commonly used device for detecting metallic weapons and contraband items using an electromagnetic field. WTMD technology mostly depends upon the use of a fixed threshold to distinguish between large metal masses (e.g., guns) and small ones (e.g., keys).
WTMD can be classified as signal- and image-based, and the latter is the most effective one. Several image-based systems have been proposed [8–10] using a sensor or arrays of sensors which employ an EM field and eddy current for object detection. The scanning region in these systems is excited with a magnetic field generated by one or several coils. The presence of a conductive object disturbs the stimulating field, creating an eddy current inside the object; this eddy current in turn generates a secondary magnetic field which is sensed by an array of detectors located at the borders of the scanning region. Sets of measurements are then taken and used to recover the position and shape of the object.
Received 7 May 2014, Accepted 14 September 2014, Scheduled 22 September 2014
* Corresponding author: Abdalrahman R. Al-Qubaa ([email protected]).
Generally, EM methods are sensitive to all three passive EM properties: conductivity, permittivity and permeability.
In order to reduce the incidence of false alarms, advanced signal processing algorithms have been used by researchers to support their detection systems and to analyse the magnetic field change generated when a person passes through a portal. Pattern recognition and classification techniques can be used to calculate the probability that the acquired magnetic signature correlates to a known database of weapon versus not-weapon responses. One common procedure for the detection of metallic items is to extract or generate features from the EM signal obtained to represent the possible targets of interest. Feature extraction techniques are a transformation of the input signal into a set of features. Extracting distinctive features from the EM signal is imperative for a proper classification of these signals [11].
In order to achieve effective classification, two types of features are normally required: features having physical meaning and features without physical meaning. For example, geometric features such as the shape, size and position of the pattern are considered to be features with physical meaning. Features extracted from the same signal, but based on the statistical understanding of the signal, fall into the second category [12].
After processing and extracting features, the images can be displayed for operator-assisted weapon detection or fed into a weapon detection module for automated weapon detection and classification. Commonly, a machine learning algorithm is used for automatic processing, such as an Artificial Neural Network (ANN). ANNs are widely used for metal classification [13, 14] since they need no information about the probability distribution and prior probabilities of different classes. Further, Support Vector Machines (SVM) have also recently been used for the same purposes; these represent a concept in statistics and computer science for a set of related supervised learning methods that analyse data and recognize patterns, and are used for classification and regression analysis [15, 16]. Our previous works [17, 18] revealed that the new proposed system can classify between metallic objects with an acceptable classification rate using the features extracted from the EM response signal. However, there is still a need for a more accurate feature extraction framework for automatically classifying these objects using the system.
The aim of this work is to find appropriate feature extraction methods to classify the objects using the proposed EM system with higher accuracy. Three categories of features have been investigated and extracted from the EM signal. The first is based on the shape features of an object using invariant moments [19, 20], while the second is based on the material features of an object, which are inferred from both the amplitude range [21] and principal component analysis (PCA) [22] of the EM signal. The third category applies cross correlation [23–25] upon the reconstructed EM transient response signal. These features, individually and in combination, will be anticipated as the object’s signature and are fed to an ANN and SVM classifier.
The rest of this paper is organized as follows. Section 2 explains a brief summary of the system design and principle of operation. Section 3 presents the proposed feature extraction methods. Section 4 details the specification of the used classifier technique. Feature selection methodology is presented in Section 5. The test bed setup is explained in Section 6. Section 7 details the classification results and discussion, and is followed by the conclusions and future work in Section 8.
2. ELECTROMAGNETIC IMAGING SYSTEM
1. The object under inspection is moved through the detector with data acquired at a pulse repetition rate of 500 Hz (Figure 2).
2. Sets of ten pulse responses are averaged to produce a single pulse response signal (Figure 3(a)). 3. A single value is picked from a previously computed pulse response signal (Figure 3(a)). The
maximum value of the difference signal (with and without the object) was used. 4. Each single value corresponds to a single pixel in the final image (Figure 3(b)).
In comparison with conventional induction-based WTMDs, the GMR array-based system has shown great potential in 1) Material discrimination as samples made from mixed material are clearly distinguished, whereas the induction-based WTMD can only discriminate between objects depending on the certain threshold; 2) the GMR array-based system has thus progressed the technology. 3) The proposed system is also considered a cost effective imaging system for the classification of threat objects as it depends on the EM induction phenomena with cheap sensors [26–27].
Further information is extracted by employing a form of transient analysis from the reflected signals, as described in [18]. In this technique, the pulse response from each sensor is analysed and sliced into
(a) (b)
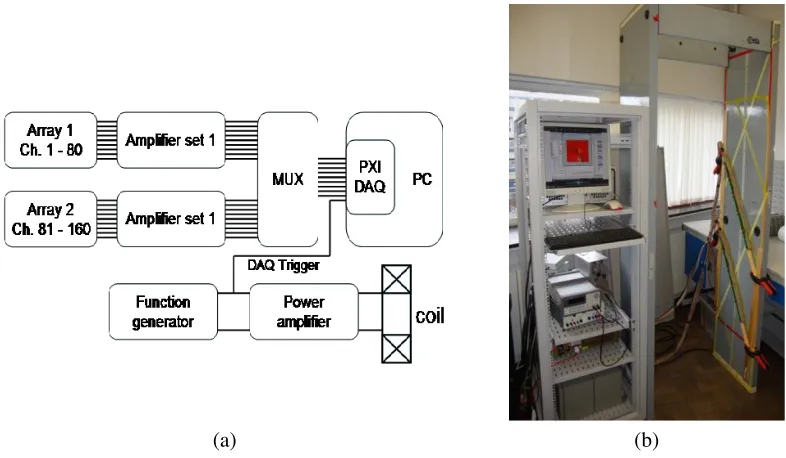
Figure 1. Proposed system, (a) block diagram, (b) system setup in the Laboratory [26].
t=0.352
20
40 -2
0 2
x 10-3 t=0.368 20 40 -4 -2 0 2 4 x 10⁻³
t=0.384 20 40 -0.01 0 0.01 t=0.4 20 40 -5 0 5 x 10⁻³
t=0.416 20 40 -0.04 -0.02 0 0.02 0.04 t=0.432 20 40 -0.1 0 0.1 t=0.448 20 40 -0.1 0 0.1 t=0.464 20 40 -0.1 0 0.1 t=0.48 20 40 -0.1 0 0.1 t=0.496 20 40 -0.1 0 0.1 t=0.512 20 40 -0.2 0 0.2 t=0.528 20 40 -0.2 0 0.2 t=0.544 20 40 -0.2 0 0.2 t=0.56 20 40 -0.2 0 0.2 (a) (b) (c)
Figure 3. EM image constructed from data acquired from line array over time: (a) A single value is computed from each pulse response; (b) Each of these single values corresponds to a single pixel in the final image [14]; (c) Result of imaging the transient response from the screwdriver sample.
sections, or time slots. The values of the EM signals for each sample in each time slot are averaged, using the data from all sensors for the whole test. Finally, an image is built up for each time slot to generate 14 sequence images. Figure 3(c) shows a sequence of these transient images for the screwdriver sample. As a result, analysis of the transient image sequence can be used to extract more information about the object under examination.
This system investigates three different sensor array configurations (2D array, vertical array and diagonal array). In this study, the outcome of a controlled diagonal array test using one sensor array with 40 GMR sensors was investigated, as shown in Figure 2. Uncontrolled investigation such as concealed and multiple object where investigated in authors work [27], the classification of the collected EM signal will be reflected in future work.
3. THE PROPOSED FEATURE EXTRACTION TECHNIQUES
In this section, the novel material features as well as the combination of typical geometrical and statistical features are employed to characterize the EM object. More details are organized as follows.
3.1. Proposed Material Features
Since the EM signal represents the EM reflection of samples sensed by a GMR sensor, this signal shows primarily the material properties of an object. The material features were deduced from the EM signal using two techniques as follows:
Maximum EM change features: Each object generates an overall EM signal amplitude variation according to the EM reflectivity of the material it is constructed from [21].
The proposed amplitude variation feature (AMPchange) is calculated as the difference between the maximum (Max(EMsignal)) and the minimum (Min(EMsignal)) values from the received signal as shown in Eq. (1):
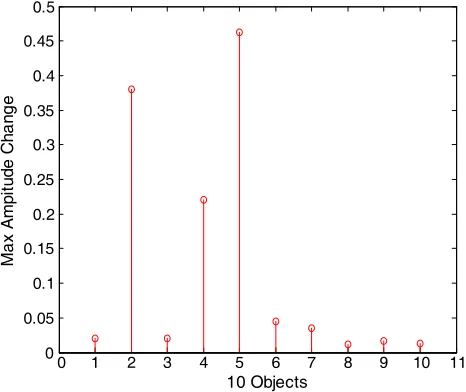
AMPchange is directly related to the EM field intensity of the object’s material. This new feature is formed in a feature vector called f-Max-Min and provided to the classifier. Figure 4 shows the max amplitude change for the samples used. Generally, the handguns have the highest amplitude change with the exception of the mobile phone, which gives a higher amplitude change than some handguns. This is because the battery cell returns a high EM response especially when it is fully charged, and so the system will give a positive false alarm when classifying the mobile phone.
PCA-Based features: PCA is a multivariate statistical analysis method which transforms data into uncorrelated eigenvectors or principal components (PCs) corresponding to the maximum variability within the data. PCA is used to optimise and reduce the amount of redundant data. PCA-based features represent signal signatures of stand-off distance to object and material properties. The detailed steps of PCA [14, 22, 23] are summarised as follows: 1) organisation of the datase; 2) calculation of the mean along each dimension; 3) calculation of the deviation; 4) finding the covariance matri; 5) finding the eigenvectors and eigenvalues of the covariance matri; 6) sorting the eigenvectors and eigenvalues; 7) computing the cumulative energy content for each eigenvector; and finally, 8) selecting a subset of the eigenvectors as the basis vectors.
In this work, the PCA is applied to each EM signal to get its eigenvector. The covariance of input data (Σx) is calculated as follows (Eq. (2)):
x
=E(x−μx)(x−μx)T
(2)
Eigenvalues λand Eigenvectors Wi are identified using covariance Σx as in Eq. (3).
(λI−Σx) = 0; (λI−Σx)Wi= 0 (3)
where, I is an identity matrix of the same order as Σx. The new features are linearly independent. The PCA technique was applied to a range of commonly used items (14 samples) in addition to the six handguns in a separate test. It was found that PCA has the potential to discriminate between the handguns and other objects, as shown in Figure 5, where objects are clearly classified into two non-overlapped clusters based on their first PCA component.
To ensure accurate classification, a third component is also used in addition to the first and second components. Therfor, as an input for the classifier, only the first three components are proposed. These three values are grouped in a feature vector namedf-PCAfor each sample and are then supplied to the classifier.
0 1 2 3 4 5 6 7 8 9 10 11 0
0.05 0.1 0.15 0.2 0.25 0.3 0.35 0.4 0.45 0.5
10 Objects
M
a
x
A
m
pi
tude
C
h
a
n
g
e
Figure 4. Max amplitude change for ten objects, six handgun samples (#1–#6) and four not-threat metallic items (#7–#10).
3.2. Proposed Shape Features
Shape is one of the most prominent features of any object. Many researchers have tackled the problem of object classification based on feature extraction using object shape with different tools such as Invariant moments, Fourier descriptors, the Hough transform and Shape matrices to extract shape characteristics [28]. TheInvariant moment’s method is widely used in weapons detection as a feature since it is rotation, scale, and translation invariant [20]. Objects can be detected with over a 90% classification accuracy after producing a set ofInvariant moments feature vectors in certain systems [29]. In [30], invariant moments was used to identify the shape of a handgun to classify objects into weapon and not-weapon objects; this study obtained an accuracy rate of up to 96%.
In this work, shape features were extracted from the EM images using Invariant moments introduced in [29]. Based on the second and third moments from the general moment (Eq. (4)), eight moments (Eq. (5)) are derived. These eight moments are grouped in a features vector calledf-Moment, which is considered a signature for each individual object based on its EM signal shape characteristics.
mfpq=
D
Ppq(x, y)f(x, y)dxdy (4)
wheremfpq is a general moment of an imagef(x, y). Parameters p,q are non-negative integers,r=p+q is called the order of the moment, and P00(x, y), P10(x, y), . . ., are polynomial basis functions defined
on D.
φ1 =m20+m02
φ2 = (m20−m02)2+ 4m211
φ3 = (m30−m02)2+ (3m221−m03)2
φ4 = (m30+m12)2+ (m21+m03)2
φ5 = (m30−3m12)(m30+m12)[(m30+m12)2−3(m21+m03)2]
+ (3m21−m03)(m21+m03)[3(m30+m12)2−(m21+m03)2]
φ6 = (m30−2m02)[(m30+m12)2−(m21+m03)2]
+ 4m11(m30−m12)(m21+m03)
φ7 = (3m21−m03)(m30+m12)[(m30+m12)2−3(m21+m03)2]
−(m30−3m12)(m21+m03)[3(m30+m12)2−(m21+m03)2]
φ8 = (m20+m02)−4m211
(5)
whereφ1, . . . , φ8, are the eight moments derived from (Eq. (4)) [29].
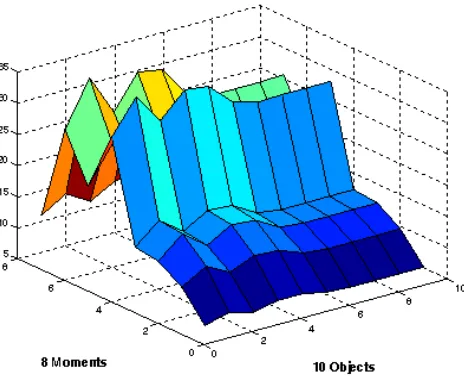
Figure 6 shows 8 moments for the 10 objects, six threat items (handguns were provided by the Police for the tests) and four metal not-threat items (mobile phone, USB, pen and belt). It can be concluded that the moments of the handgun samples are higher than other objects in this test. It is worth to mention again that the results will not be affected by object orientation as the invariant moment is rotation invariant.
3.3. Proposed Transient Analysis Features
Analysis of the transient image sequence can be used to obtain information of material properties and geometrical information about the object under examination [24]. For example, through the proposed system investigation, it has been observed that aluminium objects exhibit a tendency for their EM signature to appear later in the image sequence and to increase in intensity over time. In contrast, the EM signatures corresponding predominantly to ferromagnetic objects (such as the hunting or kitchen-knife used in our database), have a tendency to appear earlier in the sequence, peak in amplitude at a particular point and change in distribution over time.
Figure 6. Eight moments for ten different objects, six handgun samples (#1–#6) and four not-threat metallic items (#7–#10).
also been applied on EM transient response signals obtained from a series of EM signals for defect characterization [25].
In our previous work [18], a novel cross correlation technique was used to classify different objects into a number of groups: paramagnetic, ferromagnetic and combinations of both depending on the transient response features. The EM response signal was generated using transient analysis for the handguns and other commonly used objects. Cross correlation for each two successive images in this sequence is calculated using Eq. (6). Then the maximum value of each cross correlation is aggregated for all 14 image pairs to create a 13-value feature vector called f-Corr, to be used as an input for the classifier. All the phases of generating the transient analysis feature vector are shown in Figure 7.
C(u, v) =
m
i−1
m
j=1
f(xi, yj)−f¯
g
xi, yj
−¯g
m
i−1
m
j=1 f(xi, yj)−f(x, y)
2m
i−1
m
j=1 g
xi, yj
−g¯
2 (6)
where x = x+u+ dudxdx+ dudydy, y = y +v + dudxdx+ dudydy, f(x, y), g(x, y) is the pixel value at coordinate (x, y),(x, y) for the original image and second image, respectively. f andg are the average grey values, anduandvare the displacement components for the subset centres in thexandydirections, respectively.
4. FEATURE EVALUATION WITH CLASSIFICATION TECHNIQUES
Two types of classification techniques are used to evaluate all the proposed features. These techniques are: Artificial Neural Network and the Support Vector Machine.
4.1. Classification Using an Artificial Neural Network
Neural networks are widely used in pattern recognition and metal detection and classification [13, 14]. In this study, the four proposed feature vectors (f-Moment,f-Max-Min,f-PCA, and f-Corr) created in this study are used as an input to an ANN classifier, both individually and in combination strategies, to find the proper feature/features for the detection and classification of the metallic objects passed through proposed system.
Generate 14 frames EM Signal
Generate the 13-value feature vector
( f-Corr)
Cross correlation (each 2 frames)
Maximum Values 2D array
Figure 7. Generation of the transient analysis features vector steps.
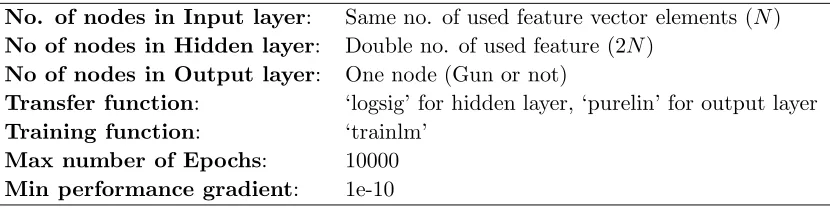
node (for our study, indicating whether it is a gun or not) with a linear activation function. The ANN classifier utilizes a training function based on LevenbergMarquardt optimisation. All ANN parameters are summarised in Table 1.
Table 1. Artificial neural network parameters (used in MATLAB).
No. of nodes in Input layer: Same no. of used feature vector elements (N)
No of nodes in Hidden layer: Double no. of used feature (2N)
No of nodes in Output layer: One node (Gun or not)
Transfer function: ‘logsig’ for hidden layer, ‘purelin’ for output layer
Training function: ‘trainlm’
Max number of Epochs: 10000
Min performance gradient: 1e-10
4.2. Classification Using the Support Vector Machine
The SVM-based classification method was applied in this work and its results were compared to the ANN result. Before the features are passed to the SVM, all the feature vectors used are normalised to the range [−1,+1] in each column. The reason for this is that the advantages of scaling avoid attributes being in greater numeric ranges which dominate those in small numeric ranges; thus, numerical difficulties during calculation are avoided. The radial basis function (RBF) was selected as a SVM kernel (K) as in Eq. (7):
K(xi, xj) = exp
−γxi−xj2
, γ >0 (7)
5. PROPOSED CLASSIFICATION FRAMEWORK
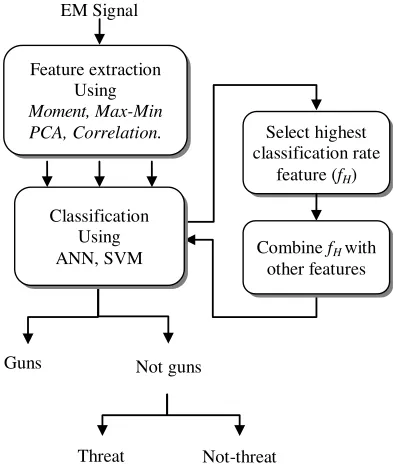
Features extracted from EM response signals were applied individually to the ANN and SVM classifiers to categorise the objects. Two object groups are tested: guns and not-guns. In the second stage, the not-guns were categorised to thethreat and not-threat items, as explained in Figure 8. Based on the initial classification results, the features with the highest classification rate (fH) were selected to be combined with other features in order to gain higher classification accuracy.
EM Signal
Feature extraction Using
Moment, Max-Min PCA, Correlation.
Guns Not guns
Select highest classification rate
feature (fH)
Combine fH with
other features
Not-threat Threat
Classification Using ANN, SVM
Figure 8. Classification methodology.
6. TESTBED SETUP
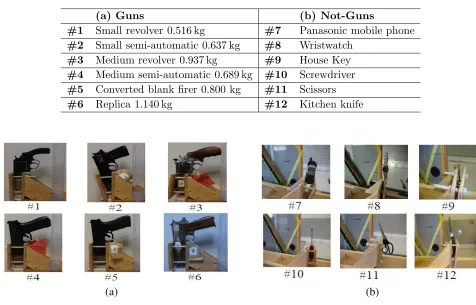
Experiments were conducted using the proposed system, with two groups of objects. The first group consisted of 12 different objects: six of these objects were handguns, while the others were daily used objects that contain metallic parts. Table 2 describes the specifications of these objects. The second group consisted of ten daily used objects, five of which contained a bulky amount of steel (e.g., knives, scissors and screwdrivers) that may be considered as a threat. The handgun samples represent the most common weapons seized by the police; of particular interest is sample #5 the blank firer, which has been converted to fire live ammunition through the welding of another barrel to the existing mechanism, and the replica handgun (sample #6), commonly used by armed robbers, as a threat. Figure 9 shows the first group of samples in the sample holder constructed for the tests, where Figure 9(a) represent the handguns samples and Figure 9(b) represents the not-guns samples.
All weapon samples’ compositions included steel, with several incorporating other materials, such as zinc alloy, aluminium, and polymers. The second group of samples is shown in Figure 10, where Figure 10(a) represents samples that are usually considered harmless (not-threat) and Figure 10(b) represents samples that are usually considered harmful (threat). Similar conditions and procedures were used to prepare the second group of samples for the classifier.
Table 2. Objects used in experimental test: (a) Guns and (b) Not-guns.
(a) Guns (b) Not-Guns
#1 Small revolver 0.516 kg #7 Panasonic mobile phone
#2 Small semi-automatic 0.637 kg #8 Wristwatch
#3 Medium revolver 0.937 kg #9 House Key
#4 Medium semi-automatic 0.689 kg #10 Screwdriver
#5 Converted blank firer 0.800 kg #11 Scissors
#6 Replica 1.140 kg #12 Kitchen knife
(a) (b)
Figure 9. Samples utilized in the test: (a) Handguns, and (b) Different common daily used items.
#1 Camera #2 House key #3 Mobile-phone
#4 Wristwatch #5 Metallic Pen
#6 Cutter-Knives #7 Kichen-Knives #8 Scissors
#9 Screwdriver #10 Spanner
(a) (b)
Figure 10. Samples utilized in the second test: (a) Not-threat, and (b) Threat items.
Figure 11. Sensitivity plot of variation in response to the six guns.
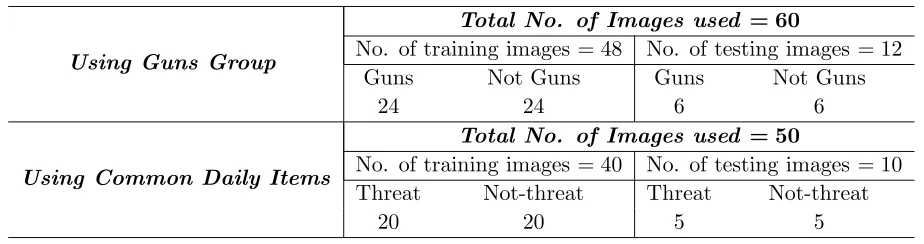
In terms of the second group, five threats and five not-threat samples were used, so 50 EM signals were generated; 40 were used for training and the rest for testing, as in Table 3.
Table 3. Data set of the work.
Using Guns Group
Total No. of Images used = 60
No. of training images = 48 No. of testing images = 12
Guns Not Guns Guns Not Guns
24 24 6 6
Using Common Daily Items
Total No. of Images used = 50
No. of training images = 40 No. of testing images = 10
Threat Not-threat Threat Not-threat
20 20 5 5
7. RESULTS AND DISCUSSION
In this section, the results of the proposed features classification frame work are presented. The results of the Guns and Not-Guns group are discussed first, followed by discussion of the results of the Threat and Not-Threat everyday objects.
7.1. First Group Classification: Guns and Not-Gun
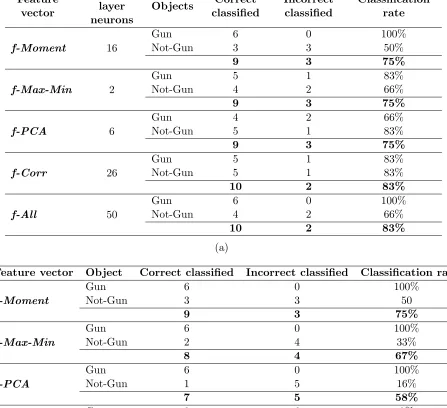
Tests were done using the first objects group; each type of feature vector was individually provided as the input for the ANN and SVM. The results are shown in Table 4. In addition to the previous four features (Section 3), another feature set, named f-All, was formed from all the individual features combined. The features were normalised before combination to avoid any misclassification results from different feature methods values. The results are also shown in Table 4. However, the f-All feature vector did not achieve a higher classification rate compared to the other individual features alone, and this is also true for the two classifiers. Taking it a step further, combinations between the highest feature result and other results are investigated to improve the classification rate.
Table 4. Results for each feature vectors: (a) Using ANN, and (b) Using SVM.
Feature vector
Hidden layer neurons
Objects Correct classified
Incorrect classified
Classification rate
f-Moment 16
Gun 6 0 100%
Not-Gun 3 3 50%
9 3 75%
f-Max-Min 2
Gun 5 1 83%
Not-Gun 4 2 66%
9 3 75%
f-PCA 6
Gun 4 2 66%
Not-Gun 5 1 83%
9 3 75%
f-Corr 26
Gun 5 1 83%
Not-Gun 5 1 83%
10 2 83%
f-All 50
Gun 6 0 100%
Not-Gun 4 2 66%
10 2 83%
(a)
Feature vector Object Correct classified Incorrect classified Classification rat
f-Moment
Gun 6 0 100%
Not-Gun 3 3 50
9 3 75%
f-Max-Min
Gun 6 0 100%
Not-Gun 2 4 33%
8 4 67%
f-PCA
Gun 6 0 100%
Not-Gun 1 5 16%
7 5 58%
f-Corr
Gun 0 6 0%
Not-Gun 6 0 100%
6 6 50%
f-Al
Gun 0 6 0%
Not-Gun 5 1 83%
5 7 42%
(b)
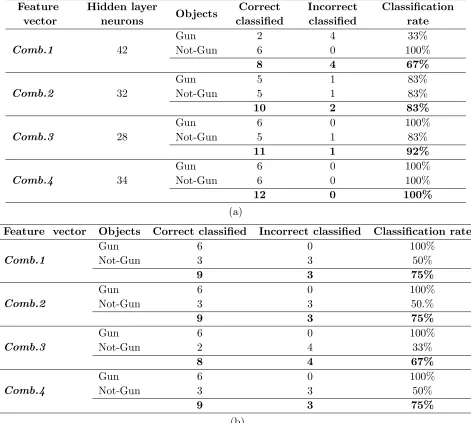
1. Comb.1: f-Corr withf-Moment features. 2. Comb.2: f-Corr with f-PCAfeatures. 3. Comb.3: f-Corr with f-Max-Min features.
Table 5. Results for different features combinations: (a) Using ANN, and (b) Using SVM.
Feature vector
Hidden layer
neurons Objects
Correct classified
Incorrect classified
Classification rate
Comb.1 42
Gun 2 4 33%
Not-Gun 6 0 100%
8 4 67%
Comb.2 32
Gun 5 1 83%
Not-Gun 5 1 83%
10 2 83%
Comb.3 28
Gun 6 0 100%
Not-Gun 5 1 83%
11 1 92%
Comb.4 34
Gun 6 0 100%
Not-Gun 6 0 100%
12 0 100%
(a)
Feature vector Objects Correct classified Incorrect classified Classification rate
Comb.1
Gun 6 0 100%
Not-Gun 3 3 50%
9 3 75%
Comb.2
Gun 6 0 100%
Not-Gun 3 3 50.%
9 3 75%
Comb.3
Gun 6 0 100%
Not-Gun 2 4 33%
8 4 67%
Comb.4
Gun 6 0 100%
Not-Gun 3 3 50%
9 3 75%
(b)
(Comb.4) was created that involves the two highest results (Comb.2 andComb.3). TheComb.4 shows a higher classification rate than any previous one. The classification rate of Comb.4 attained 100% (however, this ideal classification rate was obtained due to the limited samples). Generally, the results give an indication that the transient and material features show better results than shape features when used together for the classification of the EM signals.
A similar procedure was carried out using the SVM classifier, where the combinations between the highest classification rate and the other results are adopted, as illustrated below:
1. Comb.1: f-Moment and f-Max-Min features. 2. Comb.2: f-Moment withf-PCA features. 3. Comb.3: f-Moment withf-Corr features.
4. Comb.4: f-Moment, f-Max-Min, and f-Corr features.
60 70 80
90 100
Figure 12. Classification rate of the features extracted from the proposed system using the guns and not-guns group.
Table 6. Results of each feature vector using everyday samples: (a) Using ANN, and (b) Using SVM.
Feature vector
Hidden layer
neurons Objects
Correct classified
Incorrect classified
Classification rate
f-Moment 16
Threat 5 0 100%
Not-threat 4 1 80%
9 1 90%
f-Max-Min 2
Threat 5 0 100%
Not-threat 3 2 60%
8 2 80%
f-PCA 6
Threat 1 5 20%
Not-threat 5 0 100%
9 1 60%
f-Corr 26
Threat 5 0 100%
Not-threat 5 0 100%
10 0 100%
(a)
Feature vector Object Correct classified Incorrect classified Classification rat
f-Moment
Threat 2 3 40%
Not-threat 0 5 0%
2 8 20%
f-Max-Min
Threat 3 2 60%
Not-threat 0 5 0%
3 7 30%
f-PCA
Threat 3 2 60%
Not-threat 1 4 20%
4 6 40%
f-Corr
Threat 1 4 20%
Not-threat 5 0 100%
6 4 60%
The SVM classifier shows 0% misdetection in all combinations of features, as shown in Table 5(b). (Again, this ideal result was due to the use of limited samples).
A closer look at Table 5 shows that although both classification methods give high detection rates in terms of handgun objects in most features results, the ANN classifier shows lower false alarm rates compared to the SVM in terms of Not-Guns items. Therefore, the ANN has the better classification rate overall.
7.2. Second Group Classification: Threat and Not-threat Everyday Items
As a second stage after the handguns were detected, the everyday items group was further classified into Threat and Not-Threat items. For this purpose, the second group of objects was used. Tests were carried out using each of the types of feature vectors individually as the input for the ANN and SVM respectively. The classification results of the second group are presented in Table 6. From Table 6(a), the result of thef-Corr features reached 100% classification rate, indicating that the transient response feature through the time could be the best feature for discriminating between the everyday items using an ANN. Hence, no further combined features were investigated. Furthermore, f-Moment and f-Max-Min features had a 0% misdetection rate for the threat objects.
Also, Table 6(b) shows that, when using the SVM classifier, the transient features (f-Corr) gave the best results to classify the everyday items. However, generally the SVM classification rates are less than ANN classification rates because the SVM is more sensitive and training on these objects is not efficient due to the diversity of their size and material [33]. The classification results could be improved using a larger database size.
The classification algorithms were implemented in a MATLAB environment installed on a PC with a Core2 processor. The execution times for the sample testing were 4 sec and 0.04 sec for the ANN and LIBSVM, respectively. The time 0.04 sec delay in processing is more convenient for WTMD regarding human walking speed (about 1.5 m/sec), and will aid in the delivery of automatic results faster and easier than the flow in surveillance area. However, a 4 sec delay in processing is also acceptable and could be further squeezed when using low level languages (e.g., C language) and/or advanced processors.
8. CONCLUSIONS AND FUTURE WORK
Feature extraction techniques have been investigated to help distinguish between different metallic objects based on reflected EM signals. The feature extraction techniques consist of: shape descriptors, material properties and transient response analysis. An ANN and SVM classifier were used to classify the items based on features extracted both individually and combined. Real handguns and commonly used items were used as test samples to evaluate the features and classification methods towards building an automatic classification system.
The features extracted from the transient response showed dominant higher classification rates than shape and material features. Fusion between features also shows a promising classification rate to discriminate between the items. In terms of the classifiers used, both the ANN and the SVM are able to classify the objects with a good degree of accuracy. However, the SVM delivered more accurate detection results especially for the real handguns using the combined features, and performed at a higher speed than the ANN. The results indicate the feasibility of using these features with the machine learning techniques to automatically identify and classify threat items, using a low-cost GMR sensor array system.
In comparison with conventional induction-based WTMDs, the GMR array-based system has shown great potential in material discrimination as samples made from mixed material are clearly distinguished, whereas the induction-based WTMD can only discriminate between objects depending on the certain threshold; the GMR array-based system has thus progressed the technology. The proposed system is also considered a cost effective imaging system for the classification of threat objects as it depends on the EM induction phenomena with cheap sensors.
ACKNOWLEDGMENT
This project is funded under the Innovative Research Call in Explosives and Weapons Detection (2007), a cross-government program sponsored by a number of government departments and agencies under the CONTEST strategy. The authors would like to thank cross-government departments for joint experimental tests. The authors should also mention that this work has been published in AL-Qubaa thesis [34].
REFERENCES
1. Agurto, A., Y. Li, G. Y. Tian, N. Bowring, and S. Lockwood, “A review of concealed weapon detection and research in perspective,”Proceedings of the 2007 IEEE International Conference on Networking, Sensing and Control, 443–448, 2007.
2. Zhuge, X. and A. G. Yarovoy, “A sparse aperture MIMO-SAR-based UWB imaging system for concealed weapon detection,” IEEE Transactions on Geoscience and Remote Sensing, Vol. 49, 509–518, 2011.
3. Kapilevich, B. and M. Einat, “Detecting hidden objects on human body using active millimeter wave sensor,”IEEE Sensors Journal, Vol. 10, 1746–1652, 2010.
4. Cooper, K. B., R. J. Dengler, N. Llombart, B. Thomas, G. Chattopadhyay, and P. H. Siegel, “THz imaging radar for standoff personnel screening,” IEEE Transactions on Terahertz Science and Technology, Vol. 1, 169–182, 2011.
5. Dale, K. K., G. R. Lyle, and E. P. Robert, “Detection and classification of concealed weapons using a magnetometer-based portal,”Proc. SPIE, Sensors and Command, Control, Communications, and Intelligence (C3I) Technologies for Homeland Defense and Law Enforcement, 145–155, 2002. 6. Nelson, C. V., “Metal detection and classification technologies,” Johns Hopkins APL Technical
Digest,Vol. 24, 62–66, 2004.
7. Singh, S. and M. Singh, “Explosives detection systems (EDS) for aviation security,” An International Journal on Signal Processing, Vol. 83, 31–55, 2003.
8. Paulter, N. G., “Guide to the technologies of concealed weapon and contraband imaging and detection,” NIJ Guide 602-002001, 2001.
9. Chen, H.-M., S. Lee, R. M. Rao, M. A. Slamani, and P. K. Varshney, “Imaging for concealed weapon detection: A tutorial overview of development in imaging sensors and processing,” IEEE Signal Processing Magazine, Vol. 22, 52–61, 2005.
10. Yin, W., G. Chen, L. Chen, and B. Wang, “The design of a digital magnetic induction tomography (MIT) system for metallic object imaging based on half cycle demodulation,” IEEE Sensors Journal, Vol. 11, 2233–2240, 2011.
11. Tran, M. D. J., C. P. Lim, C. Abeynayake, and L. C. Jain, “Feature extraction and classification of metal detector signals using the wavelet transform and the fuzzy ARTMAP neural network,” Journal of Intelligent and Fuzzy Systems, Vol. 21, 89–99, 2010.
12. Gonzalez, R. C., Digital Image Processing, 2nd Edition, Prentice-Hall Inc., 2003.
13. Kr¨uger, H. and H. Ewald, “Signal processing and pattern recognition for eddy current sensors, used for effective land-mine detection,” Autonomous and Intelligent Systems, Vol. 6752, 294–302, 2011. 14. Xi, M., M. R. Azimi-Sadjadi, T. Bin, A. C. Dubey, and N. H. Witherspoon, “Detection of mines and minelike targets using principal component and neural-network methods,”IEEE Transactions on Neural Networks, Vol. 9, 454–463, 1998.
15. Fernandez, J., B. Barrowes, K. O’Neill, K. Paulsen, I. Shamatava, F. Shubitidze, and K. Sun, “Evaluation of SVM classification of metallic objects based on a magneticdipole representation,” Detection and Remediation Technologies for Mines and Minelike Targets XI, Vol. 621703, 2006. 16. Figuera, C., J. L. Rojo- ´Alvarez, M. Wilby, I. Mora-Jim´enez, and A. J. Caama˜no, “Advanced
17. Al-Qubaa, A. R. and G. Y. Tian, “Automatic threat object classification based on extracted features from electromagnetic imaging system,” 2012 IEEE International Conference on Imaging Systems and Techniques (IST), 164–169, 2012.
18. Al-Qubaa, A., G. Y. Tian, and J. Wilson, “Electromagnetic imaging system for weapon detection and classification,” Fifth International Conference on Sensor Technologies and Applications, 317– 321, France, 2011.
19. Flusser, J., T. Suk, and B. Zitov´a, Moments and Moment Invariants in Pattern Recognition, John Wiley & Sons, 2009.
20. Air Force Research Laboratory, “Final technical report: Sensor fusion algorithms and performance limits,” Available: http://www.dtic.mil/cgi-bin/GetTRDoc?AD=ADA391935, 2001.
21. Hendrik, K. and E. Hartmut, “Signal processing and pattern recognition for eddy current sensors, used for effective land-mine detection,” Proceedings of the Second International Conference on Autonomous and Intelligent Systems, 294–302, Burnaby, BC, Canada, 2011.
22. Sophian, A., G. Y. Tian, D. Taylor, and J. Rudlin, “A feature extraction technique based on principal component analysis for pulsed Eddy current NDT,” NDT and E International, Vol. 36, 37–41, 2003.
23. Turhan-Sayan, G., “Real time electromagnetic target classification using a novel feature extraction technique with PCA-based fusion,” IEEE Transactions on Antennas and Propagation, Vol. 53, 766–776, 2005.
24. Li, Y., G. Y. Tian, N. J. Bowring, and N. Rezgui, “A microwave measurement system for metallic object detection using swept frequency radar,” Proc. SPIE, 13 pages, 2008.
25. Al-Qubaa, A. R., G. Y. Tian, J. Wilson, W. L. Woo, and S. Dlay, “Feature extraction using normalized cross-correlation for pulsed eddy current thermographic images,”Measurement Science and Technology, Vol. 21, 115501–115511, 2010.
26. Tian, G. Y., A. Al-Qubaa, and J. Wilson, “Design of an electromagnetic imaging system for weapon detection based on GMR sensor arrays,”Sensors and Actuators A: Physical, Vol. 174, 75–84, 2012. 27. Al-Qubaa, A. and G. Y. Tian, “Weapon detection and classification based on time-frequency analysis of electromagnetic transient images,” International Journal on Advances in Systems and Measurements, Vol. 5, 89–99, 2012.
28. Nixon, M. and A. S. Aguado, Feature Extraction &Image Processing, 2nd Edition, Elsevier Ltd., 2008.
29. Rizon, M., H. Yazid, P. Saad, A. Shakaff, A. Saad, M. Mamat, S. Yaacob, H. Desa, and M. Karthigayan, “Object detection using geometric invariant moment,” American Journal of Applied Sciences, Vol. 2, 1876–1878, 2006.
30. Pourghassem, H., O. Sharifi-Tehrani, and M. Nejati, “A novel weapon detection algorithm in X-ray dual-energy images based on connected component analysis and shape features,” Australian Journal of Basic and Applied Sciences, Vol. 5, 300–307, 2011.
31. Hausner, J., “A radar-based concealed threat detector,” Microwave Journal, Vol. 50, 26–40, 2007. 32. Chang, C. C. and C. J. Lin, “LIBSVM: A library for support vector machines,”ACM Transactions
on Intelligent Systems and Technology, Vol. 2, 2011.
33. Arora, S., D. Bhattacharjee, M. Nasipuri, L. Malik, M. Kundu, and D. K. Basu, “Performance comparison of SVM and ANN for handwritten devnagari character recognition,” IJCSI International Journal of Computer Science Issues, Vol. 7, 1–10, 2010.
![Figure 3. EM image constructed from data acquired from line array over time: (a) A single value iscomputed from each pulse response; (b) Each of these single values corresponds to a single pixel in thefinal image [14]; (c) Result of imaging the transient response from the screwdriver sample.](https://thumb-us.123doks.com/thumbv2/123dok_us/1884708.1245804/4.612.79.554.80.326/constructed-acquired-iscomputed-corresponds-thenal-transient-response-screwdriver.webp)