R E S E A R C H
Open Access
Single channel speech separation in modulation
frequency domain based on a novel pitch range
estimation method
Azar Mahmoodzadeh
1, Hamid Reza Abutalebi
1*, Hamid Soltanian-Zadeh
2,3and Hamid Sheikhzadeh
4Abstract
Computational Auditory Scene Analysis (CASA) has been the focus in recent literature for speech separation from monaural mixtures. The performance of current CASA systems on voiced speech separation strictly depends on the robustness of the algorithm used for pitch frequency estimation. We propose a new system that estimates pitch (frequency) range of a target utterance and separates voiced portions of target speech. The algorithm, first, estimates the pitch range of target speech in each frame of data in the modulation frequency domain, and then, uses the estimated pitch range for segregating the target speech. The method of pitch range estimation is based on an onset and offset algorithm. Speech separation is performed by filtering the mixture signal with a mask extracted from the modulation spectrogram. A systematic evaluation shows that the proposed system extracts the majority of target speech signal with minimal interference and outperforms previous systems in both pitch extraction and voiced speech separation.
Keywords:acoustic frequency, modulation frequency, onset and offset algorithm, pitch range estimation, speech separation
1. Introduction
Speech separation, as a solution to the cocktail party problem, is a well-known challenge with important applications. To touch the point, consider the telecom-munication systems or the Automatic Speech Recogni-tion systems that lose performance in the presence of interfering sounds [1,2]. An effective system that segre-gates speech from interference in monaural (single-microphone) situations can be rewarding in such pro-blems. Many methods have been proposed for monaural speech enhancement; for example, see [3-7]. These methods usually assume certain statistical properties for interference and tend to lack the capacity of dealing with a variety of interferences. While the monaural speech separation works awkwardly, the human auditory system performs proficiently. The perceptual process is considered as Auditory Scene Analysis (ASA) [5]. Psy-choacoustic research in ASA has inspired considerable
work in developing Computational Auditory Scene Ana-lysis (CASA) systems for speech separation (see [6,7] for a comprehensive review).
According to Bregman [5], ASA procedure can be separated into two theoretical stages:segmentationand grouping. At the first stage, speech is transformed into a higher-dimensional space (such as a time-frequency two-dimensional representation) and then, similar time-frequency (T-F) units are segmented in order to com-pose different regions [6]. In the second stage, these regions are combined into different streams based on the relevant acoustic information. The major computa-tional goal of CASA is to separate the target speech sig-nal from the interference for different purposes, via generating a binary or a soft T-F mask, see, e.g., [8-10].
Grouping, itself, consists of simultaneous and sequen-tial organizations, which involves grouping of segments across frequency and time. The task of sequential group-ing is to group the T-F regions relative to the same sound source across time. Figure 1 illustrates this issue in which the upper panel shows T-F regions grouped into one single stream, as they are close enough in both (time
* Correspondence: [email protected]
1
Speech Processing Research Lab (SPRL), Electrical and Computer Engineering Department, Yazd University, Yazd, Iran
Full list of author information is available at the end of the article
and frequency) directions; while, the lower panel illus-trates the case of two streams of speech, grouped sepa-rately as the T-F regions are sufficiently far from each other in the frequency direction. Temporal continuity is an effective cue for grouping T-F regions neighboring in time. However, it cannot handle T-F regions that do not overlap in time due to the silence or interference seg-ments. Therefore, sequential grouping of such T-F regions is a very challenging problem (see [11,12] for more details).
Natural speech includes both voiced and unvoiced portions. Voiced portions of speech are described by periodicity(or harmonicity), which has been used as an important feature in many CASA systems for segregat-ing voiced speech (see, e.g. [13,14]). Despite considerable advances in voiced speech separation, the performance of current CASA systems is still limited by pitch fre-quency (F0) estimation errors and residual noise. Var-ious methods have been proposed for robust pitch frequency estimation, see e.g., [15,16]; however, robust pitch frequency estimation in low signal-to-noise ratio (SNR) situations still poses a significant challenge.
While mixed speech may have a great deal of overlap in the time domain, modulation frequency analysis provides an additional dimension that can present a greater degree of separation among sources. In other words, the original T-F representation obtained from transformations like Short-Time Fourier Transform (STFT) can be augmen-ted to a third dimension that represents modulation fre-quency. In [17], by assuming that the pitch frequency range is known and this range is constant in each filter channel, the modulation spectral analysis is used as a tool for producing the mask for speech separation a higher-dimensional spaces.
Based on the above observations, we propose a new system for single channel separation of voiced speech based on the modulation filtering. The idea is that, first, the target pitch (frequency) range is estimated in the modulation frequency domain, and then, this range is used for producing the proper mask for speech separa-tion. Because of the following reasons provided in [18], modulation analysis and filtering are applied for the
target speech separation problem. First, there is a gen-eral belief stating that the human ASA system processes the sounds in the modulation frequency domain. Sec-ond, the energy from two co-channel talkers is largely non-overlapping in the modulation frequency domain. The method of modulation analysis and filtering has extensively been studied by many researchers in the field of single channel speech separation; Reference [19] provides a general discussion on this subject.
At first, the proposed system performs a multipitch range estimation of target and interference speech based on the segmentation of modulation spectrogram domain. The segmentation is done using an onset and offset algorithm similar to that proposed by Hu and Wang [20]. In the proposed method, the noisy signal is divided into 200 ms time frames and then, the proposed speech separation algorithm is applied to each individual frame. Pitch range estimation method works in three stages: the first stage computes the modulation spectro-gram; the second stage decomposes the modulation spectrogram into segments using an onset and offset algorithm. In this stage, at first, the peaks and valleys of derivative smoothed intensity of modulation spectro-gram are detected and marked as onset and offset candi-dates. Any onset bigger than a certain threshold is accepted for which the smallest offset between two onsets is selected. Then, onset and offset fronts are pro-duced by connecting the common onsets and offsets. Finally, the segments are formed by matching the onset and offset fronts. The third stage determines the range of pitch frequency by selecting and grouping the desired segments.
The separation part of the proposed system aims at obtaining a soft mask in the modulation spectrogram domain. By extending the soft mask suggested in [17], a soft mask is proposed whose value depends on the esti-mated pitch range in each filter channel. To determine the soft mask in each filter channel, first, we find and mutually compare the modulation spectrogram energy of target and interference in their pitch ranges estimated from the previous stage. Then, we transform the soft mask to the time domain and filter the mixture signal in order to obtain the separated target signal. Thus, a strat-egy is suggested which estimates the target pitch range, and subsequently, segregates the target signal from the interference. Finally, the separated target signal is obtained from arranging the separated signal from each frame, in a time order sequence.
This article is organized as follows. Section 2 describes the modulation frequency analysis. In Section 3, first, a brief description of the present system is given and then the details of each stage are presented. In Section 4, a quantitative measure is proposed for evaluating the perfor-mance of speech separation and it is used for systematic Time
Acoustic Freq
uency
Time Acoustic Freq
uency
Time
Aco
ust
ic
Frequency
Time
Aco
ust
ic
Frequency
B A
Figure 1Segmentation and grouping of speech projected into
evaluation of pitch range estimation and speech separa-tion. This article concludes with a discussion in Section 5.
2. Modulation frequency analysis
Decomposing a narrowband signal into a carrier and a modulator signals is an important problem in modula-tion analysis and filtering [18]. The modulator is a low-frequency signal that describes the amplitude modula-tion of the original signal; and the carrier is a narrow-band signal describing the frequency modulation of the signal. Consider a wideband discrete-time signal x(n), for whichnrepresents a discrete-time independent vari-able. The T-F transform of a signal x(n), denoted byX (m, k), is obtained using the Discrete STFT (DSTFT). X(m, k) is a T-F transformed narrowband signal (with the time indexm) coming out of thekth channel:
DSTFT{x(n)}=X(m,k)=
K−1
n=0
x(n)w(mM−n)e−j2πnk/K k= 0,. . .,K−1,
(1)
whereKis the DSTFT length (equal to the number of the filter bank channels), w(·)is the acoustic frequency analysis window with length LandM is the decimated factor. The product model of the modulator signalM(m, k) and the carrier signalC(m, k) of the signal X(m, k) in the T-F domain is defined as
X(m,k)=M(m,k) C(m,k), (2)
The modulator of the signal X(m, k) is found by applying an envelope detector to this signal, as
M(m,k)D{X(m,k)}, (3)
whereD is the operator of the envelope detector. With respect to Equation (2), the signal’s carrier is described as
C(m,k) = X(m,k)
M(m,k), (4)
A good choice for the envelope detector is the inco-herent detector, since it is able to create a modulation spectrum that has a large area covered in the modula-tion frequency domain. For the speech signal in hand, this property may be used to find the pitch frequency in the modulation frequency domain. Incoherent envelope detector is based on the Hilbert envelope (for real-valued subbands) or the magnitude operator (for com-plex-valued subbands) [21]. Therefore, the modulator of the complex signalX(m, k) is defined as
M(m,k)=|X(m,k)|, (5)
The theory of modulation frequency analysis and fil-tering is best explained through the definition of modu-lation transforms, which are signal transformations
defined based on the Fourier transform (FT) and the STFT. The discrete short-time modulation transform of the signalx(n) is defined as
X(k,i)= DFT{D{DSTFT{x(n)}}}
= I−1
m=0
M(m,k)e−j2πmi/I i= 0,. . .,I−1, (6)
whereIis the DFT length andiis the modulation fre-quency index. The modulation transform consists of a filter-bank that uses the DSTFT followed by a subband envelope detector and, then, a frequency analyzer of the subband envelopes (the DFT) [18].
The modulation spectrogram intensity, defined as
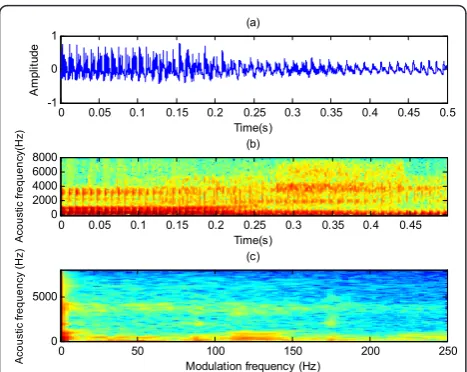
X(k,i) =X(k,i), is generally sketched in a diagram, in which the vertical axis displays the regular acoustic fre-quency indexkand the horizontal axis is the modulation frequency indexi. The modulation analysis framework is described in Figure 2. A typical example of modulation transform is illustrated in Figure 3, in which, Figure 3a shows the mixture of a target and interfering male speak-ers and Figure 3b, c, respectively, depict the correspond-ing T-F representation and modulation spectrogram, with the overall SNR of 0 dB.
3. System description
The main target of the current system is to produce a soft mask for single channel speech separation in the modula-tion spectrogram domain. In the proposed system, deter-mining the pitch range of target and interference speech is necessary for producing the mask for speech separation. The value of this mask in each subband depends on the obtained pitch range of target and interference in that
i (Modulation Frequency) m (Time)
k (
A
cou
st
ic
F
re
que
nc
y)
2m 2m+1
Base Transform
2nd T
ra
ns
fo
rm on
|X
(k
,i)
|
Figure 2 The modulation analysis framework and the
subband. When the modulation spectrogram of the speech signal is computed, the pitch ranges of target and interfer-ence speakers are determined and, then, a proper mask is calculated for the speech separation. The overall stages of our system are shown in Figure 4.
To determine the mentioned pitch ranges, our pro-posed method uses an onset and offset detection algo-rithm [20] to find the distribution of modulation spectrogram energy in the modulation frequency domain, which is an important feature for determining the pitch range. When modulation spectrogram energy is found, the modulation spectrogram is segmented, as described in Section 3.2.2. Then, the resulting segments are grouped in order to estimate the pitch range of each speaker. A detailed description of stages is as follows.
3.1. T-F decomposition and modulation transform
At the T-F stage, the STFT (as a uniform filter-bank) is used for decomposing a broadband signal into narrow-band subnarrow-band signals. The output of the T-F stage
enters into the modulation transform stage in order to calculate the modulation spectrogram.
3.2. Pitch range estimation in modulation frequency domain
The pitch frequencies of target and interference speak-ers are both time-varying. Occasionally, pitch frequen-cies of the target and interference speakers are too close to each other, in which this fact causes undesired errors in multipitch tracking algorithms and decreases the accuracy of speech separation methods. The algorithm of this article estimates the pitch range of target and interference speakers of noisy speech in the modulation frequency domain. Estimating the pitch range in small time-intervals (for example 200 ms) decreases the error in the pitch range estimation method.
In the pitch range estimation approach, at first, the intensity of the modulation spectrogram is smoothed over the modulation frequency, using a low-pass filter. Then, the partial derivative of the smoothed intensity over the modulation frequency is computed. By marking the peaks and valleys of the resulting signal, the onset and offset candidates are detected and the onset and off-set fronts are formed. By matching the onoff-set and offoff-set fronts, the modulation spectrogram of speech signal is segmented. The detailed description of the stages for the pitch range estimation is as follows.
3.2.1. Smoothing
Smoothing corresponds to low-pass filtering. The pro-posed system uses a low-pass filter to smooth the mod-ulation spectrogram intensity over the modmod-ulation frequency. Considering the frequency channel k, the smoothed intensity for X(k,i) is found as follows:
Xs(k,i)=X(k,i)∗gs(i), (7)
wheregs(i) is a low-pass FIR filter with a small num-ber of coefficients with pass-band [0, s] in Hz. Here,
“*” denotes the convolution operator (over the modula-tion frequency). The parameter s determines the degree of smoothing: the smaller s, the smoother
Xs(k,i) would be.
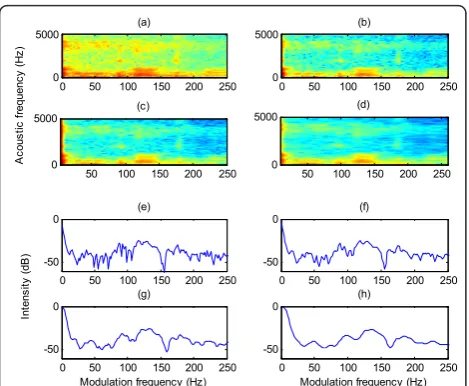
As an example, Figure 5 shows the original (Figure 5a) and the smoothed (Figure 5b-d) intensities of the modu-lation spectrum for the mixture input signal shown in Figure 3a, at three typical scales. To display more details, Figure 5e-h describes the original and the smoothed intensities at these three scales, in a single frequency channel centered at 560 Hz. The intensity fluctuation reduces by smoothing, as certified by Figure 5. Although the local details of onsets and offsets become blurred, the major intensity changes of the onsets and offsets are still preserved.
0 0.05 0.1 0.15 0.2 0.25 0.3 0.35 0.4 0.45 0.5
-1 0 1
Time(s)
A
m
plit
ud
e
(a)
Time(s)
A
co
u
st
ic
fr
eq
ue
nc
y(
Hz
)
(b)
0 0.05 0.1 0.15 0.2 0.25 0.3 0.35 0.4 0.45
0 2000 4000 6000 8000
Modulation frequency (Hz)
A
co
us
tic
fr
eq
ue
nc
y
(H
z) (c)
0 50 100 150 200 250
0 5000
Figure 3Sound mixture and its modulation spectrogram.(a)
Mixture of speech signals.(b)T-F energy plot for a mixture of two utterances of a male speaker. The utterances are“eight”and“dos.” For better display, energy is plotted as the square of the FT.(c) Modulation spectrogram of the mixture signal.
T-F Decomposition
Modulation Transform
Smoothing Onset/offset detection & matching
Decision making
Pitch frequency range
Mixture Segregatedspeech
Speech segregation
Pitch range estimation
3.2.2. Onset/offset detection and matching
Onsets and offsets correspond to sudden intensity changes. The partial derivative of smoothed modulation spectrogram intensity over the modulation frequency is obtained as
∂
∂iXs(k,i)=
∂ ∂i
X(k,i)∗gs(i)
, (8)
Peaks and valleys of the resulting signal of Equation (8) are, respectively, marked as onset and offset candi-dates. Figure 6 illustrates this procedure, in which the onset candidates with peaks bigger than a threshold θon are accepted. The peaks corresponding to the true onsets are usually significantly higher than other peaks. For this reason,θon=μ+sis selected as the threshold, in whichμ andsare the mean and standard deviation of all the onset candidates (peaks of Equation 8), respec-tively [20]. Hu and Wang [20] claim that the perfor-mance of the method using such a threshold choice is satisfactory.
In every filter channelk, to determine the offset corre-sponding to each onset candidate, let fon[k, l] represent the modulation frequency of the lth onset candidate in the filter channelk. The corresponding offset, denoted by foff[k, l], is located between fon[k, l] andfon[k, l+1]. If there are multiple offset candidates in this interval, the one with the largest intensity decrease (i.e., the smallest
∂
∂iXs(k,i)) is chosen.
After finding the onsets and offsets, those with close modulation frequencies are connected to the onset and offset fronts, because the frequency components of onsets and offsets with close modulation frequencies probably correspond to the same source. Onset and off-set fronts are vertical contours across acoustic frequency in the modulation spectrogram domain. The proposed system connects an onset candidate from a filter chan-nel to an onset candidate in the above adjacent filter channel, provided that their distance in the modulation frequency is less than a certain threshold relative to the latter filter channel. In each filter channel, this threshold is defined as the mean of the distances in the modula-tion frequency direcmodula-tion between two-by-two adjacent onsets. This definition for the threshold is provided from experiments and is validated as a good choice in the data. The same applies to the offset candidates. Notice that a threshold with a too small value may pre-vent onsets or offsets from the same epre-vent to joint; while a threshold with a too large value may cause some onsets from different events to connect together [20].
The next step is to form segments by matching indivi-dual onset and offset fronts. Consider (fon[k, lk], fon[k, lk
+1],...,fon[k+r-1,lk+r-1]) as an onset front withr consecu-tive filter channels, in whichlkdenotes the number of the selected onset as an onset front member, in the filter channelk; and consider (foff[k, lk], foff[k+1, lk+1],...,foff[k +r-1,lk+r-1]) as the corresponding offset modulation fre-quencies. For each offset modulation frequency, first, we find all those offset fronts that cross this offset; then, the offset front with the most crosses (with the offset modulation frequencies) is chosen as the matching offset
A
co
usti
c f
re
qu
en
cy
(H
z)
(a)
0 50 100 150 200 250
0 5000
(b)
0 50 100 150 200 250
0 5000
(c)
50 100 150 200 250 0
5000
(d)
50 100 150 200 250 0
5000
0 50 100 150 200 250
-50 0
In
te
ns
ity (
dB
)
(e)
0 50 100 150 200 250
-50
0 (f)
0 50 100 150 200 250
-50 0
Modulation frequency (Hz) (g)
0 50 100 150 200 250
-50 0
Modulation frequency (Hz) (h)
Figure 5Smoothed intensity values at different scales.(a)Initial
intensity for all channels.(b)Smoothed intensity at the scale 14.(c) Smoothed intensity at the scale 10.(d)Smoothed intensity at the scale 4.(e)Initial intensity in a channel centered at 560 Hz.(f) Smoothed intensity in the channel at the scale 14.(g)Smoothed intensity in the channel at the scale 10.(h)Smoothed intensity in the channel at the scale 4. The input is shown in Figure 3a.
0 50 100 150 200 250
-80 -60 -40 -20 0
In
te
ns
ity
(
dB
)
(a)
0 50 100 150 200 250
-10 -5 0 5 10
Modulation frequency (Hz)
T
he
in
te
ns
ity
d
er
iv
at
iv
e (
dB
/H
z) (b)
> , @
on
f k j fon>k j, 4@ > , 8@ on
f k j
> , @
off
f k j > , 3@
off
f k j foff>k j, 6@
Figure 6Onset and offset detection. The upper panel shows the
front. Now, the entire filter channels fromktok+r -1 occupied by the matching offset front (and their corre-sponding offset modulation frequencies on this match-ing offset front) are labeled as “matched.” If all the channels from k tok+r-1 are labeled as matched, the matching procedure finishes; otherwise, the matched channels should be put aside and the procedure should be repeated for the remaining unmatched channels.
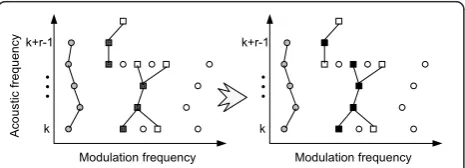
At last, in order to form the offset front relative to each onset front, we replace the offset modulation fre-quencies corresponding to the onset front with those of the matched offset fronts. The region between the onset front and its offset front yields a 2D segment in the acoustic-modulation frequency space; see Figure 7 for the schematic representation of the matching procedure. 3.2.3. Segment selection and decision-making
By detecting the onsets and offsets and forming the onset and offset fronts, the modulation spectrogram domain of speech signal is segmented. Since the speak-er’s pitch range is [60, 350] Hz (for men, women, and children), only the segments with modulation frequen-cies in this range are accepted. Now, we describe the grouping procedure for the segments.
First, the modulation spectrogram energy of each selected segment is computed. Two almost disjoint seg-ments with most energies, i.e., those with the most modulation spectrogram energies and the least horizon-tal overlap in the modulation spectrogram, for simplicity called segments A and B, are selected (the case “speech interfered by a non-speaker-noise” has only one such segment). For any other segment (call segment C), if the modulation frequency range at least 80% overlaps with that of segment A or segment B, the segment C is grouped with that overlapping segment; otherwise, the segment C is omitted for the grouping procedure. Figure 8 presents a typical example of the grouping procedure. As shown, in each filter channel, the onset and offset fronts of the resulting group determines the correspond-ing range of pitch frequency in that filter channel.
3.3. Speech separation
In [17], a mask is presented for speech separation in the modulation spectrogram domain, assuming that the pitch ranges of the target and interference are known and that these ranges are the same in each subband. Our system extends this idea by allowing the value of the mask in each filter channel to depend on the esti-mated pitch range of that filter channel.
Consider a given signalx(n) that is the sum of a target signalxts(n) and an interference signalxis(n), sampled at fsHz, i.e.,x(n) = xts(n)+xis(n). A proper mask should be estimated for segregating the target signal from the interference signal. In each filter channel k, the pitch ranges of the target and interfering speakers (obtained
from the previous stage) are denoted by
PFkts:= [pftsk,low,pftsk,high] and PFisk:= [pfisk,low,pfisk,high],
respectively. Also,
Qk:=
i∈ {0,. . .,I−1} such thati.fs (I.M)∈PFk
is defined as the set of modulation frequency indices of PFk, i.e., a pitch range in the filter channelk.
To produce a frequency mask in each filter channelk, define the mean of the modulation spectral energy rela-tive to a pitch range as the energy normalized by the wideness of that pitch range:
Ek= ⎛
⎝
i∈Qk
X(k,i)2
⎞ ⎠
(pfhighk −pflowk ) (9)
The frequency mask is calculated, when the means of the modulation spectral energy of the target and inter-ference speakers are compared in the following sense.
Fk= Ekt s Ekt s+Eki s
, (10)
Since there are artifacts associated with applying masks in the modulation frequency domain (see [22]), this domain is not preferable for modulation filtering in order to mask out the interference and reconstruct a time-domain signal. Instead, the frequency mask is transformed to the time domain. To this end, a filter k
k+r-1
#
Ac
o
ustic
frequ
ency
Modulation frequency
k k+r-1
#
Modulation frequency
Onset front member Matching offset front member
Onset Offset Corresponding
offset
Figure 7Schematic representation of the matching procedure;
(a) the offsets corresponding to the onset front is determined, (b) the matching offset front members are found.
Modulation Frequency
A
cous
tic F
requency
Modulation Frequency
A
cous
tic F
requency
group A group A group B
(a) (b)
Figure 8A graphical expression of the method of grouping
with linear phaseis constructed whose magnitude is Fk and the assigned linear phase is jk(i) = i. Then, the inverse DFT is taken
fk(m) = 1
I I−1
i=0
Fkejφk(i)ej2πmi/I. (11)
The separated target signal is estimated by the convo-lution (over the variablem) of the obtained filterfk(m) with the modulator signal of the mixture signalx(n) and then, multiplying by the carrier signal of the mixture signal
˜
X(m,k)=
M(m,k)∗fk(m)
C(m,k), (12)
Finally, the separated target signal in the time domain is obtained by taking the inverse STFT of X˜(m,k).
4. Evaluation
As mentioned earlier, our system estimates the pitch range and uses this range for the speech separation. In this section, we evaluate the proposed system in the processes of pitch range estimation and speech separation.
4.1. Pitch range estimation
First, the proposed system is evaluated in the pitch range estimation process with utterances chosen from the Lee’s database [23] and a corpus of 100 mixtures of speech and interference [24], commonly used for CASA research, see, e.g., [13,25,26]. The corpus contains ances from both male and female speakers. These utter-ances are mixed with a set of intrusions at different SNR levels. These intrusions are N0: 1 kHz pure tone; N1: white noise; N2: noise bursts; N3: cocktail party noise; N4: rock music; N5: siren, N6: trill telephone; N7: female speech; N8: male speech; and N9: female speech. These intrusions have a considerable variety; for exam-ple, N3 is noise-like, while N5 contains strong harmonic sounds. They form a realistic corpus for evaluating the capacity of a CASA system when it deals with various types of interference.
The signalX(k, i) is the modulation spectrogram of an input signal that is digitized at a 16-kHz sampling rate. The parameters of the proposed system are set to M= 16 andK= 128.w(n) is a Hanning window with length L = 64 (refer to Section 2). The STFT filter-bank has 128 filter channels, for which the center frequency of thekth filter channel isωk= 2πk/K, k = 0,...,K-1.
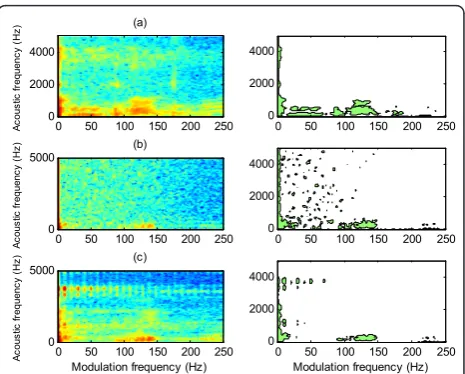
Figure 9 shows the modulation spectrogram and the obtained segments for a typical speech frame, when the proposed system is applied. The speech signal is a mix-ture of target and interference with the overall SNR of 0 dB. We select a male speech, a white noise and a trill
telephone as the interference. The results show that although the powers of the speech and interference sig-nals are equal, the proposed method is still able to esti-mate the pitch range of the target speaker with a reasonable accuracy.
Figure 10 shows the average error percentage of the pitch range estimation by the proposed system on the above mixtures at different SNR levels. To determine the error percentage, we assign a two-element vector to the margins of each pitch range and find the root mean square error distance between the vectors corresponding to the true and estimated pitch ranges. As shown in Fig-ure 10, the proposed system is able to estimate 79.9% of the target pitch range, even at -5 dB SNR. The estima-tion rate increases to about 96.1%, as the SNR increases to 15 dB.
A
co
us
tic
fr
equen
cy
(
H
z) (a)
0 50 100 150 200 250
0 2000 4000
0 50 100 150 200 250
0 2000 4000
A
co
ust
ic f
re
qu
en
cy (
H
z) (b)
0 50 100 150 200 250
0 5000
0 50 100 150 200 250
0 2000 4000
Modulation frequency (Hz)
A
co
ust
ic f
re
qu
en
cy (
H
z) (c)
0 50 100 150 200 250
0 5000
Modulation frequency (Hz)
0 50 100 150 200 250
0 2000 4000
Figure 9Modulation spectrogram and segments obtained for
a mixture of (a) male speaker, (b) white noise, and (c) trill telephone. The input is shown in Figure 3a.
-5 0 5 10 15
0 5 10 15 20 25 30 35 40
Mixture SNR (dB)
P
er
cent
age
of
er
ror
det
ec
tion
LSH model RAPT MAP
Proposed algorithm
Figure 10 Percentage of pitch range estimation error for
A reliable evaluation of the proposed system requires a reference range of the true pitch. However, such a reference is probably impossible to obtain from a noisy speech. We find the reference pitch range by framing the clean speech signal and calculating the pitch fre-quency in each frame.
The performance of the proposed method is compared with that of the Least Square Harmonic (LSH) techni-que [27], Robust Algorithm for Pitch Tracking (RAPT) [28], and the Maximum A Posterior (MAP) estimator [29]. RAPT and MAP are two standard pitch estimation algorithms. The LSH algorithm, derived in [27] for har-monic decomposition of a time-varying signal, estimates the harmonic amplitudes and phases, by solving a set of linear equations that minimizes the mean square error. The RAPT algorithm estimates the pitch frequency, by searching for local maxima in the autocorrelation func-tion of the windowed speech signal and then, using a dynamic programming technique (see [28] for more details). The MAP approach [29] considers a harmonic model for the voiced speech so that each windowed sig-nal is expressed with a generalized linear model whose basic functions depend on the fundamental frequency and number of harmonic partials.
Figure 10 also provides a comparison between the results of the pitch estimation using the mentioned four methods, in which the proposed system performs con-sistently better than the three standard methods, at all SNR levels. Although the performance of the LSH model (as the best performing one among the men-tioned standard algorithms) is good at SNR levels above 10 dB, it drops quickly as SNR decreases, which shows that the proposed system is more robust to interference compared with the LSH model.
As mentioned in [29], MAP performs slightly better in low SNR’s rather than high SNR’s. In addition, RAPT fails to estimate the desired pitch period in low SNR’s, because it mistakenly chooses sub-harmonic and harmo-nic partials instead of the true pitch period. The current scheme performs almost consistently in both high and low SNR’s.
4.2. Voiced speech separation
A corpus of 100 mixtures composed of 10 target utter-ances mixed with 10 intrusions is recruited for assessing the performance of the system on voiced speech separa-tion; these data are described in Section 4. 1. For com-parison, the Hu and Wang system [14] and the spectral subtraction method [30] are employed. Performance of the voiced speech separation is evaluated using two measures commonly used for this propose [14]:
•The percentage of energy loss,PEL, which measures the amount of the target speech excluded from the seg-regated speech.
•The percentage of residual noise, PNR, which mea-sures the amount of the intrusion included in the segre-gated speech.
PELand PNRare error measures of a separation sys-tem, which are complementary indices for assessing the system performance. In addition, the SNR of the segre-gated voiced target (in dB) provides a good comparison between waveforms [14]:
SNR= 10log10
ns2(n)
n
s(n)− ˜x(n)2, (13)
where x˜(n) is the estimated signal and s(n) is the tar-get signal before being mixed with the intrusion.
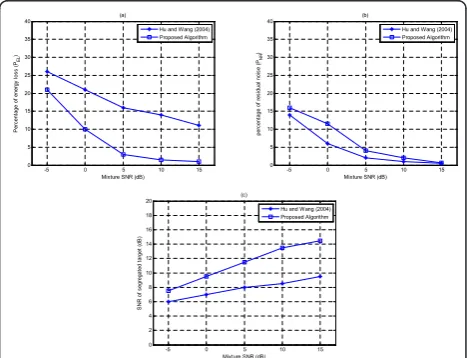
The results of our system are shown in Figure 11. Each point in the figures represents the average value of 100 mixtures in the complete test corpus at a particular SNR level. Figure 11a, b shows the percentage of energy loss and noise residue. Since the goal here is to segre-gate the voiced target, the PELvalues are only defined for the target energy at the voiced frames of the target.
As shown in Figure 11, the proposed system segre-gates 78.9% of the voiced target energy at -5 dB SNR and 99% at 15 dB SNR. At the same time, at -5 dB, 15.9% of the segregated energy belongs to intrusion. This number drops to 0.7% at 15 dB SNR. Figure 11c shows the SNR of the segregated target. This system obtains an average 7.5 dB gain in SNR when the mixture SNR is -5 dB. This gain increases to 14.3 dB, when the mixture SNR is 15 dB. As shown in the figure, the seg-regated target loses more target energy (Figure 11a), but contains less interference as well (Figure 11b).
Figure 11 also shows the performance of the system proposed by Hu and Wang for voiced speech separation
-5 0 5 10 15 0
5 10 15 20 25 30 35 40
Mixture SNR (dB)
P
er
cent
ag
e of
e
ner
gy
los
s (
PEL
)
(a)
Hu and Wang (2004) Proposed Algorithm
-5 0 5 10 15 0
5 10 15 20 25 30 35 40
Mixture SNR (dB)
per
ce
nt
age
of
r
es
idua
l noi
se
(
PNR
)
(b)
Hu and Wang (2004) Proposed Algorithm
-5 0 5 10 15 0
2 4 6 8 10 12 14 16 18 20
Mixture SNR (dB)
S
N
R
of
s
egr
eg
at
ed
tar
get
(
dB
)
(c)
Hu and Wang (2004) Proposed Algorithm
Figure 11Results of voiced speech separation.(a)Percentage of
[14], which is a representative of CASA systems. As shown in the figure, the Hu and Wang’s system yields a lower percentage of noise residues (Figure 11b), but has a much higher percentage of target energy loss (Figure 11a, c). Nevertheless, it should be noted that our system significantly improved the PEL(in Figure 11a, see, e.g., by around 11 and 10% improvement at 0 and 15 dB, respectively), which leads to much less signal distortion. The price paid for this is a slightly increase inPNR, as depicted in Figure 11b (e.g., by around 6 and 0.5% increase at 0 and 15 dB, respectively).
The average SNR for each intrusion is shown for the proposed system in Figure 12 in comparison with that of the original mixtures, Hu and Wang’s system, and a Spectral Subtraction Method, which is a standard method for speech enhancement [30] (see also [14]). The proposed system performs consistently better than Hu and Wang’s system and spectral subtraction. In average, the proposed system obtains a 16.85 dB SNR gain, which is about 1.92 dB better than Hu and Wang’s system and 8.4 dB better than the Spectral Subtraction.
To help the reader recognize the real difference in the performance, a file is prepared including sample audio mixture signals (target speech signal + interference sig-nal) and the results of the separation using the Spectral Subtraction, Hu and Wang, and the proposed systems. The file is available at http://ee.yazduni.ac.ir/sprl/ASP-AM-SampleWaves.ppt.
5. Discussions and conclusions
One of the major challenges in speech enhancement is the separation of a target speech from an interference signal of the same type. The accuracy of the CASA methods in single channel speech separation depends on the correctness of the pitch frequency estimation of
two simultaneous speakers because the proper mask in the T-F domain for the speech separation is produced in association with the estimated pitch frequency.
In this article, a single channel speech separation sys-tem is proposed that estimates the pitch range of one or two speakers and segregates the target speech from the interference. The pitch range is estimated using the onset and offset algorithm considering the distribution of speaker energy in the modulation spectrogram domain. When the target and interference speakers are either male or female, the methods for pitch frequency estima-tion encounter large errors because of close pitch fre-quency values. Therefore, CASA methods that employ the pitch frequency as their main feature for speech separation face difficulties. In contrast, a main novelty of the present algorithm is the estimation of pitch range based on short time-frames of the mixture signal. The constructed mask for speech separation depends on the pitch range estimated independently in each subband. As shown by the evaluation results, major portions of the voiced target speech are separated from the interfering speech using this mask. In addition, the proposed system can separate the unvoiced portions that are quasi-peri-odic because of the proximity of voiced portions.
The proposed algorithm is robust to interference and produces good estimates of both pitch range and voiced speech, even in the presence of strong interference. Sys-tematic evaluation shows that the proposed algorithm performs significantly better than the mentioned CASA and speech enhancement systems.
Silent gaps and other interference-masked intervals are usually included in natural speech utterances. In prac-tice, the utterance across such time-intervals should be grouped. This is a sequential grouping problem [5,6] whose segments or masks can be obtained using the speech recognition in a top-down manner (also, limited to non-speech interference) [11] or the speaker recogni-tion trained by speaker models [31]. However, the pro-posed algorithm does not encounter this problem of sequential grouping because it operates in the modula-tion spectrogram domain.
In terms of computational complexity, the main cost of the proposed algorithm arises from determining seg-ments in modulation spectrogram for pitch range esti-mation. The estimation of the mask and convolution for speech separation consumes a small fraction of the over-all cost. Both tasks (pitch range estimation and speech separation) are implemented in the frequency domain, so the computational complexity is O(NlogN), whereN is the number of samples in the input signal. These operations should separately be performed for each sub-band. On the other hand, since feature extraction takes place independently in different subbands, substantial speedup can be achieved through parallel computing.
N0 N1 N2 N3 N4 N5 N6 N7 N8 N9
-5 0 5 10 15 20 25 30
Intrusion type
S
NR (dB
)
Mixture Proposed Algorithm Hu and Wang (2004) Spectral Subtraction
Figure 12 SNR results for segregated speech and original
For future work, the proposed algorithm can be improved by iterative estimation of pitch range and speech separation. The algorithm can include a specific method to jump-start the iterative process, which gives an initial estimate of both pitch range and mask with reasonable quality. In general, the performance of the algorithm depends on the initial estimate of pitch range; better initial estimates would lead to better performance. Even with a poor estimate of pitch range, which is una-voidable in very low SNR conditions, the proposed algo-rithm improves the initial estimate during the iterative process.
Author details
1
Speech Processing Research Lab (SPRL), Electrical and Computer Engineering Department, Yazd University, Yazd, Iran2Control and Intelligent
Processing Center of Excellence (CIPCE), School of Electrical and Computer Engineering, University of Tehran, Tehran, Iran3Image Analysis Laboratory,
Department of Radiology, Henry Ford Health System, Detroit, MI, USA
4Electrical Engineering Department, Amirkabir University of Technology,
Tehran, Iran
Competing interests
The authors declare that they have no competing interests.
Received: 7 May 2011 Accepted: 17 March 2012 Published: 17 March 2012
References
1. RP Lippmann, Speech recognition by machines and humans. Speech Commun.22, 1–16 (1997). doi:10.1016/S0167-6393(97)00021-6 2. JJ Sroka, LD Braida, Human and machine consonant recognition. Speech
Commun.45, 410–423 (2005)
3. A de Cheveigne, inComputational Auditory Scene Analysis: Principles, Algorithms, and Applications, ed. by Brown GJ, Wang DL (Wiley & IEEE, Hoboken, NJ, 2006), pp. 45–79
4. S Dubnov, J Tabrikian, M Arnon-Targan, Speech source separation in convolutive environments using space-time-frequency analysis. EURASIP J Appl Signal Process Article 38412.2006, 11 (2006)
5. AS Bregman,Auditory Scene Analysis(MIT, Cambridge, MA, 1990) 6. Brown GJ, Wang DL (eds.),Computational Auditory Scene Analysis: Principles,
Algorithms, and Applications(Wiley & IEEE, Hoboken, NJ, 2006)
7. M Buchler, S Allegro, S Launer, N Dillier, Sound classification in hearing aids inspired by auditory scene analysis. EURASIP J Appl Signal Process.18, 2991–3002 (2005)
8. G Hu, D Wang, A Tandem algorithm for pitch estimation and voiced speech segregation. IEEE Trans Audio Speech Lang Process.18(8), 2067–2079 (2007)
9. Y Shao, S Srinivasan, Z Jin, D Wang, A computational auditory scene analysis system for speech segregation and robust speech recognition. Comput Speech Lang.24, 77–93 (2010). doi:10.1016/j.csl.2008.03.004 10. MH Radfar, RM Dansereau, A Sayadiyan, A maximum likelihood estimation
of vocal-tract-related filter characteristics for single channel speech separation. EURASIP J Audio Speech Music Process Article 84186,2007, 15 (2007)
11. J Barker, M Cooke, D Ellis, Decoding speech in the presence of other sources. Speech Commun.45, 5–25 (2005). doi:10.1016/j.
specom.2004.05.002
12. Y Shao, DL Wang, Model-based sequential organization in cochannel speech. IEEE Trans Acoust Speech Signal Process.14, 289–298 (2005) 13. GJ Brown, M Cooke, Computational auditory scene analysis. Comput
Speech Lang.8, 297–336 (1994). doi:10.1006/csla.1994.1016
14. G Hu, DL Wang, Monaural speech separation based on pitch tracking and amplitude modulation. IEEE Trans Neural Net.15, 1135–1150 (2004). doi:10.1109/TNN.2004.832812
15. M Wu, DL Wang, GJ Brown, A multipitch tracking algorithm for noisy speech. IEEE Trans Speech Audio Process.11, 229–241 (2003). doi:10.1109/ TSA.2003.811539
16. J Le Roux, H Kameoka, N Ono, A de Cheveigne, S Sagayama, Single and multiple F0 contour estimation through parametric spectrogram modeling of speech in noisy environments. IEEE Trans Audio Speech Lang Process.
15, 1135–1145 (2007)
17. SM Schimmel, LE Atlas, K Nie, Feasibility of single channel speaker separation based on modulation frequency analysis, inProc IEEE International Conference on Acoustics, Speech and Signal Processing, Hawaii, USA.4, 605–608 (2007)
18. SM Schimmel, (Dissertation, University of Washington, 2007)
19. L Atlas, SA Shamma, Joint acoustic and modulation frequency. EURASIP J Appl Signal Process.2003(7), 668–675 (2003). doi:10.1155/
S1110865703305013
20. G Hu, DL Wang, Auditory segmentation based on onset and offset analysis. IEEE Trans Audio Speech Lang Process.15(2), 396–405 (2007)
21. R Drullman, JM Festen, R Plomp, Effect of temporal envelope smearing on speech reception. J Acoust Soc Am.95, 1053–1064 (1994). doi:10.1121/ 1.408467
22. SM Schimmel, LE Atlas, Coherent envelope detection for modulation filtering of speech, inProc IEEE International Conference on Acoustics, Speech and Signal Processing, Pennsylvania, USA, 221–224 (2005)
23. TW Lee, Blind source separation: audio examples (1998). http://www.snl.salk. edu/~tewon/Blind/blind_audio.html. Accessed 4 May 2011
24. MP Cooke,Modeling Auditory Processing and Organization(Cambridge University Press, Cambridge, 1993)
25. LA Drake, (Dissertation, University of Northwestern, 2001)
26. DL Wang, GJ Brown, Separation of speech from interfering sounds based on oscillatory correlation. IEEE Trans Neural Netw.10, 684–697 (1999). doi:10.1109/72.761727
27. Q Li, L Atlas, Time-variant least-squares harmonic modeling, inProc IEEE International Conference on Acoustics, Speech and Signal Processing, Hong Kong.2, 41–44 (2003)
28. D Talkin, A robust algorithm for pitch tracking (RAPT), inSpeech Coding and Synthesis, ed. by Paliwal KK, Klein WB (Elsevier, NewYork, NY, 1995), pp. 495–518
29. J Tabrikian, S Dubnov, Y Dickalov, Maximum a posterior probability pitch tracking in noisy environments using harmonic model. IEEE Trans Speech Audio Process.12, 76–87 (2004). doi:10.1109/TSA.2003.819950
30. X Huang, A Acero, HW Hon,Spoken Language Processing: A Guide to Theory, Algorithms, and System Development(Prentice Hall PTR, Upper Saddle River, NJ, 2001)
31. Y Shao, (Dissertation, University of Ohio State, 2007)
doi:10.1186/1687-6180-2012-67
Cite this article as:Mahmoodzadehet al.:Single channel speech separation in modulation frequency domain based on a novel pitch range estimation method.EURASIP Journal on Advances in Signal Processing20122012:67.
Submit your manuscript to a
journal and benefi t from:
7Convenient online submission
7Rigorous peer review
7Immediate publication on acceptance
7Open access: articles freely available online
7High visibility within the fi eld
7Retaining the copyright to your article
![Figure 1 Segmentation and grouping of speech projected intoT-F cells in a 2D representation [6].](https://thumb-us.123doks.com/thumbv2/123dok_us/1141781.1143248/2.595.56.290.89.183/figure-segmentation-grouping-speech-projected-intot-cells-representation.webp)
![Figure 2 The modulation analysis framework and themodulation spectrogram [19].](https://thumb-us.123doks.com/thumbv2/123dok_us/1141781.1143248/3.595.305.538.502.698/figure-modulation-analysis-framework-themodulation-spectrogram.webp)