DeepWAS: Multivariate genotype-phenotype associations by
directly integrating regulatory information using deep learning
Janine Arloth1,2,*, Gökcen Eraslan2,*, Till F.M. Andlauer1,3,4, Jade Martins1, Stella Iurato1, Brigitte Kühnel5,16, Melanie Waldenberger5,16,22, Josef Frank6, Ralf Gold4,7, Bernhard Hemmer3,4,8, Felix Luessi4,9, Sandra Nischwitz1,4, Friedemann Paul4,10, Heinz Wiendl4,11, Christian Gieger5,16, Stefanie Heilmann-Heimbach12, Tim Kacprowski13,21, Matthias Laudes14, Thomas Meitinger15, Annette Peters16, Rajesh Rawal17, Konstantin Strauch18, Susanne Lucae1, Bertram Müller-Myhsok1,8,23, MarcellaRietschel6, Fabian J. Theis2,19, Elisabeth B. Binder1,20, Nikola S. Mueller2,#
Affiliations:
1. Department of Translational Research in Psychiatry, Max Planck Institute of Psychiatry, Munich 80804, Germany
2. Institute of Computational Biology, Helmholtz Zentrum München, Neuherberg 85764, Germany 3. Department of Neurology, Klinikum rechts der Isar, School of Medicine, Technical University of Munich,
81675 Munich, Germany
4. German Competence Network Multiple Sclerosis (KKNMS), Klinikum rechts der Isar, Technical University of Munich, 81675 Munich, Germany
5. Research Unit of Molecular Epidemiology and Institute of Epidemiology, Helmholtz Zentrum München,
85764 Neuherberg, Germany
6. Department of Genetic Epidemiology in Psychiatry, Central Institute of Mental Health, Medical Faculty Mannheim, University of Heidelberg, Mannheim, Germany
7. Department of Neurology, St. Josef-Hospital, Ruhr-University Bochum, 44801 Bochum, Germany 8. Munich Cluster for Systems Neurology (SyNergy), 81377 Munich, Germany
9. Department of Neurology, University Medicine Mainz, Johannes Gutenberg University Mainz, 55122 Mainz, Germany
10. NeuroCure Clinical Research Center, Department of Neurology, and Experimental and Clinical Research
Center, Max Delbrück Center for Molecular Medicine, and Charité – Universitätsmedizin Berlin, 10117 Berlin, Germany
11. Department of Neurology with Institute of Translational Neurology, University of Münster, 48149 Münster,
Germany
12. Institute of Human Genetics, University Hospital Bonn and Division of Genomics, Life & Brain Research Centre, University of Bonn School of Medicine, 53113 Bonn, Germany
13. Interfaculty Institute for Genetics and Functional Genomics, University Medicine and University of Greifswald, 17489 Greifswald, Germany
14. Department I of Internal Medicine, Kiel University, 24105 Kiel, Germany
15. Institute of Human Genetics, Helmholtz Zentrum München, 85764 Neuherberg, Germany and Institute of
Human Genetics, Technical University of Munich, 81675 Munich, Germany.
16. Institute of Epidemiology, Helmholtz Zentrum München, 85764 Neuherberg, Germany
17. Institute of Epidemiology and Social Medicine, University of Münster, 48149 Münster, Germany
18. Institute of Genetic Epidemiology, Helmholtz Zentrum München, Neuherberg, Germany and Institute of
Medical Informatics, Biometry, and Epidemiology, Chair of Genetic Epidemiology, Ludwig-Maximilians -Universität, 80539 Munich, Germany
19. Department of Mathematics, Technical University of Munich, Garching 85748, Germany
20. Department of Psychiatry and Behavioral Sciences, Emory University School of Medicine, Atlanta GA 30322, USA
21. Junior Research Group on Computational Systems Medicine, Chair of Experimental Bioinformatics, TUM School of Life Sciences Weihenstephan, Technical University of Munich, 85354 Freising-Weihenstephan, Germany
22. German Centre for Cardiovascular Research (DZHK), 13316 Berlin, Germany 23. Institute of Translational Medicine, University of Liverpool, Liverpool, UK # [email protected]
* These authors contributed equally to this work. #Corresponding author
Abstract
Genome-wide association studies (GWAS) identify genetic variants associated with quantitative traits or disease. Thus, GWAS never directly link variants to regulatory mechanisms, which, in turn, are typically inferred during post-hoc analyses. In parallel, a recent deep learning-based method allows for prediction of regulatory effects per variant on currently up to 1,000 cell type-specific chromatin features. We here describe “DeepWAS”, a new approach that directly integrates predictions of these regulatory effects of single variants into a multivariate GWAS setting. As a result, single variants associated with a trait or disease are, by design, coupled to their impact on a chromatin feature in a cell type. Up to 40,000 regulatory single-nucleotide polymorphisms (SNPs) were associated with multiple sclerosis (MS, 4,888 cases and 10,395 controls), major depressive disorder (MDD, 1,475 cases and 2,144 controls), and height (5,974 individuals) to each identify 43-61 regulatory SNPs, called deepSNPs, which are shown to reach at least nominal significance in large GWAS. MS- and height-specific deepSNPs resided in active chromatin and introns, whereas MDD-specific deepSNPs located mostly to intragenic regions and repressive chromatin states. We found deepSNPs to be enriched in public or cohort-matched expression and methylation quantitative trait loci and
demonstrate the potential of the DeepWAS method to directly generate testable functional hypotheses based on genotype data alone. DeepWAS is an innovative GWAS approach with the power to identify individual SNPs in non-coding regions with gene regulatory capacity with a joint contribution to disease risk. DeepWAS is available at https://github.com/cellmapslab/DeepWAS.
Background
Genome-wide association studies (GWAS) have been highly successful in identifying genetic variants associated with risk for common diseases and traits 1. However, going from pure association to mechanistic insight has been a much more challenging task. Identification of the true causal variants in the context of a disease or trait from within regions of associated variants is hampered by linkage disequilibrium (LD), as nearby variants are likely to co-segregate in a population. The functional variants can, in most cases, not be easily discerned within long stretches of such correlated DNA, which can span several genes and include hundreds of associated variants.
Additional post-processing approaches, so called functional GWAS, have been introduced to provide missing functional annotation to classical GWAS 2. The majority of published functional GWASs are based on the positional overlap of single-nucleotide polymorphisms (SNPs) with cis-regulatory elements such as promoters and enhancers (see Tak and Farnham 3 for a comprehensive review). These functional GWASs indicate that, for common diseases, the majority of associated SNPs reside in non-coding, regulatory regions 2,4,5. One drawback of these methods is that the actual impact of each variant on regulatory elements is not assessed, as the annotation is based on positional overlap only. For example, two SNPs that localize to the same chromatin immunoprecipitation with a
predicting the degree of disruption of TF binding motifs have been used 7,8. However, our
understanding of the determinants of TF binding to known sequence motifs is still incomplete, limiting the success of such methods. Another post-processing approach to infer functional variants has been annotations that correlated SNP genotype with gene expression or DNA methylation data in the form of expression and methylation quantitative trait locus (eQTL and meQTL) analyses 9,10. Additional methods such as binding QTL (bQTL) studies for TF binding 11 or massively parallel reporter assays (MPRAs) now add experimental regulatory information on even a single variant resolution 12-14, yet need to be performed in the cell type of interest. While these approaches can indicate regulatory effects of associated SNPs, they cannot identify single functional variants within an LD block.
In classical, hypothesis-free GWAS, all variants are treated equally despite it being highly unlikely that they are all functionally relevant in every disease-associated tissue of the body. Functional and disease relevant variants may show an association strength below the significance threshold, increasing the efforts required for identifying such regulatory variants. The integration of functional knowledge regarding SNPs into GWAS has the potential to prioritize relevant variants and overcome the current hurdle in gaining mechanistic insights into effects of SNPs associated with a specific phenotype.
Recent advances in systems genetics that harness the predictive power of deep learning might enhance the performance of functional SNP prioritization methods. The deep learning method “DeepSEA” uses only DNA sequence information to predict effects on regulatory chromatin features, such as histone marks, TF binding, or the presence of open chromatin 15. For this annotation method, experimental, publicly available data from the ENCODE project 16 and the Roadmap Epigenomics Project 17 for cell type-specific TF binding, histone modifications, and chromatin states were used. This type of functional sequence annotation is superior to post-hoc, positional overlap-based methods, as it computes allele-specific differences in the effects of variants on regulatory elements and thus discerns SNPs with predicted functional impact in a given cell type from those just residing within an annotated element by chance. Importantly, the method allows for incorporating cell-type specific regulatory effects of variants at baseline as well as under experimentally challenged conditions, adding additional critical layers to understanding tissue- and context-specific disease mechanisms. This approach was further enhanced to predict tissue-specific gene expression levels and to prioritize putative causal variants associated with human traits and diseases 18. Recently, deep learning was successfully applied to predict the impact of non-coding mutations in a family with autism spectrum disorder 19 and the clinical impact of single human mutations 20. However, in all studies published to date, such deep learning-based annotations have only been applied post-hoc to association results from classical GWAS.
We present a conceptually new approach fusing classical and functional GWAS. We obtain regulatory information on SNPs by generating sets of SNPs mapped to so called “functional units” (FUs) using deep learning and then perform multivariate FU-Wide Association Studies (DeepWAS). A FU is
defined as the combination of a specific chromatin feature, a cell type, and an experimental condition. Regulatory SNPs are then grouped based on their predicted capacity to modulate a FU and are jointly subjected to multivariate association with a trait or disease using feature selection with LASSO (L1) penalization 21. The rationale of this grouping by FUs stems from the idea that as the majority of our chromatin features are TFs (85%, see Supplementary Table 1) and that one TF influences a specific cellular function through accumulation of its downstream effects via multiple SNPs on a series of loci
22. This optimized variant selection improves the power to identify sets of functional SNPs that may
play a role in the etiology of the disease, and map them directly to a specific context – i.e., cell type, transcription factor, stimulation condition. Multiple regression models are relatively new in the field of GWAS, but have already shown promising results 23-25. Of note, one of these multi-SNP approaches used pre-clustering of LD blocks prior to LASSO modeling 26.
For a proof of concept of this method, we used data from published GWASs of two common diseases, multiple sclerosis (MS) 27 and major depressive disorder (MDD) 28, as well as the quantitative trait of height 29. The heritability of MS and MDD was estimated to be 64% and 40%, respectively 30,31, comparable with other common diseases. The heritable nature of height is estimated to be between 70-90% 32. GWAS meta-analyses have already identified 180 genetic loci for height 33, 200 for MS 34, and 44 independent loci for MDD 35. We compare the results of DeepWAS in smaller samples to the results from GWAS meta-analyses of the same phenotypes. This allows to identify disease- or trait-associated FUs, generating novel supportive evidence for prior knowledge on pathophysiology. We also complement deepSNPs with QTL networks and generate novel testable hypotheses of disease mechanisms.
Results
Directly integrating regulatory information into genotype-phenotype
associations (DeepWAS approach)
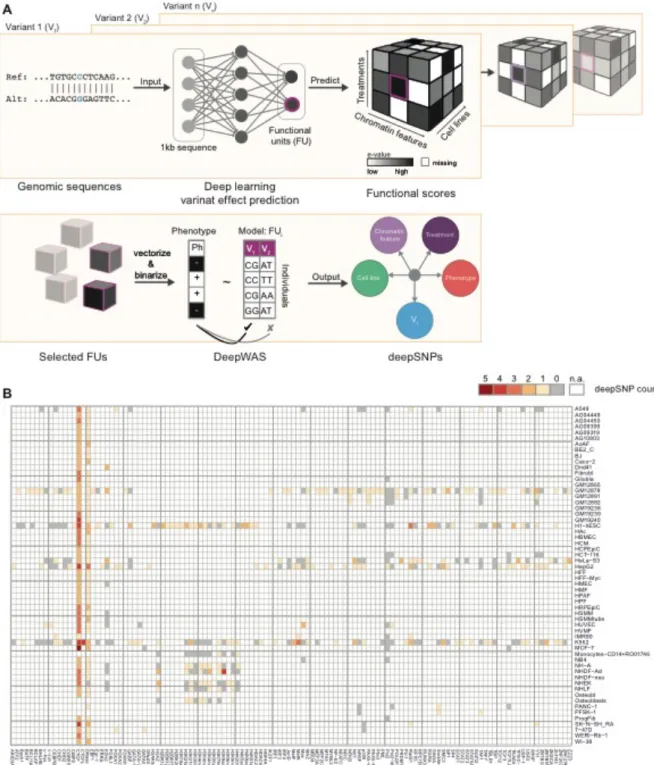
In order to integrate regulatory information into the classical GWAS approach, knowledge of regulatory information on a single SNP level is required. To retrieve a set of regulatory SNPs with effects on cell type-specific chromatin features, we employ DeepSEA variant effect predictions. We generated reference and alternative allele sequences of 1,000 bp regions centered around each GWAS SNP position (eight million SNPs) and used a pre-trained deep neural network 36 to obtain allele-specific probabilities for a genomic feature to manifest in a specific cell type under a given experimental condition (a pair of one chromatin feature in one cell type is further called “functional unit’’ (FU)). For this study, we used 919 pre-defined FUs (see Supplementary Table 1). For example, the FU “p53-baseline-HeLa” was informed by all ChIP-seq peaks of the TF p53 in baseline conditions in the HeLa cell line. We then employed the DeepSEA e-value metric that estimates the impact of a variant on the functional readout by comparing the allele-specific probabilities per variant to one million random SNPs from the 1,000 genomes project 37. Only SNPs with significant e-values (e-value<5×10⁻⁵) were thus selected as likely to be regulatory. This filtering identified 40,000 predicted regulatory SNPs, i.e., a SNP with effects in one FU. We next merged all variants that are predicted to moderate the same FU into SNP sets. To associate these regulatory SNPs with a disease or trait in a multivariate manner, we employ L1-regularized (LASSO) linear regression models including multiple SNPs using the stability selection method. From all 919 FU models, we extracted those regulatory SNPs that show significant trait association and defined them as deepSNPs (see Methods and
Figure 1). Moreover, the DeepWAS approach identifies SNP-phenotype associations directly in a
cell-type specific regulatory context.
To test this approach, we applied DeepWAS to a dataset from an adequately-powered GWAS for MS (KKNMS GWAS, 15,283 individuals from two independent MS case-control cohorts 27) and found that for 637 out of 919 FU models, associated with at least one variant (see Figure 1B). Most models identified one deepSNP per FU while 147 models identified two, three or four deepSNPs to jointly moderate a FU. In total 53 unique MS-specific deepSNPs, excluding the region encoding the major histocompatibility complex (MHC) on chromosome 6, were identified by DeepWAS. These deepSNPs moderate 120 chromatin features in 133 cell lines (see Supplementary Table 2). Note that16 out of the 53 deepSNPs were in pairwise LD with each other (r2≥0.5). 111 MS-specific deepSNPs were located in the MHC region. In addition to MS, we analyzed underpowered GWAS datasets for MDD (3,627 individuals recruited for recurrent MDD 28,38) and height (3,658 individuals of the population-based KORA cohort 39). Sixty-one MDD-specific deepSNPs in 237 FUs (Supplementary Figure 1A
and Supplementary Table 3) and 43 height-specific deepSNPs in 381 FUs (Supplementary Figure
Characterization of deepSNPs
We followed these results up by further characterizing the identified deepSNPs from the three
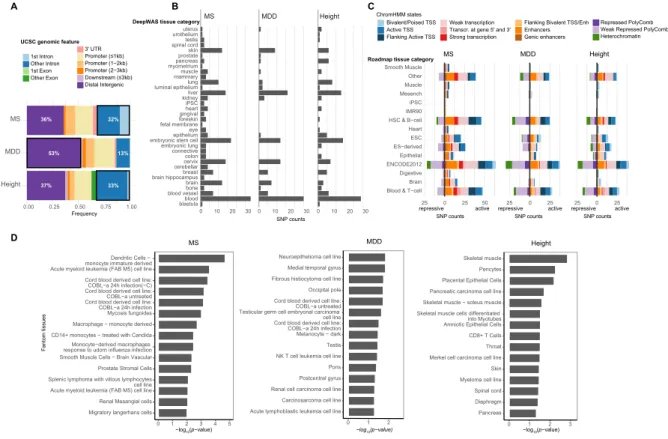
independent analyses. DeepSNPs for MS and height were more likely to be located in intronic regions (32-33% deepSNPs in first or other introns) while deepSNPs for MDD were more likely to cluster in distal intergenic regions (>3 kb=53% vs. >3 kb=36-37% for MS and height, respectively). MS- and MDD-specific deepSNPs were never found within coding regions (Figure 2A). DeepSNPs were always identified in a cell-type specific manner. We thus interrogated the cell type specificity on the level of tissue category, in order to reduce complexity (Figure 2B). Note, that tissue categories were influenced by the richness of investigated cell types per category. For example, the tissue group blood encompasses 79 cell types, while brain contained only 14 tissues. Overall, more tissue groups were identified when the number of identified deepSNPs increased. Interestingly, compared to MS and MDD, a lower number of identified deepSNPs for height were relevant in brain tissues. At the same time, a larger number of deepSNPs were active in pancreatic tissue. Notably, an association of height with pancreatic cancer has previously been shown 40.
As DeepWAS includes only a limited number of histone marks, we next overlapped deepSNPs with predicted chromatin states from the 15-state ChromHMM model 41 (Figure 2C). For both DeepWAS cell types (ENCODE) and 111 epigenomes, we used top-level tissue categories to overlap deepSNPs with chromatin state predictions in the respective matched tissue. We observed tissue and context (disease or trait) specific roles of chromatin states. Most of the MS-specific deepSNPs mapped to active chromatin states (82%, see Figure 2C). For MDD-specific deepSNPs a larger fraction overlapped with repressive marks (43%, see Figure 2C).
To investigate the tissue specificity of the genomic loci around deepSNPs and to extend the number of disease-relevant tissues, we further tested if our deepSNPs and their proxies (r2≥0.5) were enriched in the loci of tissue-specifically expressed genes by leveraging Fantom CAGE data 42. MS-specific deepSNPs were significantly enriched in the regions active in different immune cell types, height-specific deepSNPs in skeletal muscle cells, pericytes, and also pancreatic carcinoma cell line, and MDD-specific deepSNPs in neurocytoma as well as in different brain regions and immune cells (p-value≤0.05, see Figure 2D).
DeepWAS identifies GWAS loci
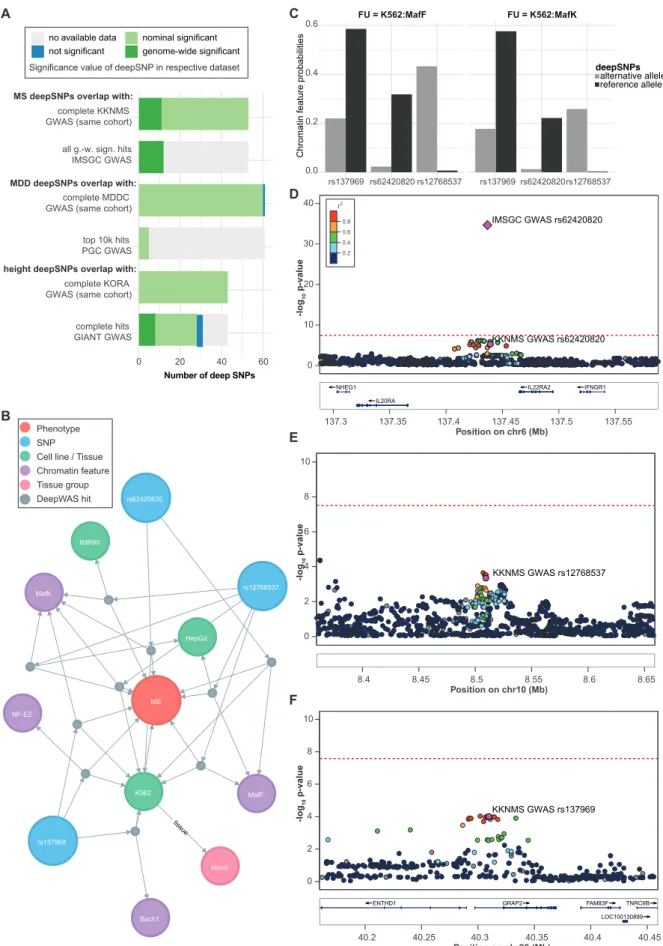
To evaluate the convergences of DeepWAS and GWAS, we evaluated how many deepSNPs map to cohort-specific results from classical GWAS and to results of larger published meta-analysis of GWAS
(Figure 3A). In the published GWAS of the KKNMS dataset used in the present study, the MHC
region as well as variants at 15 loci outside of this region were significantly associated with MS on a genome-wide level 27. When comparing KKNMS GWAS and DeepWAS results on a single SNP level, eleven of the 53 MS-specific deepSNPs or their LD proxies (r2≥0.5) mapped to eight independent loci (CLEC16A, MYO15A, PAGR1, CD58, GFI1, EVI5, and intergenic regions on chromosome 1 and 10).
The remaining deepSNPs (n=42) showed an association strength with at least nominal significance in the original GWAS with p-values all ≤5.13×10⁻⁴, but did not reach genome-wide significance. We next overlapped the deepSNPs with results from the GWAS by the International Multiple Sclerosis
Genetics Consortium (IMSGC 43) that included over 47,000 MS cases and 68,000 controls. Here, a total of 12 deepSNPs mapped to nine independent genome-wide significant loci. Eight of these 12 deepSNPs, corresponding to 8 out of 9 loci, were also genome-wide significant in the KKNMS GWAS27.
For MDD, 60 out of the 61 MDD-specific deepSNPs or their proxies (r2≥0.5) reached nominal significance in a univariate GWAS from the same cohort (MDDC n=3,627 individuals, no genome-wide significant association). Five MDD-specific deepSNPs overlapped with the top 10,000 SNPs of the recently published largest GWAS for MDD by the PGC 35 (included 135,458 MDD cases and 344,901 controls; PGC GWAS deepSNP max. p-value ≤ 3.1×10⁻⁴), which represents a 2.2 fold enrichment (permutation p-value=0.071) over randomly sampled regulatory SNP sets (n=31,929 regulatory SNPs) and their LD proxies. These five deepSNPs map to five independent loci: ZFPM2-AS1, SBK2, MTFR1, and two intergenic regions on chromosome 7 (nearby genes: WNT2 and ASZ1) and a locus on chromosome 8 (nearby genes: LINC00293 and LOC100287846).
All of the 43 height-specific deepSNPs reached nominal significance in the classical GWAS in the same cohort (KORA cohort n=3,658 individuals, no genome-wide significant association) with a max. p-value ≤7.7×10⁻³. Eight of the 43 height-specific deepSNPs mapped to seven independent genome-wide significant loci (DIS3L2, ZBTB38, LCORL, PDLIM4, ZNF311, HABP4, and PXMP4) of the latest GWAS from the GIANT Consortium, which included over 183,727 individuals 33.
In all the three DeepWAS, this approach identified regulatory SNPs that overlapped not only with SNPs associated with the same traits in the cohort-matched GWASs, but also with genome-wide significant associations from the larger consortia GWASs for these traits. These associations had not survived correction for multiple testing in the underpowered cohort-matched GWAS, but were
detected using DeepWAS.
Deriving hypotheses on disease-associated mechanisms in MS from
DeepWAS result
We next wanted to illustrate how DeepWAS can accelerate the discovery of disease
mechanisms. Within the DeepWAS results for MS, we identified, for example, the intergenic
region IL20RA-IL22RA2 on chromosome 6 that includes deepSNP rs62420820 (Figure 3B),
which was genome-wide significant in the IMSGC GWAS (p-value=9.26×10
-36, Figure 3D)
and nominally significant in the KKNMS GWAS conducted on the MS cohort used for the
DeepWAS analysis (p-value=1.23×10
-5, Figure 3D). In comparison to the published
GWAS-based results, DeepWAS adds the novel and testable hypothesis that the TFs MafF and
MafK contribute to MS susceptibility. The IMSGC GWAS and deepSNP rs62420820 shows
allele-specific TF binding differences for MafF and MafK in the leukemia cell line K562
(Figure 3C). Of note, additional deepSNPs were identified within the FUs MafK:K562
(Figure 3B/E: deepSNP rs12768537 on chromosome 10 and Figure 3B/F: deepSNP
rs137969 on chromosome 22) and MafF:K562 (deepSNP rs12768537), supporting a role of
these TFs in the etiology of MS.
We also identified deepSNPs that were detected at a genome-wide significance level by both the cohort-matched KKNMS GWAS and IMSGC GWAS. This includes deepSNP rs1985372 on chromosome 16, located in the CLEC16A locus, previously suggested as a candidate gene for MS (the deepSNP rs1985372 was significant in the KKNMS GWAS on the same cohort and is in complete LD with the SNP rs2286974 (r2=0.99), which was significant in the IMSGC GWAS 27,43). DeepWAS now adds the regulatory information that these SNPs alter TF binding of GABP, GATA-1, GATA-2, p300, STAT1, STAT2, STAT5A, and TBLR1, all expressed in K562 cells, and that these TFs play a MS-specific role in regulation of CLEC16A.
Regulatory effect of MS-specific deepSNP loci
Allele-specific effects on chromatin features and TF binding are likely to be reflected by changes in DNA methylation and gene expression. To test whether the MS-specific deepSNPs or their proxies (r2≥0.5) associate with differences in gene expression and DNA methylation, we used publicly available cis-meQTL, cis-eQTL, and eQTM data from multiple resources: 1) The Biobank-Based Integrative Omics Study (BIOS) analyzing whole blood (>2000 samples) 44,45, the CommonMind Consortium (CMC 46) dorsolateral prefrontal cortex data (DLPFC) (n=603 samples), and GTEx data 47. In the largest resource, BIOS, we observed that 36 of the 53 non-MHC, MS-specific deepSNPs were significant meQTLs (68%) and 20 significant eQTLs (38%), which represent a 1.7 and 1.9 fold enrichment over randomly sampled regulatory SNPs and their assigned LD proxies, respectively (permutation p-values≤0.011,see Figure 4A and Supplementary Table 5). We next restricted DeepWAS hits to deepSNPs moderating immune cell lines (n=13 deepSNPs, 46 chromatin features, 4 cell lines and 50 FUs, Supplementary Table 2), given the relevance of this tissue in MS 48. Of this subset of 13 immune MS-specific deepSNPs, 62% (n=8 deepSNPs) overlapped with meQTL variants (meSNP) and 38% (n=5 deepSNPs) with eQTL variants (eSNP) in BIOS. In their recent study, the IMSGC identified significant eQTL effects in naive CD4+ T cells and monocytes for only 18% of their significant GWAS loci 49. When overlapping our immune MS-specific deepSNPs with the same QTL datasets, we found 43% (n=23 SNPs) of these deepSNPs to be part of eQTLs in CD4+ T cells and 38% (n=20 deepSNPs) in monocytes. In addition to publicly available data, we also conducted an eQTL analysis using blood gene expression levels from a subset of 319 MS patients of the MS cohort. In total, 47% (n=25 deepSNPs) of our MS-specific deepSNPs showed a significant eQTL effect in this data (Figure 4A and Supplementary Table 6), of which 14 deepSNPs had previously been identified as part of eQTLs in blood. In the GTEx database, we found 42% of these deepSNPs to have a significant effect in blood eQTLs (Supplementary Table 8).
Taken together, QTL data from various resources support that the DeepWAS of MS identified SNPs in transcriptionally relevant regions and emphasize their putative regulatory role in immune function.
Regulatory effect of MDD and height deepSNP loci
The 61 MDD- and 43 height-specific deepSNPs were also transcriptionally active in the respective relevant tissues (see Figure 4A and Supplementary Tables 9-16)and tagged more BIOS eQTLs and meQTLs than expected by randomly sampling of regulatory SNPs and assigning their LD proxies (MDD: fold enrichment for eQTLs=1.7 and meQTLs=1.5, permutation p-value=0.009 and 0.015, respectively; height: fold enrichment for eQTL=1.5 and meQTLs=1.5, permutation p-value=0.068 and 0.013, respectively, see Methods). Interestingly, in the much larger PGC GWAS only 20% of their 44 genome-wide significant hits overlapped with BIOS meQTLs 35, while the overlap was 54% for MDD-specific deepSNPs (Figure 4A). For a subset of both the MDDC and the KORA cohort, methylation levels and/or expression levels were measured. We therefore calculated meQTL and eQTL effects and found 16% of MDD-specific deepSNPs with significantmeQTL effects, 65% of the height-specific deepSNPs with meQTL and 33% with eQTL effects (see Figure 4A and Supplementary Tables
10,14-15).
All data from DeepWAS results with additional QTL information is stored in a searchable graph database and accessible at https://github.com/cellmapslab/DeepWAS.
Disease mechanisms on the level of functional units
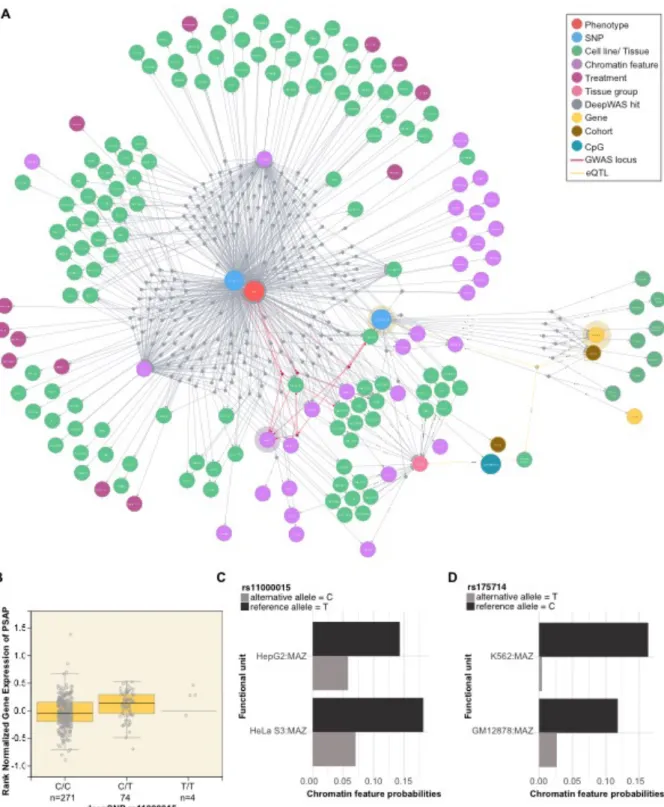
While DeepWAS can be used to predict the phenotype from the genotype, it is also interesting to annotate the relationship of FUs to disease or trait. For example, MS is an immune-mediated disorder affecting the central nervous system (CNS). Naturally, the CNS is difficult to directly examine as a study tissue. DeepWAS might here be used to identify a good proxy study tissue. To interrogate this hypothesis, we counted the number of MS-specific deepSNPs of each MS associated FU tissue group that overlapped with eSNPs of a GTEx tissue group (Figure 5B and Supplementary Figure 2). The MS heatmap in Figure 4B support the hypothesis that a proxy tissue can be identified and suggests that blood deepSNPs are surrogates for brain tissues and other tissues, especially for the thyroid. Moreover, DeepWAS results can be used to identify single SNPs as key regulators, i.e., those SNPs with effects on multiple chromatin features. DeepWAS identified, for example, the intergenic deepSNP rs175714 on chromosome 14 as a key regulator for MS (Figure 5A-B). It affects the binding of
multiple chromatin features at the same time (n=29) in 116 cell types (Figure 5A-B). One of these chromatin features is the TF MAZ. MAZ itself is one of the top-associated loci of the KKNMS GWAS (tag SNP rs34286592 on chromosome 16, p-value=4.58×10⁻¹⁰), but no significant transcriptional effect was previously identified in a post-hoc analysis of the GWAS 27. Interestingly, the MS-specific
deepSNP rs175714, together with the MS-specific deepSNP rs11000015 on chromosome 10, had a significant effect on the binding of MAZ and they were jointly associated with MS disease status. The
deepSNP rs11000015 is correlated with expression levels of the Prosaposin (PSAP) gene in multiple tissues, whole blood gene expression levels of PSAP are shown in Figure 5C.
Another example is the TF MEF2C in the analysis of MDD, where DeepWAS identified the intergenic SNP rs7839671 on chromosome 8 as one of the key regulators for MDD (see Supplementary Figure 3). MEF2C is an important risk gene for MDD and the MEF2C gene itself is one of top-associated loci of the PGC GWAS for MDD 35 (MEF2C, chr5: 87.443-88.244 Mb, p= 7.9×10⁻¹¹, Supplementary
Figure 3). SNP rs7839671 and its proxies are associated with differences in mRNA expression of
SPIDR and MCM4 and show meQTLs with an intergenic region (for more details, see
Supplementary Figure 3).
QTL network analyses
In-depth investigation of the wealth of additional regulatory capacities of deepSNPs were carried out by generating QTL-networks that combine all pairwise links of meQTL (SNP-CpG), eQTL (SNP-gene), eQTM (CpG-gene), and deepSNP-FU information. QTL network analyses helped us to identify the SNPs that showed joint effects on epigenetic and transcriptomic levels, i.e., deepSNP = eSNP = meSNP where the deepSNP harbors an eQTM. The resulting networks are called three-way QTL interaction networks. Three MS-specific deepSNPs on chromosome 17, rs2273030, rs4925172 (both in complete LD with each other r2=1), and rs7207666 (r2=0.7) are located in the SHMT1 locus, a candidate gene for MS 27,49 (Supplementary Figure 4A). The genetic variants and SHMT1 are connected via eQTL, meQTL, and eQTM relations (Supplementary Figure 4B). In comparison to the previously published findings on the locus, DeepWAS informs that the TF Yin Yang 1 (YY1),
expressed in multiple cell lines, may lead to a downregulation of SHMT1 gene expression and
hypermethylation of cg25492364 and cg26763362, thus connecting the disease associated SNPs with specific regulatory functions.
Moreover, a three-way QTL interaction network analysis identified the height-specific deepSNP rs7146599 on chromosome 14 to affect a cascade of eight chromatin features in eleven cell lines (see
Supplementary Figure 5A-B). The network also included rs2871960 on chromosome 3, linked to the
ZBTB38 locus and correlated with multiple CpG sites. ZBTB38 has been previously shown to play an important regulatory role in height 50.
Thee-way QTL interaction network analysis identified the MDD-specific deepSNP rs163105 on chromosome 5 to alter the expression of SKIV2L2 (also known as MTR4). This gene has already been shown to be differentially expressed between depressed women and controls 51 (see
Supplementary Figure 6). Furthermore, SKIV2L2 has been implicated in the stress response and
neurodegeneration through the nuclear exosome-targeting (NEXT) complex 52.
In summary, DeepWAS allows the direct identification of putative master regulators, TFs and chromatin features for a subsequent in-depth analysis of genetic association signals.
Discussion
In classical GWASs, all SNPs are tested independently from each other on a genome-wide scale, thereby implicitly assuming that any SNP can moderate the function of any cell state at any time. It is now clear that disease associations, especially regarding common disorders, are driven by SNPs altering the function of regulatory elements. Hence, it is likely that testing all SNPs in GWAS is not necessary but rather we should use functional annotation to help prioritize putative risk variants 17. So far, several post-hoc functional annotations of GWAS results have been reported 53-55. In this
manuscript, we present DeepWAS, a novel analysis tool for genetic associations that fuses GWAS and functional annotation into one single step (Figure 1). We employ the powerful deep learning based method DeepSEA to predict regulatory effects of chromatin features in various cell types on a single SNP level 36. In addition, we implement multi-SNP regression models with L1 regularization to identify so-called deepSNPs. The SNPs of one FU are only selected when they are jointly associated with the disease or trait. To the best of our knowledge, this study is the first to combine deep learning-based predictors with multivariate models. By applying DeepWAS to three datasets, we show that this method allows direct fine-mapping of GWAS associations at a single base resolution as well as direct functional annotation of the association signal to both chromatin features and cell types, generating novel mechanistic hypotheses. We also demonstrate that DeepWAS, by pre-selecting functionally relevant SNPs and integrating multivariate statistics, might increase power to detect true positive signals.
We applied DeepWAS on a well-powered GWAS dataset for MS (n=15,283 individuals), but also to underpowered GWAS data for MDD (n=3,627 individuals) and height (n=3,658 individuals). In all three phenotypes, many SNPs in many genes contribute to genetic variation in the population and the effect size of each SNP was found to be small 56. Therefore, large sample sizes are needed to
discover additional risk variants. We identified 35 putative new candidate MS risk SNPs outside of the MHC region that did not reach genome-wide significance in GWAS (in total: 53 non-MHC, MS-specific deepSNPs). For MDD, DeepWAS prioritized 56 new putative risk variants (in total: 61 MDD-specific deepSNPs) and for height 35 new risk variants (in total: 43 height-specific deepSNPs), even though the classical GWAS approach for MDD and height did not yield genome-wide significant results. Importantly, when comparing our deepSNPs identified in these smaller cohort-matched GWASs to large consortia GWASs of the same phenotype, DeepWAS was able to detect SNPs that reached genome-wide significance in these large consortia GWASs but not in GWAS of the same sample
(Figure 3).Importantly, all deepSNPs were associated at least with nominal significance in
cohort-matched GWAS, with a subset of deepSNPs reaching genome-wide significance. Interestingly, when comparing our deepSNPs to the larger consortia GWASs, DeepWAS detected SNPs that reached genome-wide significance in these GWASs but not in the smaller-scale GWAS on the individual cohorts (Figure 3).For example, 23% of the 53 MS-specific deepSNPs were previously identified in the ISMGC MS GWAS including more than 135,000 individuals (>47,000 MS cases). One-third of
these deepSNPs were not detected in the univariate KKNMS GWAS using the same cohorts as in DeepWAS (n>15,000 individuals). The increased power of DeepWAS is underlined by the observation that when, for example, all regulatory MS SNPs (n=36,409 SNPs), without grouping to FUs, were used as input to a single LASSO regression model with stability selection, only 19 SNPs showed a significant association with MS, of which four mapped outside the MHC region. This is in contrast to the 164 MS-specific deepSNPs identified using DeepWAS, of which 53 were outside of the MHC region. Notably, these 36,409 SNPs reside in only 25,000 independent loci, which is also reflected by the fact that 16 out of 53 MS deepSNPs are not independent from each other. The regulatory
genotypes have, thus, little correlation and are therefore suitable to be subjected to a L1 penalization. In summary, DeepWAS can increase the power to detect associations of a phenotype with regulatory variants, with genome-wide significant consortia GWAS variants detected using DeepWAS in smaller samples in which they only showed sub-threshold signals using classical GWAS. As outlined below, functional analyses of identified deepSNPs suggest that the additional signals discovered using DeepWAS but not using classical GWAS reside within known, disease-relevant functional pathways and thus likely constitute true-positive associations.
Particularly for non-coding regulatory SNPs, DeepWAS has an advantage over GWAS followed by post-hoc annotation and allows to identify transcriptionally relevant regions in the disease context
(Figures 2-5). In fact, in all three DeepWAS, deepSNPs were identified in cell types and enhancers
previously shown to be relevant for the tested phenotype. For example, 47% of the MS-specific deepSNPs (n=35) affect the binding of chromatin features in hematopoetic tissue, and another 30% affect chromatin features in brain tissue or spinal cord (n=16; Figure 2B). These findings revealed that the genetic disease risk is driven by altered binding of chromatin features mainly in these two tissues.
DeepWAS results also pointed towards convergent regulatory mechanisms of specific TFs in both MS and MDD. For both disorders, DeepWAS identified a set of SNPs modulating binding of a TF that was found to be associated with the disorders in GWAS. This suggests that SNPs associated with the gene encoding the TF and SNPs altering its binding to target transcripts jointly affect the phenotype. The gene MAZ on chromosome 16, for example, has been previously identified as a genome-wide significant GWAS locus for MS 27. DeepWAS identified several deepSNPs that include the TF MAZ in a FU (Figure 5). DeepSNP rs11000015 on chromosome 10 and deepSNP rs175714 on chromosome 14 alter MAZ binding. Supporting evidence for the importance of deepSNP rs11000015 as a risk factor for MS was provided by it being a multi-tissue GTEx eQTL involving PSAP. PSAP codes for prosaposin, a precursor of several small nonenzymatic glycoproteins termed sphingolipid activator proteins that assist in the lysosomal hydrolysis of sphingolipids 57. Sphingolipids are the main components of nervous tissue, and have been previously linked to MS 58. As a second example, we identified MDD-specific deepSNPs altering the binding of TF MEF2C (Supplementary Figure 3). SNPs in the locus encoding MEF2C are the top signal in the latest meta-analysis for major depression
to be disturbed in MDD, especially in the context of stress. Chen and colleagues 59 identified the TF MEF2 as a master regulator of developmental metaplasticity, which is important for guiding
developmental structural and functional neuronal plasticity. Additional evidence was found by Barbosa et al.60, relating MEF2 to activity-dependent dendritic spine growth and suggesting that this TF may suppress memory formation.
To support the validity of the predicted regulatory effects of our DeepWAS associations, we provided multiple lines of evidence that deepSNPs and their surrounding loci are indeed functionally active in their respective tissue. We chose to prioritize DeepWAS results based on additional regulatory impact of DNA methylation and gene expression as shown by their meQTL and eQTL effects. DeepSEA together with eQTL data, has been previously applied to prioritize disease-associated variants 61. We observed that 68% of MS-specific deepSNPs are meQTLs and 38% eQTLs in the largest QTL resource, BIOS. When using only random sets of regulatory SNPs with no disease association, no such overlap was found. For all investigated phenotypes, we observed a significant overlap between deepSNPs and meQTL SNPs (Figure 4, fold enrichment ≥1.5 and permutation p-value over 1,000 random sets ≤ 0.015. For MDD- and MS-specific deepSNPs we found a significant overlap with eQTL SNPs (Figure 4, fold enrichment ≥1.5 and permutation p-value over 1,000 random sets ≤ 0.011). Moreover, as MS is a disorder developing in the peripheral immune system, we investigated if our deepSNPs alter the expression of CD4+ T cells or influence the expression in monocytes, and found twice as many eQTL effects for deepSNPs as described in the published IMSGC GWAS for MS (43% in CD4+ T cells and 38% in monocytes found using DeepWAS vs. 18% in both cell types in the IMSGC GWAS). Using expression profiles from GTEx, we found more MS-specific deepSNPs for blood eQTL SNPs than in brain-related eQTL SNPs (42% vs.11%). This supports the theory that MS is most likely initially triggered by perturbation of immune responses, but that also the functional responses of brain cells are altered and may have a role in targeting an autoimmune process to the CNS.
Finally, we explored whether generating QTL interaction networks of our deepSNPs and extracting the SNPs with an impact on methylation and expression, which also coincidently an eQTM, can help identify likely functional risk mechanisms. We identified deepSNPs in the SHMT1 gene, a published MS GWAS locus [27,28], where DeepWAS QLT network analysis pinpoints the TF Ying Yang 1 (YY1), expressed in multiple cell lines including immune related cells, as a potential novel risk factor
(Supplementary Figure 4). YY1 is a ubiquitously expressed TF shown to be essential for B cell
development 62 and serves as master regulator of T cell exhaustion 63. Such dysregulation of immune related cells has been shown to promote MS progression 64,65. Additional SNP-protein association studies (pQTLs) 66 that show how the deepSNP rs2273030 alter YY1 protein abundances could be extended to develop clinical applications in the context of MS.
DeepWAS is mostly limited by the comprehensiveness of regulatory element catalogues like
disease-specific stimulation conditions as well as disease-related tissues. We have previously reported on the importance of testing SNPs in stimulated conditions, and shown that glucocorticoid response
moderating SNPs only become apparent in the stimulation condition and are not overlapping with baseline eQTLs 67. Of note, the glucocorticoid receptor itself is central for the stress response and has been previously implicated in the pathogenesis of MDD 67,68. In addition, data from cell lines or bulk tissues will miss variants with effects only specific cell types as well as cell type specific effects dependent on the systemic, developmental and/or tissue context. It is therefore important to be able to retrain the DeepSEA neural network with additional publicly available chromatin features and as well as newly generated experimental data. This will be possible using the DeepWAS pipeline publicly available at https://github.com/cellmapslab/DeepWAS.
In summary, our results indicate that DeepWAS, a method combining deep learning based functional SNP annotation and considering a possible multivariate effect of SNPs to moderate a trait or disease, is a powerful tool to uncover disease mechanisms for common disorders and traits. It also allows direct identification of regulatory SNPs by having a single base resolution and not being limited by the LD structure of the locus, since our regulatory SNPs are mostly independent and we jointly analyze regulatory SNPs only if they are predicted to modulate the same FU (see Methods). With ever increasing amounts of available functional data, the DeepWAS approach will become even more valuable and allow integration of both publicly as well as unpublished data generated by individual labs. DeepWAS is a versatile, publicly available tool that can be applied to any GWAS dataset in conjunction with the code available for DeepSEA. While we tested DeepWAS in small and medium size samples, and observed a potential increase in power in detecting phenotype-relevant functional SNPs, applying this method to very large datasets will be even more informative.
Figures
Figure 1: Workflow of DeepWAS. A) A deep-learning based framework predicts combined binding
probabilities for chromatin features, cell lines, and treatments, called functional units (FU) for 1,000 bp centered around a SNP. FUs are selected for a potential functional role of a variant using a cutoff for functional scores. This process is repeated for all genotyped variants. The genotype-phenotype association is analyzed for each FU using LASSO regression with stability selection. Unlike GWAS, DeepWAS implicates a regulatory mechanism underlying the phenotype of interest with information
on relevant cell lines and TFs. B) DeepWAS was applied to 36,409 regulatory SNPs that were retained after filtering for allele-specific effects in any given FU. These SNPs were tested for an association with multiple sclerosis (MS). The heatmap shows the number of selected chromatin features vs. cell lines. Chromatin features are limited to be present in at least two distinct cell lines. Missing values, represented in white, show FUs for which no data were available.
Figure 2: Functional characterization of DeepWAS hits. A) Annotation of the genomic regions in
which deepSNPs are located: 63-87% of the genomic positions of deepSNPs overlapped with non-coding DNA elements. Seventeen of 53 MS-specific (32%), 14 of 43 height-specific (33%) and 8 of 61 MDD-specific (13%) deepSNPs mapped to introns (firstand other introns). Over a half of the MDD-specific deepSNPs (53%) resided in distal intergenic regions (>3 kb). None of the MS- and MDD- specific deepSNPs were located in exons. B) Bar plots for each phenotype showing the number of unique deepSNPs annotated to a top-level tissue category (ENCODE). C) Overlap of MS-, MDD-, and height-specific deepSNPs with ChromHMM states from Roadmap epigenomes based on top-level tissue group matching. Most of our MS- and height-specific deepSNPs mapped to predicted active chromatin states (82-86%), whereas nearly half of MDD-specific deepSNPs mapped to inactive chromatin states (43%). D) Tissue enrichment with FANTOM gene expression data. The top 15 significantly enriched tissues are shown (all p-values≤0.05).
A C
D
Fantom tissues
Migratory langerhans cells Renal Mesangial cells Acute myeloid leukemia (FAB M5) cell line Splenic lymphoma with villous lymphocytes cell line Prostate Stromal Cells
Smooth Muscle Cells − Brain Vascular
Monocyte−derived macrophages response to udorn influenza infection
CD14+ monocytes − treated with Candida Macrophage − monocyte derived Mycosis fungoides Cord blood derived cell line:
COBL−a 24h infection Cord blood derived cell line:
COBL−a untreated
Cord blood derived cell line:
COBL−a 24h infection(−C)
Acute myeloid leukemia (FAB M5) cell line Dendritic Cells −
monocyte immature derived
0 1 2 3 4 5 −log10(p−value)
MS
Acute lymphoblastic leukemia cell line Carcinosarcoma cell line Renal cell carcinoma cell line Postcentral gyrus Pons NK T cell leukemia cell line Testis
Melanocyte − dark Cord blood derived cell line:
COBL−a 24h infection Testicular germ cell embryonal carcinoma cell line Cord blood derived cell line:
COBL−a untreated
Occipital pole Fibrous histiocytoma cell line Medial temporal gyrus Neuroepithelioma cell line
0 1 2 −log10(p−value) MDD Pancreas Diaphragm Spinal cord Myeloma cell line Skin Merkel cell carcinoma cell line Throat CD8+ T Cells Amniotic Epithelial Cells Skeletal muscle cells differentiated into Myotubes Skeletal muscle − soleus muscle Pancreatic carcinoma cell line Placental Epithelial Cells Pericytes Skeletal muscle 0 1 2 3 −log10(p−value) Height SNP counts
DeepWAS tissue category
Height MDD MS
0.00 0.25 0.50 0.75 1.00 Frequency
UCSC genomic feature
1st Intron Other Intron 1st Exon Other Exon 3' UTR Promoter (≤1kb) Promoter (1−2kb) Promoter (2−3kb) Downstream (≤3kb) Distal Intergenic ChromHMM states Active TSS Flanking Active TSS
Bivalent/Poised TSS Weak transcription Transcr. at gene 5' and 3' Strong transcription
Flanking Bivalent TSS/Enh Enhancers Genic enhancers B MS MDD Height 0 10 20 30 0 10 20 30 0 10 20 30 blastulablood
blood vesselbone
32%
brain brain hippocampusbreast cerebellarcervix colon connective embryonic lung embryonic stem cellepithelium eye fetal membraneforeskin gingivalheart iPSC kidneyliver luminal epitheliumlung mammarymuscle myometriumpancreas prostateskin spinal cordtestis urotheliumuterus
MS MDD Height
0 25 50 0 25 0 25
Blood & T−cell
Brain Digestive ENCODE2012 Epithelial ES−derived ESC Heart HSC & B−cell IMR90 iPSC Mesench Muscle Other Smooth Muscle SNP counts
Roadmap tissue category
53%
33%
25 25 25
active
repressive repressive active repressive active SNP counts SNP counts
Repressed PolyComb Weak Repressed PolyComb Heterochromatin
37% 36%
Figure 3:Comparison of DeepWAS vs. GWAS results.A) Bar plot of the overlap of cohort-matched GWAS and consortia GWAS SNPs with deepSNPs. g.-w. s=genome-wide significant. B) Network of MS-specific deepSNPs generated by using a graph database and showing the deepSNP
A no available data not significant nominal significant genome-wide significant 0 2 4 6 8 10 ● ●● ● ● ●●●● ● ● ● ● ● ● ● ● ● ● ●● ● ●●● ●● ● ●● ●●● ●●●● ● ● ● ● ● ●●●●●●●●●● ● ● ●●●● ●●●●●●●●●●●●●●●●●●●●●● ● ● ●●●●● ●●●● ●●●●●●●● ● ● ●●●●●●●●●●● ●●●●●●● ● ● ● ● ●●● ● ●●●●●●● ● ●● ● ● ●● ● ● ● ●●●●●●●●●● ●●●●●●●●●●●●●●● ● ● ● ●●● ● ● ● ●●●●●●●●● ● ● ● ●● ● ● ● ●●● ●● ● ●● ● ● ●● ●● ●● ● ● ● ●●●●●●●●●●●●●●●●●●●●●●●●●●●●●●●●●●●●●●●●●●●●●●●●●●●●●●●●●●●●●●●●●●●●●●●●● ● ● ●●●●●●● ● ● ● ●●●●●●●●●●●● ● ●●●●●●●●●●●●●●●●●●●● ● ● ● ● ●● ● ● ● ●●●●●●●● ● ● ●●●● ●●●●●●●●● KKNMS GWAS rs137969
ENTHD1 GRAP2 FAM83F
LOC100130899 TNRC6B 40.2 40.25 40.3 40.35 40.4 40.45 Position on chr22 (Mb) -log 10 p-value MafK 0 2 4 6 8 10 ● ● ● ● ● ● ● ●●●●●●●●●●● ● ● ● ● ●●● ●●● ● ● ● ● ● ●● ● ● ● ● ● ● ● ● ● ●● ● ●● ● ● ● ● ● ● ● ● ● ● ● ● ● ●● ● ● ● ● ●●●●●●●●●●● ● ●●●●●● ● ● ● ●●● ●●●● ●● ● ● ● ● ●● ● ● ● ● ● ● ● ●● ● ● ● ● ● ● ●●●●●●●●● ● ● ●● ● ● ● ● ● ● ●●● ●● ● ● ● ● ●● ● ● ● ● ● ●● ● ● ● ● ● ● ● ● ● ● ● ● ●●●●●●●● ●● ● ●●● ● ● ● ●● ● ● ● ●●●● ●●● ● ● ● ● ● ● ● ● ●● ● ● ● ●●●●●● ● ● ● ●●●●●●●●●●●● ● ● ●●● ● ● ● ● ● ● ● ●●●●●●●●●●●●●● ●● ● ● ● ● ● ● ●● ● ● ● ● ● ● ● ● ● ● ● ● ● ●●● ● ● ● ● ●● ● ● ● ● ● ● ● ●●●● ● ● ● ● ● ● ● ● ●●●●●● ● ● ●● ● ●●● ● ● ● ● ● ● ●● ● ● ● ● ●● ● ● ● ● ● ● ● ● ● ● ● ● ● ● ●● ● ●● ● ●●●●●●● ● ●● ● ● ● ● ● ● ●●●●●●●● ● ● ●●●●●● ● ● ● ● ●●●●● ● ● ● ● ● ● ● ●●●●●●●●●●●● ● ● ●●●● ● ● ● ● ● ● ● ● ● ●● ● ● ● ● ● ● ● ● ● ●●● ● ● ● ● ● ● ● ● ●●●●● ●● ● ●●●●●●●●● ● ● ● ● ● ● ● ●● ●●●●●● ● ●● ● ● ● ● ● ●●● ●● ● ●● ● ● ● ● ● ●●● ● ● ● ● ● ● ●● ● ● ● ● ● ● ● ● ●●●● ● ● ● ●●●●●●●●●●●●●●●●●●●● ● ●●●●●●●●●●● ● ● ●●● ● ● ● ●●●●●●●●●●●● ● ● ● ● ●● ● ● ●● ●● ● ● ● ● ● ● ● ● ● ●●●●● ● ● ● ● ● ● ● ● ● ● ● ● ● ● ● ● ● ● ● ● ● ● ● ●● ● ● ● ● ● ● ●●●● ● ●● ● ● ● ● ● ● ● ● ● ● ●● ● ● ●●●●●●●●● ● ●●● ● ● ● ● ● ● ●●●●● ● ● ● ● ● ● ● ● ● ● ● ●●●●●●● ●● ● ● ●●●●●●●●●●●●● ● ● ●●●●●●●● ● ● ● ● ● ● ● ● ● ● ●●●●●●●●●●●●●●●●●● ●● ● ● ● ● ● ● ● ● ● ● ● ●● ● ● ● ● ●● ● ● ● ● ● ● ● ●● ● ● ● ● ● ● ● ●● ●● ●●●● ● ● ● ●● ● ● ● ● ● ●● ● ● ● ● ● ● ● ● ● ●●● ● ● ● ●●●●●●●●●●●●●●●●●●●● ● ● ● ● ● ● ● ● ● ●●●●●●●● ● ● ● ● ● ● ● ● ● ● ● ●●●●●●●●●●●●●●●● ● ● ● ● ● ●●●●●●●●●●●●●●●●●●●●●●●●●●●●●●●●●● ● ● ● ● ●●●●●●●●●●●●●●●●●●●●●●●●●●●●● ● ●●●●●●●●●●● ● ● ● ● ● ● ● ● ● ● ● ●●●●●●●●●●●●●●●●●●●●●●●●●●●●●●●●●●●●●●●●●●●●●●●●●●●●●●●●●●●●●●●●●●●●●●●●● ● ● ●●●●●●●●● ● ● ● ● ●●●●●●● ● ● ● ● ● ● ● ●● ● ●●●● ● ● ● ● ● ● ● ● ● ● ● ● ● ● ● ● ● ● ● ● ● ● ● ● ● ● ● ● ● ● ● ● ● ● ●● ● ● ● ● ● ● ● ● ● ● ●● ● ●● ● ●● ● ● ● ●●● ● ● ● ● ●●● ● ● ● ● ● ●● ● ● ● ●●●●●●● ● ● ● ● ● ● ● ● ●● ●●● ● ●●●●●●● ●●●●●●●●●●● ● ● ●●●●●●● ● ●●●●●●● ● ● ● ● ● ● ● ● ●●●●●●●●●●● KKNMS GWAS rs12768537 8.4 8.45 8.5 8.55 8.6 8.65 Position on chr10 (Mb) -log 10 p-value 0.2 0.4 0.6 0.8 r2 0 10 20 30 40 ●●●●●●●●●●● ● ● ●●●●●●●●●●●●●●●●●●● ●● ● ● ●●● ●● ● ●●●●●●● ●● ●● ●●● ● ● ● ● ●●●●●●●●●●●●●●●●●●●●●●●●●●●●●●●●●●●●●●●●●●●●●●●●●●●●●●●●●●●●●●●●● ●●●●●●●●●●●●●●●●●●●●●●●●●●●●●●●●●●●●●●●●●●●●●●●●●●●●●●●●●●●●●●●●●●●●●●●●●●●●●●●●●●●●●●●●●●●●●●●●●●●●●●●●●●●●●●●●●●●●●●●●●●●●●●●●●●●●●●●●●●●●●●●●●●●●●●●●●●●●●●●●●●●●●●●●●●●●●●●●●●●●●●●●●●●●●●●●●●●●●●●●●●●●●●●●●●●●●●●●●●●●●●●●●●●●●●●●●●●●●●●●●●●●●●●●●●●●●●●●●●●●●●●●●●●●●●●●●●●●●●●●●●●●●●●●●●●● ●●●●●●●●●●●●●●●●●●●●●●●●●●●●●●●●●●●●●●●●●●●●●●●●●●●●●●●●●●●●●●●●●●●●●●●●●●●●●●●●●●●●●●●●●●●●●●●●●●●●●●●●●●●●●●●●●●●●●●●●●●●●●●●●●●●●●●●●●●●●●●●●●●●●●●●●●●●●●●●●●●●●●●●●●●●●●●●●●●●●●●●●●●●●●●●●●●●●●●●●●●●●●●●●●●●●●●●●●●●●●●●●●●●●●●●●●●●●●●●●●●●●●●●●●●●●●●●●●●●●●●●●●●●●●●●●●●●●●●●●●●●●●●●●●●●●●●●●●●●●●●●●●●●●●●●●●●●●●●●●●●●●●●●●●●●●●●●●● ● ●●●●●●●●● ●●●●● ●●●●● ●●●●●●●● ● IMSGC GWAS rs62420820 NHEG1 IL20RA IL22RA2 IFNGR1 137.3 137.35 137.4 137.45 137.5 137.55 Position on chr6 (Mb) -log 10 p-value KKNMS GWAS rs62420820 tissue rs12768537 blood MS MafK K562 MafF HepG2 IMR90 rs137969 NF-E2 Bach1 rs62420820 Phenotype Chromatin feature Cell line / Tissue SNP Tissue group DeepWAS hit B C E D rs137969 rs62420820 rs12768537 rs137969 rs62420820rs12768537 0.0 0.2 0.4 0.6
Chromatin feature probabilities
FU = K562:MafF FU = K562:MafK deepSNPs alternative allele reference allele F ● ●
Significance value of deepSNP in respective dataset
complete hits GIANT GWAS complete KORA GWAS (same cohort) top 10k hits PGC GWAS complete MDDC GWAS (same cohort) all g.-w. sign. hits IMSGC GWAS complete KKNMS GWAS (same cohort)
0 20 40 60
Number of deep SNPs MS deepSNPs overlap with:
MDD deepSNPs overlap with:
17
rs62420820 in the K562 cell line, a genome-wide significant signal in the IMSGC MS GWAS, but sub-threshold in the cohort-specific KKNMS GWAS. Edges represent the association relation ofdeepSNPs, chromatin features with or without treatment, cell lines, and top-level tissue group. C) Bar plots showing the predicted DeepSEA probabilities for deepSNP sequences carrying the alternative and reference allele group by their FU. D-F) Locus-specific Manhattan plots of the MS-specific deepSNPs rs62420820, rs12768537, and rs137969, based on classical GWAS. Plots were produced using LocusZoom with EUR samples of the 1,000 genomes November 2014 reference panel on the hg19 build 69. Dots represent KKNMS GWAS p-values and the diamond shows the IMSGC GWAS signal p-value. Color of the dots indicates LD with the lead variant = deepSNP (magenta), grey dots have LD r2 missing.
Figure 4: Context-related regulatory capacity of deepSNPs. A) Heatmap showing the percentage
of overlap of MS-, MDD-, and height-specific deepSNPs or their proxies (r2≥0.5) with cis-meQTL and cis-eQTL data from multiple resources, see also Supplementary Tables 5-16. B). Heatmap depicting GTEx tissue groups and DeepWAS top-level tissue category overlap among the MS-specific
deepSNP FUs. 68% 38% 42% 42% 11% 60% 47% NA 54% 31% 31% 38% 33% 33% NA 16% 53% 30% 30% 47% 42% 51% 33% 65% blood emb ry
onic stem cell
lung ce rvix liver brain skin blood
vessel
breast epithelium bone monocytes pancreas brain hippocampus ute
rus
urothelium prostate m
yomet
rium
luminal epithelium gingi
va
blastula fetal memb
rane hea rt cerebellar m uscle emb ry onic lung mamma ry kidn ey
foreskin eye colon connecti
ve
undif
ferentiated emb
ry
onic stem cells
testis spinal cord gingi
val
induced plu
ripotent stem cell
Adipose Visceral Omentum Breast Mammary Tissue Skin Sun Exposed Lower leg Whole Blood Cells Transformed fibroblasts Esophagus Mucosa Nerve Tibial Thyroid Testis Adipose Subcutaneous Lung
Heart Left Ventricle Spleen Heart Atrial Appendage Artery Coronary
Esophagus Gastroesophageal Junction Brain Cortex
Colon Transverse Pancreas Stomach
Brain Cerebellar Hemisphere Liver
Muscle Skeletal Brain Cerebellum
Skin Not Sun Exposed Suprapubic Artery Aorta Artery Tibial Adrenal Gland Pituitary Colon Sigmoid Esophagus Muscularis Brain Spinal cord cervical c−1 Uterus
Brain Hippocampus Brain Substantia nigra Minor Salivary Gland Brain Amygdala Brain Hypothalamus Vagina
Brain Anterior cingulate cortex BA24 Brain Putamen basal ganglia Brain Caudate basal ganglia Brain Frontal Cortex BA9 Brain Nucleus accumbens basal ganglia Small Intestine Terminal Ileum Prostate
Cells EBV−transformed lymphocytes Ovary
MS MDD Height
BIOS blood meQTL
BIOS blood eQTL
GTEx blood eQTL
GTEx skeletal muscle eQTL
GTEx brain eQTL
CMC brain eQTL
cohort-specific blood eQTL
cohort-specific blood meQTL
% of overlapping SNPs
A B
0 5 10 15
MS-specific deepSNP count
DeepWAS top-level tissue categories (Encode)
GTEx tissue groups
Figure 5. QTL network.A) Network showing one of the putative key regulators for MS, deepSNP rs175714 on chromosome 14. DeepSNP rs175714 is associated with differential TF binding of the TF MAZ, one of the top-associated loci in the KKNMS GWAS, where no significant transcriptional effect could be identified in the post-hoc analysis. Edges represent the associations between deepSNPs and chromatin features with or without treatment, cell lines, top-level tissue group, CpGs, and genes through dummy nodes identified either using DeepWAS or QTLs. Dummy nodes are used for preserving all entities of deepSNP and QTL associations. Edges highlighted in red show the
downstream QTL results shown in B. B) Box plot of GTEx whole blood eQTL data showing the relationship between PSAP gene expression and deepSNP rs11000015 genotype. C-D) Chromatin feature probabilities for the significant FU of the deepSNP sequences carrying the reference (black) and alternative (gray) allele.
Supplementary Figures
SupplementaryFigure 1: The heatmaps showing the number of selected chromatin features vs. cell
line for A) MDD and B) height. Chromatin features are limited to be at least present in two distinct cell lines.
Supplementary Figure 2: Heatmaps depicting GTEx tissue groups and DeepWAS top-level tissue
category overlap with the A) MDD- and B) height- specific deepSNPs.
SupplementaryFigure 3: A) Graph-based QTL Network visualization of the DeepWAS results
involving the TF MEF2C, which itself is one of the top associated PGC GWAS loci. Two deepSNPs are jointly associated with MDD and belong the same FU: MEF2C:GM12878. Edges represent the association relation of deepSNPs, chromatin features with or without treatment, cell lines, top-level tissue group, CpGs, and genes. Edges of the FU MEF2C:GM12878 are colored in red. Circular shades mark the corresponding genes or CpGs with are plotted in B and C. B) Box plot of GTEx frontal cortex eQTL data showing relationship between SPIDR gene expression and deepSNP rs7839671. C) Boxplot of recMDD meQTL data illustrating relationship between cg01650371 methylation and rs10099827 genotype in recMDD samples. Variant rs10099827 is a proxy of deepSNP rs7839671 (r2=0.8). DeepSNP rs7839671 exhibits a meQTL effect on the same CpG and was excluded from the original meQTL analysis, as it is 571 kb away from the CpG site (meQTL distance cutoff≤250 kb).
SupplementaryFigure 4: A) Locus-specific Manhattan plot of the deepSNP rs2273030 that is a
sub-threshold GWAS SNP for MS. The plot is produced using LocusZoom with EUR samples of the 1,000 genomes November 2014 reference panel on the hg19 build 69. Dots represent GWAS p-values and the color of dots indicates LD with the lead variant, grey dots have LD r2 missing. B) MS-specific three-way QTL interaction network generated by using a graph database and highlighting only the deepSNPs with eQTL and meQTL effects that also harbor an eQTM. Edges represent the association relation of deepSNPs, chromatin features with or without treatment, cell lines, top-level tissue group, CpGs, and genes.
Supplementary Figure 5:A) Height-specific three-way QTL interaction network highlighting
deepSNP rs7146599 on chromosome 14 as one of the moderators of height in eleven cell lines. It affects a cascade of chromatin features (n=8) and shows meQTL and eQTL effects that, at the same time, harbor an eQTM. The CpG site and the deepSNP thus affect the transcriptional level of the
same genes. In addition, the network includes rs2871960 on chromosome 3, linked to the ZBTB38 locus and correlated with multiple CpG sites. Edges represent the association relation of deepSNPs, chromatin features with or without treatment, cell lines, top-level tissue group, CpGs, and genes.
B) Heatmap illustrating the deepSNPs affecting the binding of more than four chromatin features.
SupplementaryFigure 6: MDD-specific three-way QTL interaction network generated by using a
graph database and highlighting only the deepSNPs with eQTL and meQTL effects that also harbor an eQTM. It shows that the MDD-specific deepSNPs rs163105 on chromosome 5 changes the expression of SKIV2L2 (also known as MTR4). Edges represent the association relation of
deepSNPs, chromatin features with or without treatment, cell lines, top-level tissue group, CpGs, and genes.
SupplementaryFigure 7: Lasso Stability selection results for FU: MEF2C-GM12878: the y-axis
indicates number of boosting iterations, the x-axis indicates the stability selection probability, and the horizontal line correspond the 0.7 probability threshold.
Supplementary Tables
Supplementary Table 1: List of all functional units Supplementary Table 2: List of MS-specific deepSNPs Supplementary Table 3: List of MDD-specific deepSNPs Supplementary Table 4: List of height-specific deepSNPs
Supplementary Table 5: MS-specific deepSNP and BIOS QTL overlap Supplementary Table 6: MS-specific deepSNP and MS-patient eQTL overlap Supplementary Table 7: MS-specific deepSNP and CMC eQTL overlap Supplementary Table 8: MS-specific deepSNP and GTEx eQTL overlap Supplementary Table 9: MDD-specific deepSNP and BIOS QTL overlap
Supplementary Table 10: MDD-specific deepSNP and MDD-patient meQTL overlap Supplementary Table 11: MDD-specific deepSNP and CMC eQTL overlap
Supplementary Table 12: MDD-specific deepSNP and GTEx eQTL overlap Supplementary Table 13: Height-specific deepSNP and BIOS QTL overlap Supplementary Table 14: Height-specific deepSNP and KORA meQTL overlap Supplementary Table 15: Height-specific deepSNP and KORA meQTL overlap Supplementary Table 16: Height-specific deepSNP and GTEx eQTL overlap
Methods
Clinical Samples
Major depressive disorder cohorts (MDDC)
Two MDD cohorts, recMDD and BoMa, were analyzed. The recMDD cohort consists of 1,774
Caucasian individuals recruited at the Max-Planck Institute of Psychiatry (MPIP) in Munich, Germany and two satellite hospitals in the Munich metropolitan area (BKH Augsburg and Klinikum Ingolstadt): 756 controls (581 women, 275 men) and 879 cases diagnosed with recurrent major depression (585 women, 294 men). Please see Muglia et al.28 for more details on sample recruitment and
characterization. The BoMa cohort consists of 1,889 Caucasian individuals: 1,292 controls (656 men, 636 women), 597 (212 men, 385 women) of which had a depressive disorder. Recruitment strategies and further characterization have been described previously 70.
Multiple sclerosis cohorts (KKNMS)
Two MS cohorts, referred to as DE1 and DE2, were analyzed. Both data sets included patients diagnosed with either MS or the prodromal clinically isolated syndrome. DE1 consists of 3,934 cases and DE2 consists of 954 cases; for more details see Andlauer et al.27. Controls for these cohorts were obtained from several cohorts across Germany: KORA39, HNR 71, SHIP 72, DOGS 73, FoCus 74, PopGen 75, recMDD 28 , and MARS 76 ; for more details see Andlauer et al.27.
Population-based cohort (KORA)
The study population consisted of participants from the KORA (Kooperative Gesundheitsforschung in der Region Augsburg) study 39, which has been collecting clinical and genetic data from the general population in the region of Augsburg, Germany for more than 20 years. Here, the independent cohorts S3 and S4, including their follow-ups (F3 and F4), were analyzed.
Genotype data and imputation
Data generationGenotype data was generated for each cohort individually. Details on the methods used can be found in the individual papers (recMDD28, BoMa 70, KKNMS 27, and KORA 39).
Quality control and imputation
Quality control (QC) of KKNMS genotype data and imputation have been previously described 27 and the same pipeline was applied for KORA and recMDD genotype data. The QC was conducted in PLINK 1.90b3s or higher 77 for each cohort separately. QC steps on samples for KKNMS, KORA, and recMDD included removal of individuals with missing rate>2%, cryptic relatives (PI-HAT>0.0125), and