1
The Positive Effects of Energy Efficiency
on the German Electricity Sector
1Christopher Neme, Energy Futures Group, Hinesburg, Vermont, USA Friedrich Seefeldt, Prognos, Berlin, Germany
Ruth Offermann, Prognos, Berlin, Germany
Meg Gottstein, The Regulatory Assistance Project, Berlin, Germany David Echternacht, IAEW RWTH Aachen University, Aachen, Germany
Univ.-Prof. Dr.-Ing. Albert Moser, IAEW RWTH Aachen University, Aachen, Germany Frederick Weston, The Regulatory Assistance Project, Brussels, Belgium
Abstract
In order to meet its ambition of reducing its economy-wide greenhouse gas emissions by 80% in 2050 (relative to 1990 levels), Germany has set aggressive long-term goals to reduce primary energy consumption 50% by 2050 and to reduce power consumption 10% by 2020 and 25% by 2050. Meeting these goals will require aggressive investment in end-use energy efficiency, particularly in electric end-uses in all sectors of the economy. However, until now, no comprehensive study to determine the value of such efficiency savings, and thereby the effects on the power sector of such investments, had been performed. For this reason, Agora Energiewende, the European Climate Foundation (ECF), and the Regulatory Assistance Project (RAP) commissioned a study to examine the issue. The study reveals the value, in terms of reductions in total power sector costs, from investment in end-use energy efficiency in Germany’s homes and businesses. Four savings scenarios were analyzed, all of which yielded significant reductions in the total costs of generation (both conventional and renewable) and of transmission and distribution infrastructure over the 2014-2050 timeframe. These cost savings represent the benefit, or value, of end-use energy efficiency to the German electricity sector. This study did not attempt to determine whether those savings can be acquired at a total cost that is less than their value—further analysis will be needed for that—but other studies that examine the cost of end-use energy efficiency measures and programs in Germany strongly suggest that the savings described here can be cost-effectively achieved.
I. Introduction and Key Findings
There have been a number of studies in recent years that demonstrate that there is a very large reservoir of cost-effective savings to be acquired through investment in end-use energy efficiency in Europe and Germany.2 The common conclusions of these studies is that end-use efficiency is the least expensive means of meeting both the region’s energy needs and its greenhouse gas emissions (GHG) reduction targets. Indeed, because much end-use efficiency saves more money than it costs—that is, because it is paid for by energy cost savings—it constitutes a zero-cost (actually, a negative-cost) means of reducing GHGs and other harmful pollutants.3
1 Presented at the 2014 IEPPEC Conference, Berlin, 10 September 2014.
2 See for example IZES, BEI, Wuppertal Institut 2011. Erschließung von Minderungspotenzialen spezifischer Akteure, Instrumente und Technologien zur Erreichung der Klimaschutzziele im Rahmen der Nationalen Klimaschutzinitiative (EMSAITEK); BDI, McKinsey 2007. Kosten und Potenziale der Vermeidung von Treibhausgasemissionen in Deutschland; or IFEU, Fraunhofer ISI, Prognos, GWS, et al. 2011. Energieeffizienz: Potenziale, volkswirtschaftliche Effekte und innovative Handlungs- und Förderfelder für die Nationale Klimaschutzinitiative (NKI).
3 European Climate Foundation April 2010. Roadmap 2050: A Practical Guide to a Prosperous, Low-Carbon Europe, Vol. I: Technical Analysis. 10, 12, 27, 81-82. “As a result of these factors, the full cost of energy for the end-to-end energy system is lower in the decarbonized pathways.” 81.
2 Unfortunately, there is reason to doubt that the European Union’s target of 20% reduction in energy usage from end-use efficiency by 2020 is going to be met. Member State notifications under the Energy Efficiency Directive, which calls for 1.5%/year reductions in energy consumption beginning in 2014, forecast reductions of roughly half the hoped-for amounts.4 The reasons for this are many, but key among them are concerns about the up-front costs of energy efficiency measures and the means by which those costs will be financed. Pricing elements to fund efficiency are regarded in some circles as subsidies and, as such, are opposed on the same grounds as feed-in tariffs for renewables are. These arguments, however, fail to recognize that end-use efficiency produces system cost savings that exceed the investment cost of the efficiency. In this way, efficiency is fundamentally different than investment in generation, renewables or otherwise.
The analysis of system cost savings from energy efficiency—that is, the costs that efficiency avoids—has long been a feature of regulatory policy and power sector planning in North America. Forecasts of these “avoided costs” describe the value that efficiency can provide the system; and, if that efficiency can be acquired at a cost that is less than the avoided cost (i.e., produces net benefits), then the efficiency is cost-effective and should be acquired.5 For a variety of reasons, having to do mainly with different approaches to power sector policy and regulatory oversight taken by Member States, avoided cost studies of this sort have not been performed in Europe. But, because energy efficiency is critical to the achievement of Europe’s climate change objectives and as policymakers more and more see efficiency as a power system resource, a keen understanding of its costs and benefits will be needed.
This study is a first quantified look at the electric system benefits of deep investment in energy efficiency in Germany. It examines five development paths for the German electricity system, from 2012 through 2050. Each scenario assumes a different level of electric end-use efficiency and, therefore, different levels of electricity demand. The study examines how those different levels of demand impact the magnitude, composition, and cost of electricity production and transmission and distribution grid expansion and reinforcement. As described below, increased levels of efficiency yielded significant reductions in the total costs of generation (both conventional and renewable) and of transmission and distribution infrastructure. These cost savings represent the value of end-use energy efficiency to the German electricity sector. The study did not attempt to determine whether those savings can be acquired at a total cost that is less than their value—further analysis will be needed for that—but other studies that examine the cost of end-use energy efficiency measures and programs in Germany strongly suggest that the savings described here can be cost-effectively achieved.
The study was commissioned jointly by Agora Energiewende, the European Climate Foundation (ECF) and the Regulatory Assistance Project (RAP).
II. Scenarios Analyzed
The study examines five different development paths for electricity consumption over the 2012-2050 timeframe: a reference scenario, three comparative scenarios that assume greater efforts to reduce consumption, and a fourth scenario that assumes an increase in consumption. All of the scenarios – including numerous detailed assumptions regarding electricity demand – were previously developed by Prognos for the German government and other clients:
4 See Energy: Article 7 Notifications – European Commission. http://ec.europa.eu/energy/efficiency/eed/article7_en.htm. See also The Coalition for Energy Savings, 2014, Implementing the EU Energy Efficiency Directive: Analysis of Article 7 Member States reports.
5 There are a number of tests used in North America to analyze the cost-effectiveness of energy efficiency measures and programs. Most commonly employed is the “total resource cost test,” or some variation on it, as described in the California Standard Practice Manual. See
http://www.cpuc.ca.gov/PUC/energy/Energy+Efficiency/Cost-effectiveness.htm. See also https://ethree.com/public_projects/cpuc5.php for more detail on avoid-cost methodologies and the application of cost-effectiveness tests.
3 The Reference Scenario corresponds to the current reference/base case scenario of the
German government’s Energy Concept—a 2010 policy study that set forth the development goals for Germany’s Energy Turnaround.6 This scenario assumes further development and
adjustment of existing policy instruments, including those in place to encourage efficiency. The Business-As-Usual (BAU) scenario represents a modification of the Reference
scenario that assumes less overall progress with end-use energy efficiency. Current trends and policies continue, but are not further developed and adjusted.
The Efficiency Plus scenario constitutes a modification of the Reference scenario that, unlike the BAU scenario, assumes greater efficiency efforts and savings. It assumes the introduction of additional instruments for improving energy efficiency due to the implementation of the European Efficiency Directive (EED).
The Energy Concept scenario reflects the development goals of the German Energy Turnaround and represents the energy path to which the German Government is currently committed. Like the Reference scenario, it was developed for the 2010 Energy Concept study.
The World Wildlife Fund (WWF) scenario is the most ambitious efficiency scenario. It originates from a study commissioned by WWF in 2009. It assumes that Germany can successfully achieve a 40% reduction in electricity consumption by 2050.7
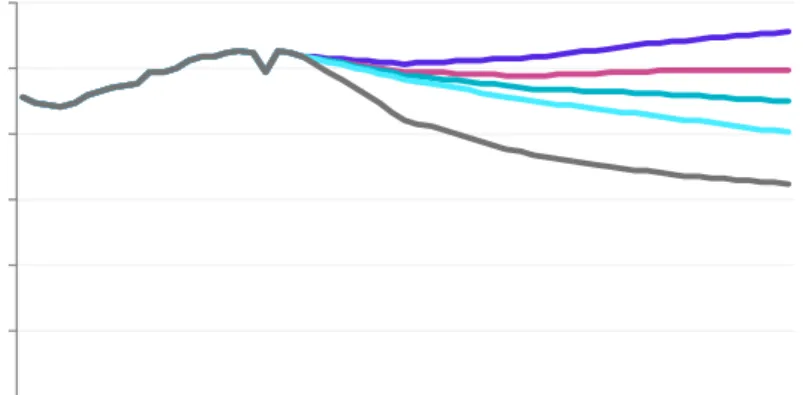
The range of efficiency reductions reflected in these scenarios were considered reasonable bounds for energy efficiency potential in Germany, based on recent potentials studies and the expectation that post-2020 studies will reveal additional potential.8 Figure 1 shows the development of electricity consumption in the five scenarios until 2050.
Figure 1. Development of the final-energy electricity consumption in the five analysed scenarios
6 Energieszenarien für ein Energiekonzept der Bundesregierung (Energy Scenarios for an Energy Concept of the German Government) prepared in 2010 by Prognos, together with the Energiegewirtschaftliches Institut an der Universität zu Köln (EWI) and the Gesellschaft für wirtschaftliche Strukturforschung (GWS). Available at: http://www.ewi.uni-
koeln.de/fileadmin/user_upload/Publikationen/Studien/Politik_und_Gesellschaft/2010/EWI_2010-08-30_Energieszenarien-Studie.pdf
7 Modell Deutschland - Klimaschutz bis 2050 (Model Deutschland—Climate Protection until 2050) WWF 2009; prepared jointly by Prognos, the Öko-Institut, and Dr. Hans-Joachim Ziesing; available at
http://www.wwf.de/themen-projekte/klima-energie/modell-deutschland/klimaschutz-2050/.
8 IZES, BEI, Wuppertal Institute (EMSAITEK study), 2011; BDI & McKinsey, 2007; IFEU, Fraunhofer ISI, Prognos, GWS, et al., 2011). 0 100 200 300 400 500 600 1990 1993 1996 1999 2002 2005 2008 2011 2014 2017 2020 2023 2026 2029 2032 2035 2038 2041 2044 2047 2050 T W h BAU
Ref erence Scenario Ef f iciency plus Energy concept WWF
4
III. Assumptions Underpinning the Study
As with any study of this type, a variety of assumptions and forecasts about the key drivers of electricity production and consumption were made. Here we describe briefly the key ones.
A. Energy Policy Framework
In the development of all the scenarios, the study assumes the following policy conditions:
The minimum goals set out in the German Renewable Energy Law (EEG) regarding the expansion of renewables in Germany will be met;
Nuclear energy production in Germany will be phased out according to the government’s 2011 decision; and
Carbon capture and storage (CCS) will not play a role in German electricity system. This is due to (1) current political and public resistance to CCS; (2) the high investment costs of CCS; and (3) the challenges caused by its operational inflexibility in a power system characterized by high penetration of variable renewables.
B. Electricity demand and Generation from Renewables
Key assumptions for electricity consumption development and renewables generation under each scenario is presented in Table 1 below. As also reflected in that table, all of the scenarios assume that same portion of demand will be met with renewable resources, increasing gradually to 81% in 2050.
Table 1. Framework assumptions of the analyzed scenarios
BAU Reference Efficiency Plus
Energy
Concept WWF
Final energy electricity consumption 2050 in TWh
556 497 449 402 324
Change in electricity consumption between 2011 and 2050
+7 % -5 % -16 % -20 % -40 %
Development of annual energy productivity between 2011 and 2050
1.3 %/a 1.8 %/a 2.1 %/a 2.4 %/a 2.6 %/a Annual change in electricity
consumption
+0.3 %/a -0.1 %/a -0.4 %/a -0.6 %/a -0.9 %/a Electricity generation from renewables
2050 in TWh
517 461 414 370 297
Renewables share of net electricity
generation 2050 81 %
C. Fuel and CO2 prices
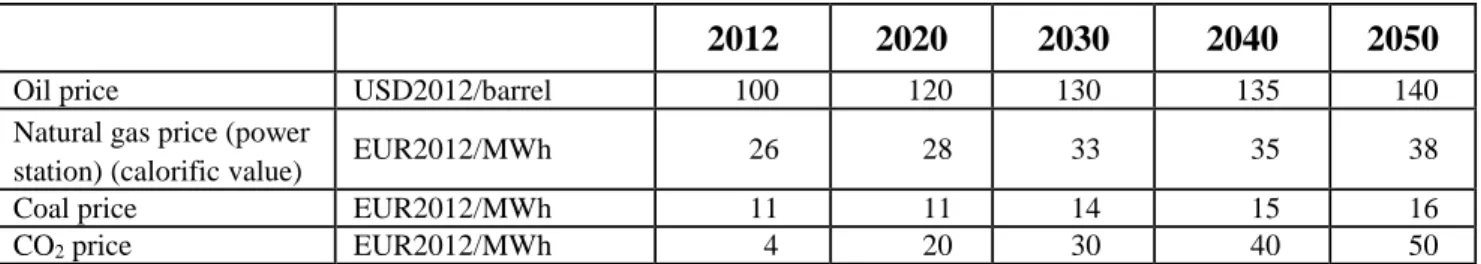
Table 2 presents the price projections for fossil fuels and CO2 certificates over the study
horizon. They reflect several important features of the markets for fuel and carbon allowances. First, German cross-border prices for crude oil and coal follow the international price development; they are driven by supply and demand on the world market. Second, prices for imported natural gas will continue to be linked, to a large extent, to the prices of individual oil products (“oil indexation”); but they will follow a more modest trajectory as supply diversification and more competition will increasingly decouple gas prices from oil prices. And, third, CO2 certificate prices mainly depend on future
5 assuming that Europe adheres to its CO2 reduction goals and that there is an absence of other,
complementary policy instruments to achieve those reductions.
Table 2. 2012 prices of fossil fuels and the assumed development until 2050
2012 2020 2030 2040 2050
Oil price USD2012/barrel 100 120 130 135 140
Natural gas price (power
station) (calorific value) EUR2012/MWh 26 28 33 35 38
Coal price EUR2012/MWh 11 11 14 15 16
CO2 price EUR2012/MWh 4 20 30 40 50
D. Primary Fuel/Electricity Imports and Exports
The demand for natural gas and coal in Germany is met to a large extent today through imports. This trend is assumed to increase in the future, due to the agreed phasing-out of coal mine operations and decreasing natural gas exploitation in Germany. Increased natural gas exploitation through fracking is not addressed in this study because of existing uncertainties and resistance.
The modelling used in this study did not incorporate imports and exports of electricity. This approach was taken in order to best segregate the effect of efficiency on the electricity sector. If imports and exports had been included, they would have caused additional overlapping effects that would have made it difficult to identify the net benefit of efficiency. As a result, the study calculations assume that “residual” generation required to augment available electricity generation from renewables would be supplied exclusively by German conventional power plants. And during times when total generation exceeded demand, it was also assumed that the excess electricity could not be exported. Therefore, for all hours in which total generation from renewables and conventional power plants (e.g., running at minimum capacity) exceeded total load (and available storage capacity), renewable generation was curtailed. (See Section IV below).
E. Costs of Generation, Transmission and Distribution.
Cost assumptions for this study were developed by Prognos and IAEW based on the research they conducted for this and other analyses of the German power sector, with considerable input from project team advisors and peer reviewers. The full study provides numerous tables with accompanying text describing these assumptions. For the purpose of this paper, we highlight one key framing assumption, namely, that there is untapped potential for technological improvement and cost reductions for all renewables technologies. Therefore, the study assumes reductions in investment costs under all scenarios. Refer to Table 3.
Table 3. Specific investment costs of renewable energy technologies
2012 2020 2030 2040 2050
Photovoltaic EUR2012/kW 1,150 1,050 930 785 740
Wind onshore EUR2012/kW 1,560 1,490 1,388 1,362 1,325
Wind offshore EUR2012/kW 4,000 3,400 3,100 2,950 2,850
6
IV. Study Methodology
A. Methodological Approach
The methodology used to develop total system costs for each scenario, with which to evaluate the value of increased energy efficiency, involved the following main steps:
(1) Starting with the overall consumption efficiency levels assumed for each scenario, the
expansion path of renewables (by technology) to meet the 81% target in 2050 was established based on cost-optimality and other considerations.
(2) The next step was to calculate system “useable” generation from renewables , based on assumed self-generation quantities, fossil-thermal minimum capacity levels, storage capacity, and other factors.
(3) From these calculations and assumptions, the levelized cost of energy (LCOE)for each renewable energy technology was calculated.9 LCOE multiplied by electricity quantities (by technology) produced the total costs of renewable generation in each year, for each scenario. Table 4 shows how these LCOEs were calculated.
(4) Next, the residual load not met by renewables was calculated and conventional generation was modelled to meet it10, based on merit order, thermal minimum capacity,
provision of system (ancillary) services from these plants and other considerations.
Energy efficiency and demand response (EE/DR) were factored into the modelling.
The greater the future electricity consumption in the scenarios, the greater the modelled EE/DR potentialto both decrease load peaks and expand electrical storage.11
(5) Total annual costs and levelized costs/MWh for the modelled conventional power plant fleet and associated electricity generation were calculated for each scenario. (6) The time series data developed in the steps above for load, generation from renewables
and conventional power fleet were then processed for input into a separate transmission grid expansion model:
a. The level of renewables curtailment in all hours with negative residual load (to balance the system) and resulting impact on maximum feed-in capacity was calculated.12
b. In addition, the load and generation data was regionalized, that is, allocated to individual nodes, based in large part on data contained in Germany’s Netzentwicklungsplan.
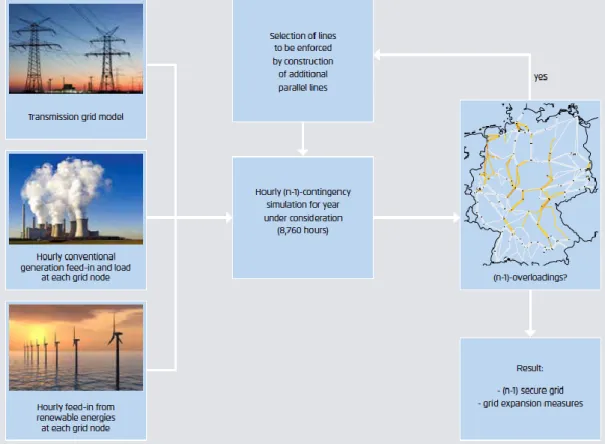
(7) Next, a cost-efficient transmission grid expansion (without bottlenecks) was modelled
using the methodology illustrated in Figure 2.
(8) Investment and associated operating costs for the transmission expansion were developed based on independent research and review of cost assumptions contained in
9 LCOE represents average costs over the lifetime of the generation plant, divided by electricity (kWh) production. Specifically, for electricity produced from renewable resources, the numerator of the LCOE is comprised of investment costs and operating/administration costs. Table 3-3 of the full report presents for each technology the assumed costs, lifetime and weighted average cost of capital.
10 As noted above, imports and exports were not considered in this analysis so the residual load was assumed to be met by German power plants, with the exception of those quantities met through energy efficiency and demand response. 11 For example, a long-term EE/DR potential of 10 GW was modelled for the BAU scenario and 6 GW for the WWF scenario. By 2050, the installed storage capacity in the BAU scenario increases from a current 6.5 GW to 8.5 GW; in the WWF scenario, storage capacity increases to 7.5 GW.
12 Curtailment not only affects the energy fed into the electricity system but also the maximum renewables feed-in capacity that can actually be absorbed by the market. For example, the BAU scenario simulations for 2050 indicate that the curtailment of renewables required to balance the system reduces their maximum feed-in capacity from
approximately 114 GW (before curtailment) to 61 GW. This effect, in turn, has a large impact on the required grid expansion under all scenarios.
7 other grid expansion studies for Germany. Total annual transmission costs and levelized costs per MWh were then calculated for each scenario.
(9) Using the model grid approach illustrated in Figure 3, the required distribution grid expansion was developed for each scenario. This approach used input values that were consistent with the transmission grid modelling, e g., the regionalization of renewable generation maximum feed-in capacities from step 6a.
(10) Similar to the approach taken in step 8, investment, repair and maintenance costs for the distribution expansion plan were developed, and total annual and levelized costs per MWh calculated.
(11) Summing the cost components for generation, transmission and distribution
developed above, total system annual (and levelized) costs were calculated. Comparing these costs between scenarios produced the total value (or “avoided costs”) of
increased end-use energy efficiency to the German power system.
As noted above, three different models were used for the study methodology. The Prognos power system expansion model was used to calculate the conventional power generation required in addition to the generation from renewables. Due to the manageable size of the German transmission grid, an explicit grid model, including lines and stations, could be utilized for this analysis. The IEAW transmission model was used for this purpose. In contrast, due to the large number of different high-, medium-, and low-voltage grids, a model grid approach was used to characterize the grid expansion requirements for the distribution system. A more detailed description of these models, as well as the methodology and input assumptions applied for each of the steps above, is available in the full report.
8
Figure 3. Methodology for modeling distribution grids
Table 4: Assumptions regarding the calculation of total costs of renewable electricity generation
2015 2020 2030 2040 2050
WIND ONSHORE
Investment costs EUR2012/kW 1,560 1,490 1,388 1,362 1,325
WACC in % 6 6 6 6 6
Operating costs % of investment costs 4 4 4 4 4
Annual electricity generation MWh/MW 2,150 2,200 2,300 2,450 2,600
Lifetime Years 20 20 20 20 20
WIND OFFSHORE
Investment costs EUR2012/kW 4,000 3,400 3,100 2,950 2,850
WACC in % 7 7 7 7 7
Operating costs % of investment costs 4 4 4 3 3
Annual electricity generation MWh/MW 4,000 4,100 4,200 4,300 4,300
Lifetime Years 20 20 20 20 20
PHOTOVOLTAICS
Investment costs EUR2012/kW 1,150 1,050 930 785 740
WACC in % 5 5 5 5 5
Operating costs % of investment costs 2 2 2 2 2
Annual electricity generation MWh/MW 930 930 930 930 930
Lifetime Years 20 20 20 20 20
BIOMASS /BIOGAS
Investment costs EUR2012/kW 3,000 2,950 2,850 2,750 2,650
9
2015 2020 2030 2040 2050
Operating costs % of investment costs 3 3 3 3 3
Annual electricity generation MWh/MW 6,500 5,000 4,700 4,700 4,700
Lifetime Years 20 20 20 20 20
Electrical efficiency % 33 33 36 38 38
Fuel prices EUR2012/MWh 23 23 25 26 27
B. Transmission
In order to simulate the need for grid enforcements in the German transmission system it was first necessary to pre-process the input data, consisting of time series for load, generation from the conventional power station fleet, and generation from renewables (RE). In a first step, the generation from renewable sources that – for energy balance reasons - cannot be integrated into the German electricity market and therefore has to be curtailed is determined. The amount of curtailments varies depending on the scenario; it gets as high as 14% of the total available energy from renewables. In terms of power, the curtailment reduces the maximum feed-in power up to 40%, thus impacting the need for grid enforcements significantly.
The generation from photovoltaic (PV), onshore and offshore wind turbine generators is allocated to individual transmission grid nodes, as along with the load and feed-in of conventional power plants.
Based on these inputs, a dedicated transmission grid model is used to quantify the required expansion in the transmission grid. The model was developed by IAEW and uses only public data.13 It is the basis for load-flow simulations in the European transmission grid. The required grid expansion was determined on the assumption that the German network cannot unload loop flows to neighbouring countries or vice versa. The model for Germany comprised a total of about 390 stations and about 600 line corridors. Even though the grid model is only an approximation based on public data, it is sufficiently exact for general load-flow calculations. This was repeatedly proven by comparison with reference load flows published by transmission grid operators.14
The need for grid expansion is driven by grid security requirements. There are several technical prerequisites that need to be considered, including thermal limiting currents, voltage limits, short-circuit current limits and voltage stability limits. As opposed to other analyses - such as the Netzentwicklungsplan - this study exclusively focusses on the criterion of maintaining thermal limiting currents. The thermal limiting current has not only to be maintained for base load, but also in case of failure of any equipment ((n-1) case) in order to prevent cascading faults. In order to determine the need for grid extension an hourly (n-1) contingency simulation is performed and new circuits are added iteratively until reaching an (n-1) secure grid status. The selection of new parallel lines is based on a cost-benefit ratio where the reduction of bottlenecks is a measure of the benefit and line length a measure of costs. This study assumed line construction only parallel to existing corridors. Therefore, the calculations do not include costs for opening up new routes. The construction of HVDC transmission is not included either.
Operational measures such as overhead line monitoring, a short-term allowable increase of current load in the lines due to their thermal inertia and switching operations, can reduce the grid expansion demand. They require, however, specialist knowledge as well as experience on the part of the respective transmission grid operator. Therefore this study uses simplified estimates by applying a softer (n-1) criterion, which allows an overloading of lines for a few hours per year in order to take advantage of these additional degrees of freedom.
13 R. Hermes, T. Ringelband, S. Prousch und H.-J Haubrich: Netzmodelle auf öffentlich zugänglicher Datenbasis, Energiewirtschaftliche Tagesfragen, pp. 76-78, 2009.
14 Deutscher Übertragungsnetzbetreiber. Untersuchung des Einflusses einer erweiterten Marktgebietstrennung in Deutschland auf den europäischen Strommarkt und das kurative Engpassmanagement (Studie 2013).
10 In order to determine the yearly costs for transmission grid infrastructure the annuity costs for the necessary grid expansion measures were calculated and summed with the estimates of the yearly costs for the existing grid and maintenance costs that have been published by the German electric system regulator.15
C. Distribution
The German distribution networks consist of more than one million kilometres of lines and are operated by more than 860 grid operators. Due to these large numbers it is not possible to simulate the required expansion of the distribution grid analogously to the transmission grid individually for each high-, medium- and low-voltage grid. Instead a model grid approach is used for determining the required grid expansion presented by Katzfey et al.16
Based on the curtailed maximum feed-in capacity and the regionalisation of transmission grid nodes, representative model grids consisting of high-voltage (HS), medium-voltage (MS) and low-voltage (NS) grids are defined. The five model grid classes: “largely characterised by wind power”, “characterised by wind power”, “mixed characteristics”, “characterised by PV” and “urban” each represent a group of grids with similar supply tasks. Using the frequency of the occurrence of these grids it is possible to later on extrapolate the expansion demand determined for the whole of Germany.
For the 110 kV high voltage model grids two different, typical synthetic grid models with meshed structures for rural and urban areas are used. The underlying medium voltage grids are modelled as openly operated ring grid networks. This network structure type is very common and constitutes for many grid operators the desired status of their grid as it combines high reliability of supply and fast fault clearance at comparatively low costs. The low voltage grids are modelled as radial structures.
For the actual decision whether a grid expansion is necessary or not, compliance with technical restrictions has to be tested. These vary according to voltage level. At the 110 kV level, the (n-1) criterion is used similar to the transmission grid in order to be able to maintain the technical average operating limits even in case of a fault at a line or transformer. In addition to maintaining the thermal limiting current, the voltage band is tested. The study assumes an allowable voltage band of ± 10 percent as transformers equipped with voltage controls decouple the voltage level from the upstream and downstream voltage level. The required voltage quality sets the limits for this band. As opposed to transmission grids and high voltage grids, the low- and medium-voltage level does not have grid security as its major goal, but rather the supply of the consumers. Therefore, at these voltage levels the (n-1) criterion is not applied. In order to ensure compliance with the thermal limiting current in the analysed open ring grids also after switching, the allowable maximum current was set at 50 percent of the thermal limiting current. The limits for voltage changes result from the BDEW guidelines “Technische Richtlinie - Erzeugungsanlagen im Mittelspannungsnetz” for medium voltage grids and the VDE-Anwendungsregel VDE-AR-N 4105 in case of low voltage grids.
The installed RE capacity in a grid has a significant effect on the required grid expansion demand and is very non-homogeneously distributed over the individual grids. A determination of grid expansion based only on average installed capacity would lead to an underestimation as the correlation between installed capacity and grid expansion demand is largely non-linear. Thus it is possible to integrate a certain amount of RE capacity in each network without triggering the need for grid enforcements. But when integrating large amounts in a few grids a significant need for grid enforcements occurs. Therefore a Monte Carlo simulation is used to determine the expansion demand varying the regional distribution and installed capacity of the distributed generation from RE plants
15 Bundesnetzagentur: Monitoringbericht
2012.http://www.bundesnetzagentur.de/SharedDocs/Downloads/DE/Allgemeines/Bundesnetzagentur/Publikationen/Beri chte/2012/MonitoringBericht2012.pdf.
16 J. Katzfey, W. Nick, A. Moser, H. Schuster, P. Wittenberg, R. Kremp und A. Michels: Abschätzung des EEG-bedingten Ausbaubedarfs in deutschen Verteilungsnetzen bis 2020, ew, S 22.-26,11, 2011.
11 and subsequently calculated the probability-based expectancy value of the grid expansion demand. In addition to the installed capacity, also the spatial distribution of the plants has a significant effect on the grid expansion demand, as a PV plant at the end of a low-voltage feeder is more likely to result in a voltage band violation than a plant at the beginning of the feeder. Therefore a permutation of regional distribution of the capacity in the corresponding model grid is integrated in the Monte-Carlo simulation as well.
Within the Monte-Carlo simulation approach a load flow simulation is carried out after assigning the RES capacity. If the thermal limiting current is violated, iterative lines are added until reaching the limiting value. The same procedure is used in case of voltage limit violations. The last step is to test the electrical feedback into the upstream high-voltage grid and if necessary to add another transformer. As opposed to the methodology applied in the transmission grid, here only one actual point in time is considered instead of 8760 hours. The expansion demand is determined for the maximum generation which is the relevant case for dimensioning a grid with a very large share of renewables. The grid expansion demand resulting from the individual model grid classes and voltage levels is then – based on weighted model grid classes – extrapolated to arrive at a Germany-wide grid expansion demand. The yearly infrastructure costs are determined analogous to the transmission grid cost.
The grid expansion demand determined in this study may be reduced by applying smart-grid technologies, such as on-load tap changers in medium-to-low-voltage substations or new voltage-control concepts that in return result in investment costs, though. Curtailment or restricting the feed-in capacity of distributed generation plants would allow for a further reduction. However, the analysis of these technologies is beyond the scope of this study.
V. Study Results
In the sections below we separately present and discuss the impact of efficiency investments on the costs associated with each of the different components of electric system (generation,
transmission and distribution), as well as its combined or total impact on the German electric system.
A. Generation Costs
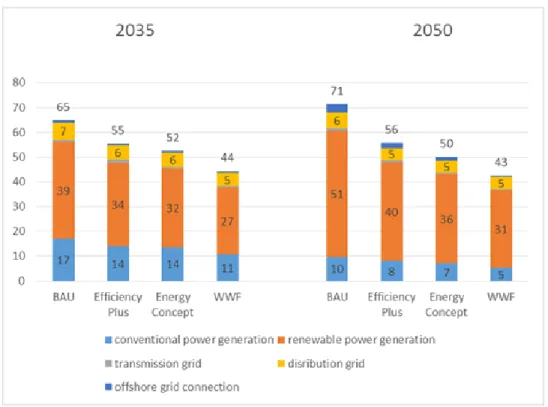
As shown in Figure 4, increasing levels of energy efficiency would have a substantial and beneficial impact on the costs of electricity production in Germany. For example, relative to the BAU scenario, the level of increased efficiency associated with the German government’s “Energiewende” policy – what we call the “Energy Concept” scenario – would reduce annual generation costs by €10 billion in 2035 (from €56 to €46 billion) and by €18 billion in 2050 (from €61 to €43 billion). The cost savings are even greater under the more aggressive WWF scenario’s levels of increased efficiency – €17 billion saved in 2035 and €25 billion saved in 2050.
Most of the cost savings under the Energy Concept scenario – roughly 70% in 2035 and 80% in 2050 – are the result of reduced need for investment in renewable energy production. As noted above, all of the scenarios assume that same portion of demand will be met with renewable resources (gradually increasing to 81% by 2050). However, that percentage is obviously applied to lower levels of demand under scenarios with greater levels of electric efficiency. As a result, the system is able to avoid investing in the most expensive renewables. In 2035, most of the renewable generation under the BAU scenario is forecast to be provided by PV and onshore wind; offshore wind plays a relatively small role. Thus, most of the renewable energy cost savings under all the efficiency scenarios, including Energy Concept, are estimated to come from less PV and less onshore wind. Between 2035 and 2050, most of the additional investment in renewable generation under the BAU scenario is forecast to come from offshore wind. Thus, in 2050, most of the renewable generation cost savings under all the efficiency scenarios (nearly 60% of the renewable cost savings under the
12 Energy Concept scenario) is forecast to come from lower investment in offshore wind.
Figure 4: Annual Costs of Electricity Production (Billions 2012 Euros)
B. Transmission Costs
The principal impact of increased levels of end use efficiency on the transmission system is a reduction in the investment required for new transmission lines. By 2035, an estimated 4620 km of new transmission lines would be needed under the BAU scenario. That number grows to 8536 km of by 2050, with most of the need driven by substantial expansion of offshore wind generation. Under the most aggressive efficiency scenario – WWF – roughly three-quarters of those needs would be eliminated.
The reduction in transmission costs are also substantial. Under the WWF scenario, the cost savings are €0.9 billion (roughly a 40% reduction) in 2035 and grow to €3.2 billion (more than 70% reduction) in 2050. Roughly 80% of those savings are associated with reductions in offshore wind grid connection costs.
C. Distribution Costs
As with transmission, the impact of increased levels of end use efficiency on the distribution system is a reduction in the investment required for new lines and related infrastructure. Under the WWF scenario, distribution system costs are reduced by about 20% relative to the BAU scenario. That translates to €1.5 billion cost savings in 2035 and €1.3 billion cost savings in 2050.
D. Combined Impacts
The combined effect of all of these savings is quite substantial. As Figure 5 shows, the level of increased efficiency under the Energy Concept scenario would lead to about a 20% reduction in total electric system cost in 2035 (€13 billion) and a 30% reduction in 2050 (€21 billion). The majority of the savings in all years are associated with reduction in power generation costs, with most of that (particularly in 2050) being reduction in renewables generation.
13
Figure 5: Total Annual Electric System Costs (Billions of 2012 Euros)
Dividing those economic benefits by the magnitude of the energy savings required to produce them yields an economic value per kWh saved through efficiency.17 Deriving that value was the ultimate goal of this study. As Figure 6 shows, the value of electric end use savings in Germany is quite substantial, ranging from €114 to €149 per MWh (11.4 to 14.9 euro-cents/kWh) in 2035 to between €121 and €142 per MWh (12.1 to 14.2 euro-cents/kWh) in 2050.
Figure 6: Value of Electricity Savings (2012 €/MWh)
One of the key purposes of computing the system benefits per MWh saved was to provide a benchmark against which the costs of any efficiency investments should be compared. For example,
17 For example, under the Energy Concept scenario in 2050, the €20.8 billion in cost reductions relative to the BAU scenario shown in Figure 5 are divided by 154 TWh of reduced consumption relative to the BAU scenario shown in Figure 1 to derive the estimated system benefit of €135 per MWh saved shown in Figure 6.
14 if the levelized annual system benefit per MWh saved is €134,18 then all efficiency investments which cost less than that would be cost-effective.19
It was beyond the scope of this study to assess the costs of the level of efficiency investments associated with each of the efficiency scenarios analyzed. However, we would expect there to be substantial levels of energy savings that can be acquired at costs that are lower – potentially substantially lower – than the benefits found in this study. Indeed, a recent U.S. study published by the American Council for an Energy Efficient Economy (ACEEE) found that the average electric utility cost of acquiring savings across twenty different states with energy savings obligations was just 2.8 U.S. cents per kWh (about 2.1 euro-cents per kWh).20 Data from a subset of seven of those states suggested that the average total cost of the savings – utility cost plus participant costs – was 5.4 U.S. cents per kWh (about 4.0 euro-cents per kWh).21 As one might expect, the costs of savings appears to be higher in states with the most aggressive savings. For example, in New England, where several states now have annual electric savings targets of 2.0% of sales or greater, the 2012 levelized utility cost of acquiring savings ranged from 3.1 to 4.6 U.S. cents per kWh (2.3 to 3.4 euro-cents per kWh).22 That is 10% to 60% higher than the national average reported by ACEEE. However, those costs are still well below the value of the system benefits found in this study for Germany. Similarly, a study of efficiency potential in Belgium found that the theoretical energy savings potential for buildings and industry was 45% and 21%, respectively, of forecast “business as usual” consumption in 2030,23 and that that more than 90% of that potential had a cost of less than 2.4 U.S. cents per kWh equivalent (1.8 euro-cents per kWh).24 Needless to say, there would be value in an analysis that quantified the cost of energy savings potential in Germany to confirm our expectation that the electric system benefits of efficiency found in this study would outweigh the costs, with potentially substantial net benefits accruing to the German economy.
One final study result worth noting is that the percentage reduction in electric system costs resulting from increased efficiency was generally equal to or greater than the reduction in consumption. As a result, as Figure 7 shows, in 2035 the total cost per kWh of remaining demand was estimated to be slightly lower under most of the efficiency scenarios than in the BAU scenario; in 2050, the total cost per kWh of remaining demand was estimated to be slightly lower under all of the efficiency scenarios than under the BAU scenario.
18 We have not computed the levelized annual system benefit. €134 is simply the average of the Energy Concept values for 2035 and 2050, and is used here for illustrative purposes. When screening for cost-effectiveness of an efficiency measure or program or set of policies one should use the actual annual values for every year during which the measure or program would produce savings to assign an economic value to those savings.
19 Note that this is a simplified statement because it focuses only on the beneficial impacts of efficiency on the electric system. Efficiency investments often have additional, substantial, non-energy benefits such as improved comfort, increased building durability, improved business productivity, etc. Those additional benefits should ideally also be included in any societal cost-effectiveness screening of efficiency investments.
20 Molina, Maggie, The Best Value for America’s Energy Dollar: A National Review of the Cost of Utility Energy Efficiency Programs, published by the American Council for an Energy Efficient Economy (ACEEE), Report Number U1402, March 2014.
21 The utility cost is just the cost that the utility pays to acquire savings under an energy savings obligation scheme. For example, if a utility offered consumers a $100 rebate on an efficiency measure that cost $300, the utility’s cost would be the $100 plus whatever non-rebate costs it incurred to market, evaluate and administer the program. The total cost would be $300 plus the utility’s marketing, evaluation and administration costs. The total cost is sometimes referred to as the Total Resource Cost or Societal Cost in the U.S.
22 See the “cost of saved energy” tab of the Northeast Energy Efficiency Partnerships’ Regional Energy Efficiency Database (http://www.neep-reed.org/Focus.aspx). Note that these are only utility costs. Data on total costs, including efficiency program participant costs, are not readily available.
23 McKinsey & Company, Pathways to World-Class Energy Efficiency in Belgium, 2009, Exhibit 3. 24 McKinsey & Company, Pathways to World-Class Energy Efficiency in Belgium, 2009. Exhibit 4.
15
Figure 7: Total Cost per Unit of Electric Demand (2012 €/MWh)
VI. Conclusions
This study affirms what the research and evaluation community have long understood and what international experience has demonstrated: namely, that comprehensive, long-term, and aggressive investment in end-use energy efficiency in Germany will yield huge power sector cost savings. The value of these savings, in levelized costs, is in the range of € 0.11-0.15 per kilowatt-hour. This means that there are likely to be substantial opportunities to invest in cost-effective efficiency. If other studies and international experience are indicative of what can be accomplished in Germany, the costs of efficiency investments will run in the range of one-third to one-half of the benefits of efficiency. Put another way, the net economic benefits from energy efficiency are likely to be huge.
Estimates of the magnitude of those net benefits will require additional analyses, ones in which the total costs of the requisite energy efficiency programs are netted against the gross power system savings that the programs achieve. Armed with that information, policymakers can then begin the task of determining where, when, and to what degree investment in energy efficiency should be made in Germany.
VI. References
BDI, McKinsey 2007. Kosten und Potenziale der Vermeidung von Treibhausgasemissionen in Deutschland.
Bundesnetzagentur. 2012. Monitoringbericht.
http://www.bundesnetzagentur.de/SharedDocs/Downloads/DE/Allgemeines/Bundesnetzagentur/Publ ikationen/Berichte/2012/MonitoringBericht2012.pdf.
The Coalition for Energy Savings. 2014. Implementing the EU Energy Efficiency Directive: Analysis of Article 7 Member States reports.
119 115 116 121 122 118 119 118 0 20 40 60 80 100 120 140 BAU Efficiency Plus Energy Concept WWF BAU Efficiency Plus Energy Concept WWF
2035 2050
16 Deutscher Übertragungsnetzbetreiber. 2013. Untersuchung des Einflusses einer erweiterten Marktgebietstrennung in Deutschland auf den europäischen Strommarkt und das kurative Engpassmanagement.
European Climate Foundation April 2010. Roadmap 2050: A Practical Guide to a Prosperous, Low-Carbon Europe, Vol. I: Technical Analysis.
European Commission. Energy: Article 7 Notifications.
http://ec.europa.eu/energy/efficiency/eed/article7_en.htm.
Hermes, R., T. Ringelband, S. Prousch und H.-J Haubrich. 2009. Netzmodelle auf öffentlich zugänglicher Datenbasis, Energiewirtschaftliche Tagesfragen.
IFEU, Fraunhofer ISI, Prognos, GWS, et al. 2011. Energieeffizienz: Potenziale, volkswirtschaftliche Effekte und innovative Handlungs- und Förderfelder für die Nationale Klimaschutzinitiative (NKI). IZES, BEI, Wuppertal Institut 2011. Erschließung von Minderungspotenzialen spezifischer Akteure, Instrumente und Technologien zur Erreichung der Klimaschutzziele im Rahmen der Nationalen Klimaschutzinitiative (EMSAITEK).
Katzfey, J., W. Nick, A. Moser, H. Schuster, P. Wittenberg, R. Kremp und A. Michels. 2011. Abschätzung des EEG-bedingten Ausbaubedarfs in deutschen Verteilungsnetzen bis 2020.
McKinsey & Company. 2009. Pathways to World-Class Energy Efficiency in Belgium.
Molina, Maggie. March 2014 The Best Value for America’s Energy Dollar: A National Review of the Cost of Utility Energy Efficiency Programs. Published by the American Council for an Energy Efficient Economy (ACEEE), Report Number U1402.
Northeast Energy Efficiency Partnership. Regional Energy Efficiency Database. http://www.neep-reed.org/Focus.aspx.
Prognos, EWI, GWS. 2010. Energieszenarien für ein Energiekonzept der Bundesregierung.
Prognos, Institut für Elektrische Anlagen und Energiewirtschaft. March 2014. Benefits of Energy Efficiency on the German Power Sector. Published by Agora Energiewende, the European Climate Foundation, and the Regulatory Assistance Project.
http://www.raponline.org/document/download/id/7095.
Prognos, Öko-Institut, Ziesing. 2009. Modell Deutschland - Klimaschutz bis 2050. Im Auftrag des WWF.