Procedia Computer Science 22 ( 2013 ) 104 – 112
1877-0509 © 2013 The Authors. Published by Elsevier B.V. Selection and peer-review under responsibility of KES International doi: 10.1016/j.procs.2013.09.086
ScienceDirect
17th International Conference in Knowledge Based and Intelligent Information and Engineering Systems - KES2013
Development
of Customer Satisfaction Models for Affective
Design Using Rough Set and ANFIS Approaches
Huimin Jiang
a,*, C.K. Kwong
a, M.C. Law
b, W.H. Ip
aaDepartment of Industrial and Systems Engineering, The HongKong Polytechnic University, Kowloon, Hong Kong, China bG.E.W. Corporation Ltd., Hong Kong, China
Abstract
Rough set (RS)- and particle swarm optimization (PSO)- based adaptive neuro-fuzzy inference system (ANFIS) approaches are proposed to generate customer satisfaction models in affective design that address fuzzy and nonlinear relationships between affective responses and design attributes. The RS theory is adopted to reduce the number of fuzzy rules generated using ANFIS and simplify the structure of ANFIS. PSO is employed to determine the parameter settings of an ANFIS from which customer satisfaction models with better modeling accuracy can be generated. A case study of mobile phone affec-tive design is used to illustrate the proposed approaches.
© 2013 The Authors. Published by Elsevier B.V.
Selection and peer-review under responsibility of KES International.
Keywords:Affective design; Customer satisfaction; Rough set theory; Particle swarm optimization; ANFIS.
1.Introduction
Affective design has been shown to excite psychological feelings of customers and can help improve the emotional aspects of customer satisfaction. Design attributes, such as shape and color, evoke the affective re-sponses of customers to products. Products with good affective design can help attract customers and influence their choices and preferences, such as loyalty and joy of use [1] [2]. The process of affective design includes identifying, measuring, analyzing, and understanding the relationship between the affective needs of the cus-tomer domain and the perceptual design attributes in the design domain [3].
* Corresponding author. Tel.: +852-95379360; fax: +852-23625267. E-mail address: [email protected].
© 2013 The Authors. Published by Elsevier B.V.
Selection and peer-review under responsibility of KES International
Open access under CC BY-NC-ND license.
In today’s competitive marketplace, a key issue is how the optimal settings of new product design attributes can be determined such that high, or even optimal, customer satisfaction of new products can be obtained. Cus-tomer satisfaction models that relate affective responses of cusCus-tomers to design attributes need to be developed first to achieve these settings. Kansei engineering [4] was developed as a consumer-oriented method for affec-tive product design to translate customer psychological feelings and image into design elements of a new prod-uct. Artificial intelligence-based fuzzy techniques have been used to address the fuzziness and nonlinearity of affective modeling. Hsiao and Tsai [5] proposed a method that enables an automatic product form or product image evaluation via neural network-based fuzzy reasoning and genetic algorithms (GA). The method was then applied to establish relationships between design attributes of a new product and customer affective image. Park and Han [6] proposed a fuzzy rule-based approach to examine customer satisfaction levels towards office chair designs. They reported that the fuzzy rule-based approach outperformed the multiple linear regression approaches in terms of the number of design attributes to be considered in modeling. A fuzzy expert system with gradient descent optimization was proposed to develop models that relate affective responses to customer satisfaction for fashion product development [7]. Chan et al. [8] introduced genetic programming into fuzzy regression for affective product design. The limitation of this approach is that the size of search space increases exponentially with the number of nodes and the tree depth. An adaptive neuro-fuzzy inference system (ANFIS) was examined by Kwong and Wong [9] to generate nonlinear and explicit customer satisfaction models. The conventional learning algorithms for ANFIS are gradient descent, in which the calculation of gradients in each step is difficult and the use of chain rules may cause a local minimum. These issues have been proven to affect modeling accuracy. On the other hand, ANFIS is not suitable for problems with several inputs. If the number of inputs is large, the number of generated fuzzy rules increases exponentially. These increases would cause long running-time and even execution errors. To overcome these limitations, rough set (RS)- and particle swarm optimization (PSO)- based ANFIS approaches to modeling customer satisfaction are proposed, by which sur-vey data fuzziness and modeling nonlinearity can be addressed, and explicit models for relating customers’ affective responses and design attributes can be generated. In this paper, Section 2 first describes the proposed methodology. In Section 3, a case study of mobile phone design is described to illustrate the proposed ap-proaches. The validation of the proposed approaches is shown in Section 4. Finally, conclusions are given in Section 5.
2. Modeling Customer Satisfaction Using RS- and PSO- based ANFIS
In the proposed approaches, the RS theory is introduced to determine indispensable design attributes for generating customer satisfaction models. The PSO- based ANFIS approach is introduced to develop nonlinear customer satisfaction models, in which PSO is used to determine the optimal values of antecedent parameters in membership functions, such that the errors between the predictive customer satisfaction and the actual cus-tomer satisfaction values can be minimized.
2.1.ANFIS structure
ANFIS is a multilayer feed-forward network in which the neural network is regarded as the learning algo-rithm. Fuzzy reasoning is used to map inputs into output [10]. Figure 1 shows the architecture of a typical ANFIS with two inputs and one output, where each input is assumed to have two linguistic descriptions.
If both inputs, x1and x2, have two linguistic descriptions (e.g., low and high), a membership function is used to represent each description. Hence, Pi( )x1 denotes the membership function for the i th linguistic de-scription of x1, and Oj( )x2 denotes the membership function of the j th linguistic description of x2, where
1, 2
Fig. 1. An ANFIS with four layers and two inputs 1 1 1 1 1 ( ) 0 i i i i i i i i i i i x a a x b b a c x x b x c c b Otherwise P d d ° ° ° d d ® ° ° ° ¯ and 2 2 2 2 2 ( ) 0 j j j j j j j j j j j x s s x t t s u x x t x u u t Otherwise O d d ° ° ° ° d d ® ° ° ° °¯ (1)
where ( , , )a b ci i i and ( , , )s t ui i i are triangular fuzzy numbers and are referred as antecedent parameters.
At L2, one rule is used to denote the outcome for each combination of x1 andx2. Hence, the total number of rules is 2×2 = 4. The fuzzy rules can be generally expressed as follows:
1 2 1 2
: ,
ij i j ij ij ij ij
R IF x isP AND x isO THEN f p x q x r (2)
where pij, qij, and rij are the parameters of the internal models fij of the fuzzy rulesRij. These parameters are
consequent parameters. The outputs of this layer are described as follows:
ݓൌ ߤሺݔଵሻ ή ߣሺݔଶሻሺ݅ ൌ ͳ ǥ ʹǡ ݆ ൌ ͳ ǥ ʹሻ (3)
where wij represents the firing strength of each fuzzy rule. The firing strength indicates the degree to which Rij
is satisfied. The connection weight between L2 and L3 is wij, as defined by (4), which is the normalized firing
strength. This relationship means that the larger the value of wij, the more significant Rij becomes.
ij ( 1...2, 1...2) ij ij i j w w where W w i j W
¦¦
(4)At L3, the internal model of Rij is a first-order Sugeno fuzzy model [11], as defined by (5).
fij p xij 1q xij 2rij ( i 1...2,j 1...2) (5)
At L4, a single node is used to compute the overall output as the summation of all incoming signals. The mathematical formulation of the node is defined by (6).
(6) From (6), a single output (y) of an ANFIS is the linear combination of all normalized firing strengths and the corresponding internal models of all the fuzzy rules. The learning algorithm of an ANFIS is to determine the parameters ( , , )a b ci i i , ( , , )s t ui i i , and ( , , )p q rij ij ij , such that the error between the ANFIS output and the train-ing data can be minimized.
ൌ ܱ ଶ ୀଵ ଶ ୧ୀଵ ൌ ݓഥή ݂ ଶ ୀଵ ଶ ୧ୀଵ ൌ ݓഥή ሺݔଵ ݍݔଶ ݎሻ ଶ ୀଵ ଶ ୧ୀଵ
2.2.Determination of inputs for ANFIS using RS method
Attribute reduction is a process of finding an optimal subset of all attributes following certain criteria so that the attribute subset is sufficient to represent the classification relation of data. A proper choice of attribute sub-sets can reduce the input number of ANFIS, simplify the structure, and shorten computational time. The RS theory was proposed by Pawlak [12]. The basic philosophy behind the RS theory is based on equivalence rela-tions or indiscernibility in the classification of objects.
A design table with 4-tuple can be expressed as S ( , , , )U Q V U , where Uis the universe that is a finite and non-empty set of objects. Qis a finite set of attributes. V q Q Vq, where Vqis a domain of the attribute q.
:U Q V
U u o is the information function, such that U( , )s q Vq for every q Q ,s U , and ( , )q v . q Q and q
v V are descriptions ofS.
Assuming a subset of the set of attributes,R Q , two objects, x y U, , are indiscernible with respect to R if and only if U( , )x r U( , )y r for r R. The indiscernibility relation, which is the equivalence relation defined
on set U, is written as ind R( ). ind R( ) partitions the universe Uinto disjoint subsets, and U ( )
ind R is used to denote these partitions of U. The lower and upper approximation of a set YU can be defined as follows:
= {X:X U ( ), }
RY ind R XY (7)
= {X:X U ( ), }
RY ind R XY zI (8) where RY consists of all objects in Uthat certainly belong to Y, and RYconsists of all objects in Uthat
possi-bly belong to Yunder the equivalent relation R. Elements belonging only to the upper approximation compose
the boundary region BN, or the doubtful area. BN represents the area that cannot be classified into Yor to its
complement. Mathematically, a boundary region can be expressed as: ( )
BN Y RY RY (9) The positive region Pos YR( ) and the negative region Neg YR( ) of Yon R are defined as follows:
( ) R Pos Y RY (10) ( ) ( ) R R Neg Y U Pos Y (11) In attribute reduction, redundant attributes are removed, and the important attributes are retained as the in-dispensable information used to evaluate the relationship between affective responses and design attributes. Based on the above definitions, attribute reduction is defined as follows:
If Ris a set of equivalent relation,rR, and Pos YR( )zPosR{ }r( )Y , namely, ind R( )zind R( { })r , Ris the
independent attribute and r is the indispensable attribute in R, otherwise ris dispensable.
If Ris independent, RP and ind R( ) ind P( ), R is a reduction of P, R RED P ( ). RED P( ) represents the set of all the attribute reductions of P.The intersection of RED P( )is the core of P, which is expressed as
( )
Core P .
2.3.Determination of ANFIS parameter settings using PSO and LSE
The learning algorithm of an ANFIS aims to determine the antecedent and consequent parameters, such that the error between the ANFIS outputs and the actual data can be minimized. In the forward pass, the antecedent parameters are fixed, and the input signals go forward to calculate each node output. The consequent parame-ters are then determined using the least square estimation (LSE) method. In the backward pass, the error rates propagate backward, and the antecedent parameters are updated. The conventional algorithm for updating the antecedent parameters is the gradient descent method. In the gradient descent method, the determination of the best learning rate is very difficult, and the convergence of parameters is slow. In this study, a PSO algorithm is
introduced to determine and update the antecedent parameters. PSO does not rely on the learning rate and has been demonstrated to have fast convergence.
A swarm is composed of mparticles flying in the N dimension in a certain speed. Every particle changes its position based on considering its own historical best position and other particles’ historical best position. The position and the speed for the i th particle is xi ( ,x xi1 i2,...,xid) and vi ( ,v vi1 i2,...,vid) , respectively, where 1d di m, 1dddN andN is the dimension of the search space as well as the number of antecedent parameters. The historical best position of the i th particle, which has the minimum fitness value, is pi (p pi1, i2,...,pid).
The best position for the whole swarm is pg (pg1,pg2,...,pgd). The final result of pg denotes the optimal
val-ues of the antecedent parameters. The process of updating the speed and the position of the particle based on the idea of inertia weight [13] is expressed as follows:
1 1 1( ) 2 2( ) k k k k k k i i i i g i v Zv c r p x c r p x (12) 1 1 k k k i i i x x v (13) where k i v and k i
x are the speed vector and the position vector, respectively, of the i th particle at the k th it-eration. k is the number of iterations. Z is the inertia weight, the value of which decides the quantity inherited from the current speed of the particle. c1 and c2 are learning factors and are usually set as 2. The values of r1 and r2 are randomly chosen from the range
> @
0,1 .2.4.Processes of modeling customer satisfaction using RS- and PSO- based ANFIS approaches
The processes of modeling customer satisfaction for affective design based on the proposed approaches are shown as follows:
Step 1: A customer survey is designed and conducted to obtain affective responses of customers on products. Step 2: Once survey data is obtained, RS theory is introduced to identify redundant attributes and generate a list of attribute reductions. Then, the number of each design attribute appearing in the list is calculated, which reflects the importance of each design attribute. Important design attributes are then selected as the inputs of PSO- based ANFIS.
Step 3: Using the extracted design attributes as the inputs, the ANFIS is trained by the hybrid learning algo-rithm of PSO and LSE. The initialization for a particle swarm is first conducted, including the iteration number, swarm size, search space dimension, search range, and learning factors. The speed and position of every parti-cle are initialized randomly. In the first iteration, the initial position of every partiparti-cle is used as the initial indi-vidual best positionpi, and the position vector of each particle is used as the antecedent parameters of ANFIS
in sequence. The initial iteration is followed by calculating the values of membership functions Pi and Oj, the
firing strength wij, and the normalized firing strength wij using (1), (3) and (4). Based on the input data sets
and the initial values of the consequent parameters, the values of the fuzzy rule fij are determined based on (5).
Therefore, the outputs of all nodes reach L4. The final output y is then obtained using (6). LSE is used to
iden-tify the consequent parameters Tand then the value of the predictive output y is computed. Next, the mean absolute error (MAE) between the model output y and the actual survey data for the i th particle is calculat-ed. MAE is also the fitness value 1
i
MAE of the i th particle in the first iteration. 1 i
MAE is recorded as the ini-tial individual best fitness value pi. The particle that has the smallest value in
1 i
MAE is selected as the best particle. The particle’s position vector is defined as the initial global best position pg, and its fitness value is
defined as the initial global best fitness value. The iteration is continued. The speed vector vi and the position
vector xi for each particle are updated based on (12) and (13), respectively. Then, the k i
MAE of the i th parti-cle in the k th iteration is calculated based on the updated particle positions. The current k
i
MAE is compared with pi for each particle. If the value of
k i
MAE is smaller thanpi, the individual best fitness value is set as the
value of k
i
MAE , and the particle’s individual optimal position, along with its new position are updated. The iteration stops when the pre-defined number of iterations is satisfied. The global best fitness value is updated by
selecting the smallest value in pi. The number of the best particle is then recorded. The global best position g
p is decided as the position of the selected best particle. The values of pg are the identified antecedent
pa-rameters, and the values of T are the identified consequent parameters.
Step 4: Based on the antecedent and consequent parameters, the customer satisfaction models can be ob-tained using(1), (3), (4), (5), and (6). The fuzzy rules are generated based on (2).
3.Case Study
A case study of mobile phone design is used in this study to illustrate the proposed approaches to model the relationships between affective responses and design attributes. A total of 32 mobile phones of various brands were selected. Morphological analysis was used to study the representative attributes of mobile phones as nu-merical data sets. Nine representative design attributes: top shape, bottom shape, side shape, function button shape, number buttons style, screen size, thickness, layout, and weight, are denoted as x1,x2,x3,x4,x5,x6,x7,x8, and x9, respectively. Each design attribute has various alternatives. The affective dimension, simple-complex (S-C), was used to evaluate the affective design of the mobile phones. A survey was conducted using a ques-tionnaire, in which a five-point scale was used to assess the mobile phone appearance based on the affective dimension.
Based on the survey data, RS based on Rosetta software, which is a table logical data analysis toolkit, was used to extract indispensable design attributes. The set of attribute reductions for S-C was obtained from the software. The numbers for design attributes A A A A A A A A A1, , , , , , , ,2 3 4 5 6 7 8 9are 14, 11, 18, 13, 9, 19, 14, 10, and 17, respectively. Based on the numbers, the ranking of importance of the design attributes is
6 3 9 7 1 4 2 8 5
A !A !A !A A!A !A !A !A. The first two design attributes in the ranking, A3and A6, are selected as the inputs.
Both inputs have three linguistic descriptions: small, medium, and large. Therefore, six sets of the anteced-ent parameters ^a b ci, ,i i` are available, and the number of antecedent parameters to be identified is 6×3=18. The
number of fuzzy rules is 3×3=9, and the number of consequent parameters to be trained is 9×3=27. The size of the particle swarm is set as 30, and the dimension of the search space for PSO is 18. The iteration number is determined as 200 through the repeated operations to make sure that the least number of the iteration and prop-er search range can be obtained. The values of the inprop-ertia weight w are chosen randomly in the range
>
0.1,0.9@
. The proposed approaches were implemented using the Matlab software package to generate models that relate S-C and the two design attributes. As the PSO- based ANFIS is a stochastic method, 30 runs on the proposed approaches were conducted, and the mean of the 30 runs was calculated. To evaluate the effectiveness of the proposed approaches, the modeling results based on the proposed approaches are compared with those based on fuzzy least-squares regression (FLSR), fuzzy regression (FR), and genetic programming-based fuzzy regression (GP-FR). MAE and mean absolute deviation (MAD) are adopted to compare the modeling results , as defined by (14) and (15), respectively.(14) (15)
where t is the number of data sets. yk
is the k th predictive output based on the identified model, and yk is
the k th actual output based on the survey data.
The same survey data was used to develop an ANFIS model. However, the training process of ANFIS was failure and ‘out of memory’ error occurred because its structure was too complex. The same survey data was
ܯܣܧ ൌͳ ݐ ȁݕෞ െ ݕ ȁ ݕ ή ͳͲͲ ௧ ୀଵ ܯܣܦ ൌ ͳ ݐ െ ͳ ቆ ȁݕෞ െ ݕ ȁ ݕ ή ͳͲͲ െ ܯܣܧቇ ଶ ௧ ୀଵ
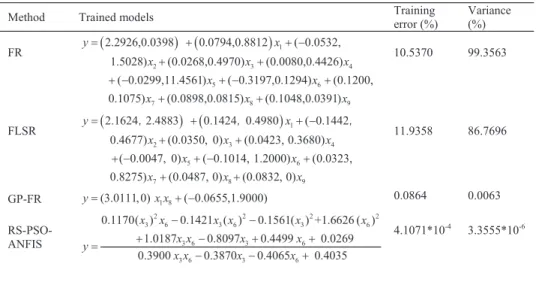
also used to develop the models based on the proposed approaches, FLSR, FR and GP-FR approaches for S-C. The developed models, training errors, and MAD are shown in Table 1. The table shows that the values of
MAE and MAD based on the proposed approaches are the smallest compared with those based on the other three approaches. This observation indicates that the models based on the proposed approaches are better to fit the survey data sets.
Table 1. Training results and models of the four modeling methods.
4.Validation of the Proposed approaches
A total of 30 validation tests were conducted to further evaluate the effectiveness of the proposed methodol-ogy. In each validation test, five data sets are randomly selected from the 32 data sets as the testing data sets, and the remaining 27 data sets are used to develop the customer satisfaction models. The validation tests pri-marily aim to compare the validation errors of the generated customer satisfaction models based on the RS- and PSO- based ANFIS approaches with those based on FLSR, FR, and GP-FR.
In this study, the threshold level of FLSR was set as 0.9. The threshold level of FR was set as 0.9. The popu-lation size and the number of iteration were set as 40 and 200, respectively. The generation gap, crossover probability, and mutation probability were set as 0.8, 0.7, and 0.3, respectively. The maximum depth of tree was set as 5. The parameter settings of the generated models based on the proposed approaches are shown in Section 3. Considering that GP-FR and the PSO- based ANFIS are stochastic algorithms, 30 runs were carried out for each validation test, and the mean validation errors were calculated. The validation errors and MAD
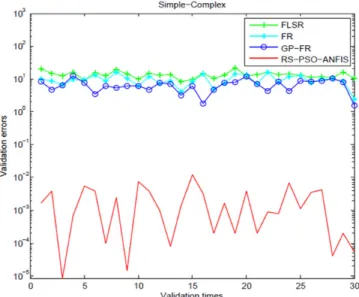
were obtained using (14) and (15). The 30 validation results for S-C models based on the four methods are shown in Figure 2. The lines with ‘+’, ‘*’, ‘O’, and the solid line ‘-’ denote the validation results of the FLSR, FR, GP-FR, and the proposed approaches, respectively. The prediction errors of the customer satisfaction mod-els based on the proposed approaches are the smallest. The mean validation errors and the mean MAD for the affective response S-C based on the four methods are shown in Table 2. Based on the table, it can be seen that the proposed approaches outperform the other three approaches in terms of mean validation errors and mean
MAD.
Method Trained models Training error (%) Variance (%)
FR 1 2 3 4 5 6 7 8 9 2.2926,0.0398 0.0794,0.8812 ( 0.0532, 1.5028) (0.0268,0.4970) (0.0080,0.4426) ( 0.0299,11.4561) ( 0.3197,0.1294) (0.1200, 0.1075) (0.0898,0.0815) (0.1048,0.0391) y x x x x x x x x x 10.5370 99.3563 FLSR 1 2 3 4 5 6 7 8 9 2.1624 2.4883 0.1424 0.4980 ( 0.1442 0.4677) (0.0350, 0) (0.0423, 0.3680) ( 0.0047, 0) ( 0.1014, 1.2000) (0.0323, 0.8275) (0.0487, 0) (0.0832, 0) y x x x x x x x x x 䯸 䯸 䯸 11.9358 86.7696 GP-FR y (3.0111,0)x x1 8 ( 0.0655,1.9000) 0.0864 0.0063 RS-PSO-ANFIS 2 2 2 2 3 6 3 6 3 6 3 6 3 6 3 6 3 6 0.1170( ) 0.1421 ( ) 0.1561( ) +1.6626 ( ) 1.0187 0.8097 0.4499 0.0269 0.3900 0.3870 0.4065 0.4035 x x x x x x x x x x y x x x x 4.1071*10-4 3.3555*10-6
Fig. 2. Validation results of the models for S-C Table2. Mean validation errors and mean absolute deviation based on the four methods
Validation error FR FLSR GP-FR RS-PSO-ANFIS
MAE(%) 9.5727 13.5352 6.7991 0.0024
MAD(%) 83.2105 74.5989 35.8331 4.7686*10-5
5.Conclusion
In this paper, RS- and PSO- based ANFIS approaches to model customer satisfaction are proposed and de-scribed. In the proposed approaches, the RS method is introduced to determine the indispensable information and redundant attributes. PSO is employed to determine the parameter settings of the ANFIS from which better customer satisfaction models can be generated in terms of modeling accuracy. On the other hand, the proposed approaches can solve the computational problems of ANFIS as mentioned in Section 1 when the number of inputs to the ANFIS is large. The generated customer satisfaction models are explicit and capable of addressing the nonlinearity and fuzziness that existed in modeling.
A case study of the affective product design of mobile phones was used to illustrate and validate the pro-posed approach. The affective dimension, S-C, was considered. A total of 30 validation tests were conducted to evaluate the effectiveness of the proposed approaches. From the training and validation results, the smallest training errors and validation errors are obtained based on the proposed approaches compared with those based on the FLSR, FR, and GP-FR. Future work will involve a study of determining optimal settings of design at-tributes based on the generated customer satisfaction models. On the other hand, outliers may exist in the sur-vey data sets. Thus, detection and elimination of outliers can be conducted for improving the quality of the survey data.
Acknowledgements
The PhD work described in this paper was fully supported by a grant from The Hong Kong Polytechnic University.
References
[1] Creusen, M. E. H., Schoormans, J. P. L., 2005. The Different Roles of Product Appearance in Consumer Choice. Journal of Product Innovation Management 22, p.63-81.
[2]Noble, C. H., Kumar, M., 2008. Using product design strategically to create deeper consumer connections. Business Horizons 51, p.
441-450.
[3]Lai, H. H., Chang, Y. M., Chang, H. C., 2005. A robust design approach for enhancing the feeling quality of a product: a car profile
case study. International Journal of Industrial Ergonomics 35, p. 445-460.
[4]Nagamachi, M., 1995. Kansei engineering: a new ergonomic consumer-oriented technology for product development. Applied
Ergonomics33, p. 3–11.
[5]Hsiao, S.W., Tsai, H.C., 2005. Applying a hybrid approach based on fuzzy neural network and genetic algorithm to product form
design. International Journal of Industrial Ergonomics 35, p. 411–428.
[6]Park, J., Han, S.H., 2004. A fuzzy rule-based approach to modeling affective user satisfaction towards office chair design. International
Journal of Industrial Ergonomics34 , p. 31–47.
[7]Lau, T.W., Hui, P.C.L., Ng, F.S.F., Chan, K.C.C., 2006. A new fuzzy approach to improve fashion product development. Computers in
Industry 57, p. 82–92.
[8]Chan, K.Y., Kwong, C.K., Dillon, T.S., Fung, K.Y., 2011. An intelligent fuzzy regression approach for affective product design that
captures nonlinearity and fuzziness. Journal of Engineering Design 22, p. 523-542.
[9]Kwong, C.K., Wong, T.C., 2008. “A neuro-fuzzy approach to generating customer satisfaction model for new product development,”
IEEE International Conference on Industrial Engineering and Engineering Management. Singapore, p. 1804-1808.
[10]Wang Y. M., Elhag T. M. S., 2008. An adaptive neuro-fuzzy inference system for bridge risk assessment. Expert Systems with
Applications 34, p. 3099-3106.
[11]Sugeno, M.. Industrial applications of fuzzy control. Amsterdam: Elsevier; 1985.
[12]Pawlak, Z., 1982. Rough Sets. International Journal of Computer and Information Sciences11, p. 341-356.
[13]Shi, Y., Eberhart, R., 1998. “A modified particle swarm optimizer,” Evolutionary Computation Proceedings, IEEE World Congress on