Introducing CAVASS: a Computer Assisted Visualization and
Analysis Software System
George Grevera
*ab, Jayaram Udupa
b, Dewey Odhner
b, Ying Zhuge
b, Andre Souza
b, Tad Iwanaga
b,
and Shipra Mishra
ba
Department of Mathematics and Computer Science, Saint Joseph’s University, 5600 City Avenue,
Philadelphia, PA 19131;
b
Medical Image Processing Group (MIPG), Department of Radiology, University of Pennsylvania,
423 Guardian Drive, 4th Floor Blockley Hall, Philadelphia, PA 19104-6021
*[email protected]; phone 1 610 660-1535; fax 1 610 660-3082; www.sju.edu/~ggrevera
ABSTRACT
The Medical Image Processing Group (MIPG) at the University of Pennsylvania has been developing (and distributing with source code) medical image analysis and visualization software systems for a long period of time. Our most recent system, 3DVIEWNIX, was first released in 1993. Since that time, a number of significant advancements have taken place with regard to computer platforms and operating systems, networking capability, the rise of parallel processing standards, and the development of open source toolkits. The development of CAVASS by our group is the next generation of 3DVIEWNIX. CAVASS will be freely available, open source, and is integrated with toolkits such as ITK and VTK. CAVASS runs on Windows, Unix, and Linux but shares a single code base. Rather than requiring expensive multiprocessor systems, it seamlessly provides for parallel processing via inexpensive COWs (Cluster of Workstations) for more time consuming algorithms. Most importantly, CAVASS is directed at the visualization, processing, and analysis of 3D and higher dimensional medical imagery, so support for DICOM data and the efficient implementation of algorithms is given paramount importance.
Keywords: visualization, 3D imaging, software systems, image analysis
1. INTRODUCTION
Software development for 3D CAVA (Computer Aided Visualization and Analysis) in our group started in the 1970s. In 1980, we brought out the first ever such package for medical 3D CAVA [1]. This software worked on a Data General minicomputer, which drove a Comtal image display frame buffer. In 1982, we brought out a significantly expanded version of this software package [2]. In spite of its high machine and display device dependency, this package was distributed to over 150 sites with source code worldwide long before the term “open source” was coined. This package was also incorporated into the General Electric CT/T 8800 scanner [3]. We subsequently developed a more advanced package [4] for the GE 9800 CT scanner. GE distributed widely these on-the-scanner packages. Earlier, we implemented DISPLAY and DISPLAY82 at the Mayo Clinic whose investigators used these packages until they started developing the Analyze system [5] around 1984-85.
Around 1987, we started the development of a Unix-workstation-based software system named 3DVIEWNX [6] which was based on standard C programming language and a graphical user interface library developed by us based on X Windows. It also incorporated a multidimensional generalization [7] of the 2D DICOM image representation standards. This issue of the need to handle a multidimensional vectorial image as a single entity and also to handle non-image structure information such as surfaces is only now being looked into by the standards committees related to DICOM. These issues were addressed in 3DVIEWNIX in the early stage of its design during 1987-1990. 3DVIEWNIX has incorporated numerous advanced 3D (and higher dimensional) CAVA operations including various methods of interpolation, filtering, segmentation, registration, algebraic and morphological operations, visualization methods for surfaces and volumes, interactive structure editing and manipulation, and scene intensity and structure-based quantitative analysis. Its binary version is available freely via Internet and has been used by 100s of sites, and the
source-code-version has been distributed to more than 180 sites worldwide to date. We continue to maintain, distribute, and develop 3DVIEWNIX by incorporating into it all functions that we find useful after rigorously testing them in one or more of our on-going applications. About 60-person years of work has gone into 3DVIEWNIX so far. Its design has stood the test of time and of over 15 applications pursued by us since its release.
Since the time 3DVIEWNIX was first released (1993), a number of significant developments have occurred. Most significantly, PC platforms (and the Windows OS) have gained in capability accompanied by precipitous price reductions. They have supplanted traditional Unix-based workstations as the scientific workstations of choice. Second, network connectivity (speed) has greatly increased. Third, viable parallel processing standards have been developed and are now freely available for all popular platforms and operating systems. Fourth, platform independent windowing APIs, some of which maintain the native look and feel, have been defined and implemented. And finally, toolkits such as ITK and VTK have been developed and are freely available. Although not complete applications in themselves, these toolkits provide a breadth of techniques and can be employed as building blocks of applications.
2. METHODS
CAVASS is an open source system written entirely in C/C++ and is based on our years of experience with 3DVIEWNIX. It encompasses four groups of operations: image processing (including region of interest, interpolation, filtering, segmentation, registration, morphological operations, and algebraic operations), analysis (various methods for extracting quantitative information), visualization (including slice, reslice, maximum intensity projection, surface rendering, and volume rendering), and manipulation (for surgical planning and simulation).
CAVASS shares a single code base for all Windows, Unix, and Linux platforms by employing the portable, open source wxWidgets library. wxWidgets is unique in that it provides a single API across all platforms while maintaining the native look and feel of each. This allows CAVASS to have a single code base for all platforms rather than separate code bases for each platform (which makes development and updates much more difficult). CAVASS also employs the open source LAM (local area multicomputer) implementation of the MPI (message passing interface) parallel processing standard. LAM MPI is part of the Linux distribution and is freely available for Unix and Windows as well. CAVASS also integrates with popular toolkits such as ITK and VTK.
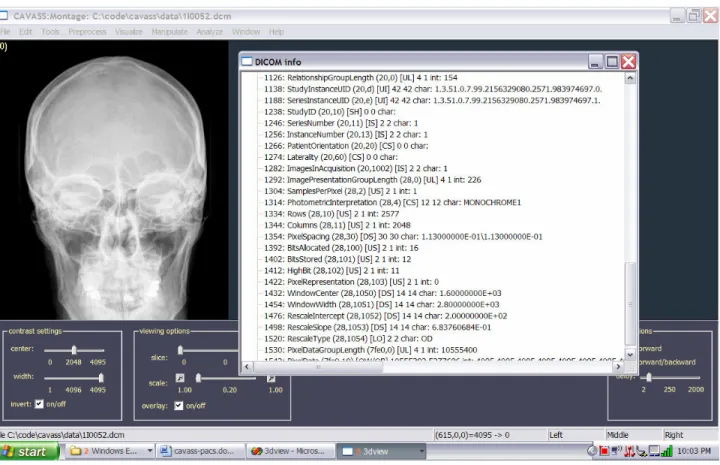
CAVASS retains much of the architecture of 3DVIEWNIX which has proven to be very effective, efficient, and easy to maintain and expand. The program libraries are compartmentalized into four groups: (1) data interface, (2) graphical interface, (3) process interface, and (4) and CAVA functions. In the interest of brevity, only groups (1) and (4) will be described in detail. CAVA functions are further divided into four groups according to the four elements of CAVA: (a) image processing, (b) visualization, (c) manipulation, and (d) analysis. One may develop their own applications based on these libraries. In addition to these libraries, CAVASS also provides a sophisticated GUI which together form a complete suite of medical imaging applications. The GUI is menu driven with such main items as Preprocess, Visualize, Manipulate, and Analyze as well as Port Data which allows data to be ported into and out of CAVASS. In addition to DICOM support (as illustrated in Fig. 1), CAVASS also supports an nD generalization of the DICOM standard as well as popular CAD/CAM formats such as STL (for the biomechanical analysis) and image format standards such as TIFF, PNM, and VTK.
2.1 Data interface
The data interface library in 3DVIEWNIX [7,8] is designed for a data representation protocol which is a generalization and an extension of the 2D DICOM standards. The data interface library contains functions for reading and writing the various types of data handled in 3DVIEWNIX. DICOM [9] is a communication and representation standard for 2D images. In its current form, it cannot represent 3D and higher dimensional image data as a single entity. Also it has not dealt with issues related to the representation of non-image data such as surfaces. In view of these lapses, we spent a considerable amount of time in the early phase of the design of 3DVIEWNIX on devising a multidimensional extension and generalization of DICOM. The data interface manual of 3DVIEWNIX [8] describes this generalization and all data types handled in 3DVIEWNIX in great detail. Since the generalization has been found to be very satisfactory, we adopted this in the development of CAVASS. There are three types of data handled by CAVASS: SCENE data,
STRUCTURE data, and DISPLAY data. There are multiple subtypes under each category. The SCENE data type represents nD images - scalar, vector-valued or binary with a regular (rectangular grid) or arbitrary sampling scheme. STRUCTURE data type represents multidimensional non-image structure information usually derived from SCENE data. These may be hard or fuzzy boundaries, represented by curves, digital surfaces of various forms, triangulated surfaces, or shells. There is a particular subtype of STRUCTURE data, which is very powerful and has been found to be useful in a variety of applications. This type allows us to represent a structure system, which is a collection of structures, in a manner that is very useful for its visualization and analysis. The structure system may contain any combination of rigid, deformable, static, and dynamic objects. The structure system is essentially a computer representation of an object (organ) system in the body. In the case of dynamic and deformable objects, multiple time samples of the objects are represented in the structure system or appropriate transformations (in the case of rigid, dynamic objects) are stored. When a structure system is rendered, the variable character of the objects is also portrayed - static objects remain static, dynamic objects are rendered with the dynamics - the adequacy of the time component of the portrayal depending on the speed of the rendering algorithm and of the host computer. Finally, DISPLAY data type constitutes a visual representation of any information in the form of a picture ready to be displayed. This includes such sub-types as screen shots, rendered images, and movie sequences. Since the data types have been found to be very satisfactory and useful, we continue to utilize them in CAVASS.
Fig. 1. An example of the CAVASS DICOM header browser (sample DICOM image from http://www.agfa.com/en/he/support/doc_library/dicom/adc_dicom_images/index.jsp).
In addition to supporting the DICOM file formats (both import and export), 3DVIEWNIX (and hence CAVASS) supports other common image file formats such as raw unformatted data, GIF, JPEG, TIFF, and PGM. Additionally, 3DVIEWNIX has been used to export structural data to CAD/CAM packages such as Fluid (for computational fluid dynamics) and Abaqus (for Finite Element Modeling (FEM)) via its ability to create files in the Stereo Lithography (STL) format. CAVASS also supports these formats. In addition, it also supports Matlab, Analyze, and Mathematica formats.
Rather than reinventing the wheel with regard to DICOM networking/image query and retrieve capability, CAVASS integrates with commonly available DICOM networking software such as the SimpleDICOM receiver [10] which is available from the University of Pittsburg Department of Radiology (for the Windows platform only) or the Conquest DICOM server [11] which is available for both Windows and Linux with source code. Other options include the eFilm workstation package [12] which includes a DICOM server (version 1.5.3 was the last free version) and DCMTK [13] which is freely available for Linux, Unix, and Windows with source code.
2.2 CAVA functions
2.2.1 Image processing: The key image processing operations commonly employed in CAVA are interpolation, filtering, registration, segmentation, and miscellaneous other operations. The image processing operations included in
CAVASS may be divided into the following seven groups. We will use I = ( , ) I f to denote an (nD) image where I is the
image domain which is a rectangular array of volume elements (voxels), and f is an intensity function that assigns to each voxel v in I an intensity value f(v). f(v) is usually scalar valued but it may also be vectorial. In the following description, we assume that Ii = ( , ) and Ii fi Io =( , ) Io fo denote input and output images, respectively.
(1) Volume of Interest (VOI): These operations are such that Io⊆ Ii and fo is a restriction of fi to Io. Io may be
selected interactively or by automatic means. The aim of these operations is to make subsequent operations more efficient and effective.
(2) Interpolation: In these operations, the voxels in Io can be of any size relative to those in Ii, both may be gray or
binary images, fo is some interpolant of fi.
(3) Filtering: The meaning of the term “filtering” is extremely variable as used in the literature. We consider filtering to be any operation such that Io =Ii, Io and Ii are both either grey or binary, and the intensities in Io are modified
from those in Ii. Operations that come under this category are image enhancement, noise/artifact suppression, and
morphological and certain topological operations.
(4) Segmentation: In these operations, the output is a binary or a gray image such that Io =Ii and fo
( )
v for v∈Ioindicates the degree of membership of v in the object of interest. Alternatively, the output may also be a hard or fuzzy surface, which represents the boundary of the object.
(5) Registration: These operations take two inputs, either images Ii1 and Ii2 or surfaces Si1 and Si2 and produce in the respective cases an image Io= T
(
Ii2)
which matches with Ii1 or a surface So= T S(
i2)
that matches with Si1, where T is a geometric transformation. T may be a rigid (6-parameter), affine (9-12 parameter) or a deformation (100s to 1000s of parameters) transformation.(6) Image Algebra: These operations take generally two input images either of which may be gray or binary and produce an output gray or binary image. A variety of operations such as addition, subtraction, multiplication, division, inverting, and certain types of algebraic expressions involving the input images are permitted.
(7) Miscellaneous: These operations allow converting one structure (surface) representation to another, structure to image representation, merging different structures into a single structure system etc.
2.2.2 Visualization: Our work on the surface rendering method of visualization dates back to the early days of CT and MR imaging [1,14-16]. We have devised digital surface rendering algorithms [17] that run on PCs 16-31 times faster than methods based on rendering triangulated surfaces by using hardware rendering engines [18] and take about an order of magnitude less storage space. The simplicity and efficiency of these algorithms afforded by the simplicity of the geometry of digital surfaces can also be extended to triangulated surfaces and thereby achieve an 8-10 fold speedup in software on PCs over hardware rendering engines if the triangles are embedded in a digital grid as in the output produced by the Marching Cubes family [19] of algorithms. This also affords compact storage of such surfaces. Due to this computational/storage efficiency, the need for triangle decimation methods currently pursued to reduce the number of triangles in the surface for overcoming computational bottlenecks is obviated.
For volume rendering, we developed a paradigm called shell rendering [20]. The basic idea of this approach is to represent tissue interfaces as shells and do volume rendering by projecting voxels in the shell in a back-to-front or front-to-back order onto the projection plane, and performing in the process the basic operations of volume rendering such as reflection, emission, and transmission. In one extreme, the shell may be very thin, just one voxel thick, in which case shell rendering reduces to the digital surface rendering method referred to above. In another extreme, the shell may include the whole foreground of a 3D image. In practice, the thickness of the shell is in between the two extremes. Recently, a method of volume rendering that has become popular is shear-warp rendering [21]. Like shell rendering, the shear-warp method can be used in both surface and volume mode. The speed of its surface mode is about the same as that of shell rendering in surface mode, but its volume mode is faster (about 2 times) than shell rendering [22], although the shear-warp method requires about 6-8 times more storage space than shell rendering. We have developed a new method, called shear-warp shell rendering, which combines the advantages of both methods [22] to achieve the speed of shear-warp and storage efficiency close to that of shell rendering.
2.2.3 Manipulation: One of the earliest papers to suggest the use of structure information derived from images for surgery planning was [23]. 3DVIEWNIX contains extensive tools for manipulating (cutting, separating, mirror reflecting, moving, repositioning) structures interactively, all implemented without depending on specialized hardware, and to carry out these manipulative operations on structures defined in a hard as well as a fuzzy manner [17,24].
2.2.4 Analysis: An early paper on estimation of volume enclosed by and the area of a surface is [25]. Recently we have demonstrated that the volume enclosed by triangulated surfaces also can be estimated in the same simple way by table lookup as done for digital surfaces [26]. We have published methods to compute linear, curvilinear, and angular measurements on the surface or by utilizing landmark points on surfaces observable in their renditions [3]. Methods are also implemented in 3DVIEWNIX for various intensity-based measures [6]. We have developed methods for higher-level analysis of object systems by describing the morphology of individual objects through morphological parameters, the inter-relationship among objects through parameters describing the architecture of the object system, and the way this inter-relationship changes when the objects move through kinematic parameters [27-29].
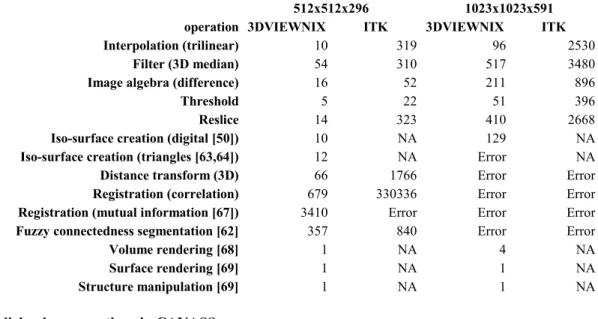
Table 1. Processing time (in seconds) for some key operations in 3DVIEWNIX and ITK.
operation 3DVIEWNIX ITK 3DVIEWNIX ITK
Interpolation (trilinear) 10 319 96 2530
Filter (3D median) 54 310 517 3480
Image algebra (difference) 16 52 211 896
Threshold 5 22 51 396
Reslice 14 323 410 2668
Iso-surface creation (digital [50]) 10 NA 129 NA
Iso-surface creation (triangles [63,64]) 12 NA Error NA
Distance transform (3D) 66 1766 Error Error
Registration (correlation) 679 330336 Error Error
Registration (mutual information [67]) 3410 Error Error Error
Fuzzy connectedness segmentation [62] 357 840 Error Error
Volume rendering [68] 1 NA 4 NA
Surface rendering [69] 1 NA 1 NA
Structure manipulation [69] 1 NA 1 NA
512x512x296 1023x1023x591
2.3 Parallelizing key operations in CAVASS
Before we set out to develop parallel implementations of key algorithms, we first devised an experiment to determine the need for such algorithms operating on datasets of common, practical sizes. We know that if we are given an image of high resolution, size, dimensionality, and pixel depth, then many computationally intensive algorithms are choked. We argue that we are already at a stage where it is just impractical to carry out some computationally intensive CAVA operations on top-of-the-line workstations and PCs with sequential algorithms. To justify this argument, we list in Table
1 the processing time for both 3DVIEWNIX and ITK for some key CAVA operations for (scalar) images of two sizes. The platform on which this was performed was a 2 GHz Pentium PC with 1 GB of RAM and 4GB of swap-space running version 2.4 of Linux. In all cases, the images had 16 bits/pixel. The interpolation operation here created (from a size 512x512 x193 input image) an output image whose size was respectively 512x512x296 and 1023x1023x591 for the two cases. (The larger image size simply choked - indicated by "error" - both systems. Blanks indicate operation not tested. NA - not available. Although this is not at all the main point we wish to make from Table 1, note that the 3DVIEWNIX operations are more efficient than those of ITK. The lower efficiency of ITK is mainly due to its generality (often 2D and 3D treated as nD), its class inheritance overhead, code developed at multiple centers, etc. In CAVASS, we keep the same level of emphasis on efficiency as in 3DVIEWNIX.)
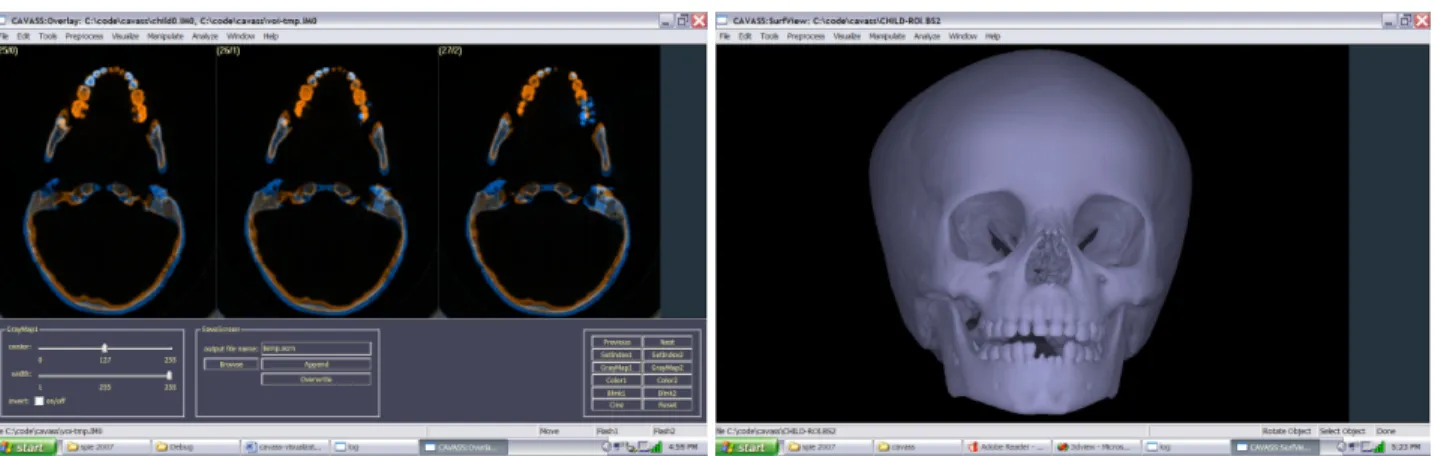
Fig. 2. Examples of overlaid slice display (left) and triangulated shell (t-shell) rendering (right) in CAVASS on the Windows operating system.
From the perspective of the ease of parallelizability, CAVA operations may be divided into three groups, which we will call Type 1, Type 2, and Type 3. Our general approach to parallelized implementation of key CAVA operations is to perform what we call chunking. A chunk is the data contained in a contiguous set of slices. A chunk may represent SCENE or STRUCTURE data. In the former case, it represents a set of contiguous slices of the given image. In the latter case, it represents structure data contained in a contiguous set of slices. There are many operations in CAVA, which work, or, which can be made to work, in a more-or-less "slice-by-slice", and hence in a "chunk-by-chunk", manner. In these operations, a slice (or chunk) worth of data needs to be accessed only once to complete the operation (or to complete one iteration of the operation) and produce the final output. Such operations are labeled Type 1. Examples of such operations are: image gray level slice interpolation methods (linear, spline-based methods) [30], shape-based (binary as well as gray-level) interpolation [30-34], image-based registration (via mutual information/correlation) [35,36], diffusive filtering [37-39], inhomogeneity correction [40], all non-user-steered slice-by-slice segmentation methods (such as clustering techniques), non-connected isosurface detection, and structure manipulation [17,24]. There are other CAVA operations, which work (chunk-by-chunk) in the above sense but some further operation is needed to combine the outputs produced by the chunks to yield the final output. Such operations are labeled Type 2. These are more difficult to parallelize and implement than Type 1 operation. Examples of such operations are various surface and volume rendering methods, particularly those that use some sort of a front-to-back or back-to-front splatting/projection strategy, such as shell and shear-warp rendering methods [17,20-22]. We label those CAVA operations, which require each slice/chunk to be accessed more than once to complete the operation as Type 3. These can be more difficult than Type 1 and Type 2 operations to parallelize the implementation. These operations can be characterized by graph traversal methods and the number of times a slice (chunk) is accessed depends on the shape of the objects represented in the image and on the orientation of the slices with respect to the object. Examples of such operations are: connected isosurface detection [41-43], connected object segmentation in a hard or fuzzy manner [44-54], and optimal path (graph cut) and fast marching (level set) methods of segmentation [55,56]. In connected isosurface detection [41,42,57], for example, the average number of accesses of an axial slice in a 3D image of the human body is typically in the range 1.5-1.8. Our aim in CAVASS is to parallelize the implementation for the following 10 groups of key CAVA operations: gray-level slice interpolation, shape-based interpolation, image-based registration (via mutual information, correlation), diffusive filtering (scale-based and non-scale-based), inhomogeneity correction (scale-based), structure manipulation (hard and fuzzy [17,24]), surface and volume rendering (via shell and shear-warp techniques),
connected isosurface detection (both digital and triangulated), and fuzzy connectedness segmentation. Another area where parallelism can be employed is in stereo rendering for display. We modified the CAVASS surface/volume rendering implementation to render from not one but two different points of view (one for each eye) for each given position of the projection plane. Typically the angle between the two nearby viewpoints is about 4°. In CAVASS, we leave this number as a parameter whose value can be modified according to an individual's vision characteristics. The graphics interface library and the GUI was modified to handle these stereo display hardware devices. Library functions were also developed to support all necessary interactions with the stereo display, including pointing to locations on the structures in their surface/volume renditions (we have previously published such algorithms [17,20]), interactively performing curved cuts, repositioning of segments, and making linear, angular, and curvilinear measurements interactively.
Parallel algorithms are implemented in CAVASS using the MPI/OpenMPI standard which is commonly and freely available for Linux, Unix, and Windows. Please note that MPI or OpenMPI should not be confused with MP or OpenMP [58,59]. OpenMP (Open specifications for Multi Processing) is a parallel processing standard for “multi-threaded, shared memory parallelism” [58]. OpenMP requires special compilers that recognize compiler directives embedded in the source code to control parallelism. Furthermore, “OpenMP is not meant for distributed memory parallel systems” [58]. Typically, OpenMP systems are expensive, tightly coupled shared memory multiprocessor systems such as the SGI Origin systems or the new SGI Altix 4700 which “supports up to 512 processors under one instance of Linux and as much as 128TB of globally shared memory” [60]. Our approach uses inexpensive, commonly available “commodity” workstations/PCs.
Table 2. Description of datasets of varying sizes used in the comparisons.
dataset name voxel size image size data size regular 0.98 x 0.98 x 3.00 mm 256 x 256 x 46 6 MB
large 0.68 x 0.68 x 1.50 mm 512 x 512 x 459 241 MB super 0.24 x 0.24 x 0.50 mm 1023 x 1023 x 417 873 MB 2.4 An interface to 1TK
We provide access to ITK within the GUI of CAVASS. In this manner, from the user's perspective, all ITK algorithms appear to be incorporated into CAVASS. A working example of the integration of a portable CAVASS prototype GUI with ITK was developed. Platform independent software loads two SCENE files and displays these files. The user is allowed to change various parameters of Thirion's Demons deformable registration algorithm [61] as implemented in ITK. Once these parameters have been specified (or the default values are found to be acceptable), CAVASS executes the ITK registration algorithm. Results of the registration process are then provided to the user by CAVASS as an output SCENE file.
Table 3. Time required for interpolation from anisotropic to isotropic data for various dataset sizes in CAVASS and ITK implementations. Multithreaded ITK employed a dual processor system and parallel CAVASS employed two single processor systems to afford a similar comparison.
dataset name CAVASS sequential CAVASS parallel ITK sequential ITK multithreaded
regular 0.6s 1.0s 2.9s 1.7s
large 54.9s 14.9s 87.7s 62.8s
super 139.1s 49.2s failed after 315.0s failed after 186.9s
3. RESULTS
Many algorithms have already been implemented and tested in CAVASS. For example, interpolation of anisotropic data to isotropic data is a common medical imaging task. We compared (in both sequential and parallel modes) the implementation of linear interpolation in CAVASS (sequential and parallel) and ITK (sequential and multithreaded) for
three datasets of varying sizes (regular or clinically typical, large, and super) as shown in Table 2. The results of this comparison are shown in Table 3.
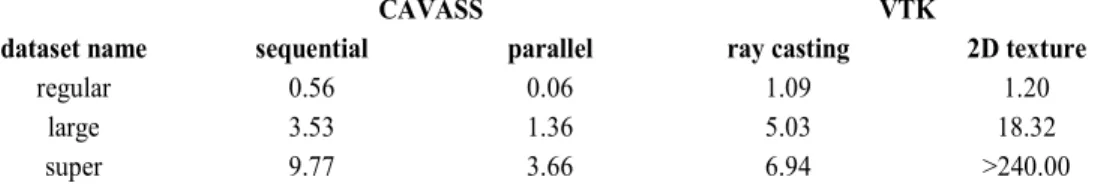
The two major volume visualization methods of surface rendering and volume rendering have also been implemented and tested in CAVASS. We compared the implementations of sequential t-shell surface rendering (an example appears in Fig. 2) implemented entirely in software in CAVASS with hardware-assisted surface rendering using the Marching Cubes method as implemented in VTK (using the vtkImageMarchingCubes class). We also compared sequential and parallel volume rendering implemented entirely in software in CAVASS with two methods of volume rendering (ray casting and 2D texture mapping) implemented in VTK (using the vtkVolumeRayCastMapper and vtkOpenGLVolumeTextureMapper2D classes, respectively). The timing results in seconds per frame were obtained by applying the various visualization techniques to three datasets of varying sizes (regular, large, and super) as shown in Table 2. Results for sequential surface rendering and parallel and sequential volume rendering appear in Tables 4 and 5, respectively. Table 4 shows that sequential CAVASS shell rendering, entirely in software and without antialiasing, was more than 8.5 times faster than hardware-based rendering as implemented in VTK for the largest dataset (super) in our test. With antialiasing, CAVASS shell rendering was more than 5 times faster. For volume rendering, Table 5 shows that the CAVASS implementation, entirely in software, was faster than both ray casting and 2D texture mapping as implemented in VTK for both the regular and large datasets. For the super dataset, sequential CAVASS volume rendering was slower than volume rendering in VTK but the parallel implementation of volume rendering in CAVASS was almost twice as fast as ray casting in VTK. Although VTK ray casting was able to render the largest dataset, 2D texture mapping as implemented in VTK was unable to render the largest dataset after more than 240 seconds. This is likely due to the limited amount of memory on the graphics card. When we compare VTK ray casting to VTK 2D texture mapping, we note the trend that VTK ray casting is consistently faster than VTK 2D texture mapping. Since CAVASS parallel volume rendering is consistently faster than both VTK ray casting and VTK 2D texture, we conclude that even with additional video memory, CAVASS parallel volume rendering would be faster than VTK 2D texture rendering of the largest dataset.
Table 4. Surface rendering timing comparison for CAVASS (sequential implementation with and without antialiasing) and surface rendering as implemented in VTK.
dataset name CAVASS seq/no aa CAVASS seq/aa VTK
regular 0.03 0.06 0.29
large 0.11 0.19 0.41
super 0.16 0.26 1.38
Table 5. Volume rendering timing comparison for sequential and parallel implementations of CAVASS volume rendering, VTK ray casting, and VTK 2D texture mapped volume rendering.
dataset name sequential parallel ray casting 2D texture
regular 0.56 0.06 1.09 1.20
large 3.53 1.36 5.03 18.32
super 9.77 3.66 6.94 >240.00
CAVASS VTK
All sequential tests were performed on a Dell single processor, 3.6 GHz Pentium system with 3 GB RAM and hyperthreading enabled under the Linux operating system version 2.6.9-1.667smp. The multithreaded tests were performed on a Dell dual processor, 3.4 GHz Xeon system with 4 GB of RAM and hyperthreading enabled under the Linux operating system version 2.6.9-1.667smp. The parallel visualization tests were performed on a cluster of six single processor systems (Dell single processor, 3.6 GHz Pentium systems with 3 GB RAM and hyperthreading enabled under the Linux operating system version 2.6.9-1.667smp) interconnected by an inexpensive 1Gb (gigabit) switch (Dell PowerConnect 2608, an 8-port 1-gigabit Ethernet switch). All systems had Nvidia Quadro NVS280 PCIe 64 MB video cards. The parallel interpolation tests were performed on a cluster of two single processor systems so as to be able to make a fair and direct comparison with multithreaded ITK interpolation.
4. CONCLUSIONS
We described CAVASS, a new open source, open platform software system and the next incarnation of the previously established and widely distributed 3DVIEWNIX software system. We demonstrated the extremely efficient implementation of algorithms in sequential and parallel modes on COWs in CAVASS. CAVASS is the only freely available, open source image processing, analysis, and visualization software system for multidimensional medical imagery that incorporates other open source toolkits and provides for the efficient and parallel implementations of important algorithms. With regard to the common task of interpolation, CAVASS sequential interpolation was nearly twice as fast as ITK sequential interpolation and CAVASS parallel interpolation was shown to be more than 3 times faster than multithreaded ITK interpolation. CAVASS was also able to deal with larger datasets that made ITK fail. With regard to visualization, surface rendering in CAVASS entirely in software was demonstrated to be more than 8.5 times faster than hardware-assisted surface rendering. For volume rendering, we demonstrated that sequential volume rendering in CAVASS entirely in software is faster for the regular and medium datasets in our test and for the largest dataset (super), parallel volume rendering in CAVASS was almost twice as fast as the fastest hardware-based method. Finally, CAVASS may be used as a toolkit library or as a complete set of applications with an easy to use GUI that interfaces with other popular data formats and toolkits.
CAVASS is available from www.mipg.upenn.edu/~cavass.
ACKNOWLEDGEMENT
The authors gratefully acknowledge support for this work from DHHS grant EB004395.
REFERENCES
1. J.K. Udupa: "DISPLAY - A system of programs for two- and three-dimensional display of medical objects from CT data," Technical Report MIPG41, Medical Image Processing Group, Department of Computer Science, SUNY/Buffalo, Buffalo, New York, 1980.
2. J.K. Udupa: "DISPLAY82 - A system of programs for the display of 3D information in CT data," Technical Report MIPG67, Medical Image Processing Group, Department of Radiology, University of Pennsylvania, Philadelphia, April 1983.
3. L.S. Chen, G.T. Herman, C.R. Meyer, R.A. Reynolds, and J.K. Udupa: "3D83 - An easy-to-use software package for three-dimensional display from computed tomograms," Proceedings of IEEE Computer Society International Symposium on Medical Images and Icons, Arlington, Virginia, pp. 309-316, 1984.
4. J.K. Udupa, G.T. Herman, P.S. Margasahayam, L.S. Chen, and C.R. Meyer: "3D9S: A turnkey system for the display and analysis of 3D medical objects," SPIE Proceedings 671:154-168, 1986.
5. R.A. Robb, D.P. Hanson, R.A. Karwoski, A.G. Larson, E.L.Workman, and M.C. Stacy: "ANALYZE: A comprehensive, operator-interactive software package for multidimensional medical image display and analysis," ComputerizedMed. Imag. Graph. 13:433-454, 1989.
6. J.K. Udupa, D. Odhner, S. Samarasekera, R. Goncalves, K. lyer, K. Venugopal, and S. Furuie: "3DVIEWNIX: an open, transportable, multidimensional, multimodality, multiparametric imaging software system," in SPIE Proceedings 2164:58-73, 1994.
7. J.K. Udupa, H.M. Hung, D. Odhner, and R. Goncalves: "Multidimensional data format specification: A generalization of the American College of Radiology National Electric Manufacturers Association Standards," Journal of Digital Imaging 5(l):26-45, 1992.
8. J.K. Udupa, H.M. Hung, D. Odhner, and R. Goncalves: "The 3DVIEWNIX Software System, Data Format Specification: A Multidimensional Extension to the ACR-NEMA Standards," Version 1.0, Technical Report MIPG177, Medical Image processing Group, Department of Radiology, University of Pennsylvania, Philadelphia, January 1991.
9. National Electrical Manufactures Association (NEMA): Digital Imaging and Communication in Medicine (DICOM) Part 1: Introduction and Overview, NEMA, Washington, DC, 1993.
10. www.radiology.upmc.edu/software.html 11. www.xs4all.nl/%7Eingenium/dicom.html 12. www.efilm.ca/
13. dicom.offis.de/dcmtk.php.en
14. M.D. Altschuler, Y. Censor, P.B.B. Eggermont, G.T. Herman, Y.H. Kuo, R.M. Lewitt, M.R. McKay, H. Tuy, J.K. Udupa, and M. Yau, M.: "Demonstration of a software package for the reconstruction of the dynamically changing structure of the human heart from cone-beam x-ray projections," Journal of Medical Systems 4(2):289-304, 1980. 15. J.K. Udupa: "Display of 3-D information in discrete 3-D scenes produced by computerized tomography,"
Proceedings of the IEEE 71:420-431, 1983.
16. G.T. Herman and J.K. Udupa, "Display of 3-D information in 3-D digital images: Computational foundations and medical applications," IEEE Computer Graphics and Applications 3:39-46, 1983.
17. J.K. Udupa and D. Odhner: "Fast visualization, manipulation, and analysis of binary volumetric objects," IEEE Computer Graphics and Applications ll(6):53-62, 1991.
18. G.J. Grevera, J.K. Udupa, and D. Odhner: "An order of magnitude faster surface rendering in software on a PC than using dedicated rendering hardware," IEEE Transactions on Visualization and Computer Graphics 6(4):335-345, 2000.
19. W.E. Lorensen and H.E. Cline: "Marching cubes: A high resolution 3D surface construction algorithm," Computer Graphics 21(4): 163-169, 1987.
20. J.K. Udupa and D. Odhner: "Shell rendering," IEEE Computer Graphics and Applications 13(6):58-67, 1993. 21. P. Lacroute and M. Levoy: "Fast volume rendering using a shear-warp factorization of the viewing transformation,"
Proc. SIGGRAPH:451-458, 1994.
22. A.X. Falcao, L.M. Rocha and J.K. Udupa: "Comparative analysis of shell rendering and shear-warp rendering," SPIE Proceedings 4681:472-482, 2002.
23. J.K. Udupa: "Interactive segmentation and boundary surface formation for 3-D digital images," Computer Graphics and Image Processing, 18:213-235, 1982.
24. D. Odhner and J.K. Udupa, "Shell manipulation: Interactive alteration of multiple-material fuzzy structures," SPIE Proceedings 2431:35-42, 1995.
25. J.K. Udupa: "Determination of 3-D shape parameters from boundary information," Computer Graphics and Image Processing 17:52-59, 1981.
26. I. Nystrom, J.K. Udupa, G.J. Grevera, and B.E. Hirsch: "Area of and volume enclosed by digital and triangulated surfaces," SPIE Proceedings 4681:669-680, 2002.
27. E. Stindel, J. Udupa, B. Hirsch, D. Odhner, and C. Couture: "3D MR image analysis of the morphology of the rear foot: Application to classification of bones," Computerized Medical Imaging and Graphics 23:75-83, 1999.
28. E. Stindel, J. Udupa, B. Hirsch, and D. Odhner: "A characterization of the geometric architecture of the peritalar joint complex via MRI: An aid to classification of feet," IEEE Transactions on Medical Imaging 18:753-763, 1999. 29. J. Udupa, B. Hirsch, S. Samarasekera, H. Hillstrom, G. Bauer, and B. Kneeland: "Analysis of in vivo 3D internal
kinematics of the joints of the foot," IEEE Transactions on Biomedical Engineering 45:1387-1396, 1998.
30. G.J. Grevera and J.K. Udupa: "Shape-based interpolation of multidimensional grey-level images," IEEE Transactions on Medical Imaging 15(6):881-892, 1996.
31. S.P. Raya, and J.K. Udupa: "Shape-based interpolation of multidimensional objects," IEEE Transactions on Medical Imaging 9(l):32-42, 1990.
32. W.E. Higgins, C. Morice, and E.L. Ritman: "Shape-based interpolation of thin structures in three-dimensional images," IEEE Trans. Medical Imaging 12(3):439-450, 1993.
33. G.T. Herman, J. Zheng, and C.A. Bucholtz: "Shape-based interpolation," IEEE Computer Graphics and Applications 12(3):69-79, 1992.
34. G.M. Treece: "Volume Measurement and Surface Visualisation in Sequential Freehand 3D Ultrasound." Ph.D. Thesis, Cambridge University, November 2000.
35. W.M. Wells III, P. Viola, H. Atsumi, S. Makajima, and R. Kikinis: "Multi-modal volume registration by maximization of mutual information," Medical Image Analysis 1(1):35-51, 1996.
36. J.O. Lauchaud and A. Montanvert: "Continuous analogs of digital boundaries: A topological approach to iso-surfaces," Graphical Models 62(3): 129-164, 2000.
37. G. Gerig, O. Kubler, R. Kikinis, and F.A. Jolesz: "Nonlinear anisotropic filtering of MRI data," IEEE Trans. Medical Imaging ll(2):221-232, 1992.
38. P.K. Saha, and J.K. Udupa: "Scale-based image filtering preserving boundary sharpness and fine structure," IEEE Transactions on Medical Imaging 20(11): 1140-1155, 2001.
39. P. Perona and J. Malik: "Scale-space and edge detection using anisotropic diffusion," IEEE Pattern Analysis and Machine Intelligence 12(7):629-639, 1990.
40. Y. Zhuge, J.K. Udupa, J. Liu, P.K. Saha, and T. Iwanaga: "Scale-based method for correcting background intensity variation in acquired images," Proc. SPIE 4684:1103-1111, Medical Imaging 2002: Image Processing; M. Sonka, J.M. Fitzpatrick; Editors, 2002.
41. J.K. Udupa: "Multidimensional digital boundaries," CVGIP: Graphical Models and Image Processing 50(4):311-323, 1994.
42. J.K. Udupa S.N. Srihari and G.T. Herman: "Boundary detection in multidimensions," IEEE Transactions on Pattern Analysis and Machine Intelligence PAMI-4:41-50, 1982.
43. Y. Boykov, O. Veksler, and R. Zabih: "Fast approximate energy minimization via graph cuts," IEEE Transactions on Pattern Analysis and Machine Intelligence 23:1222-1239, 2001.
44. J. Udupa and S. Samarasekera: "Fuzzy connectedness and object definition: Theory, algorithms, and applications in image segmentation," Graphical Models and Image Processing 58:246-261, 1996.
45. P. Saha, J. Udupa and D. Odhner: "Scale-based fuzzy connected image segmentation: Theory, algorithms and validation," Computer Vision and Image Understanding 77:145-174, 2000.
46. P. Saha and J. Udupa: "Relative fuzzy connectedness among multiple objects: Theory, algorithms, and applications in image segmentation," Computer Vision and Image Understanding 82:42-56, 2001.
47. P. Saha and J. Udupa: "Fuzzy connected object delineation: Axiomatic path strength definition and the case of multiple seeds," Computer Vision and Image Understanding 83:275-295, 2001.
48. J. Udupa, P. Saha, and R. Lotufo: "Relative fuzzy connectedness and object definition: Theory, algorithms, and applications in image segmentation," IEEE Transactions on Pattern Analysis and Machine Intelligence 24, 1485-1500, 2002.
49. T. Jones: Image-Based Ventricular Blood Flow Analysis, Doctoral Dissertation, University of Pennsylvania, 1998. 50. J. Cutrona and N. Bonnet: "Two methods for semi-automatic image segmentation based on fuzzy connectedness and
watersheds," France-Iberic Microscopy Congress, Barcelona, 23-24, 2001.
51. R. He and P. Narayana: "Detection and delineation of multiple sclerosis lesions in gadolinium-enhanced 3D Tl-weighted MRI data," in Proceedings of IEEE Symposium on Computer Based Medical Systems, 2000.
52. T. Aldeliesten, W. Niessen, K. Vincken, J. Maintz, F. Jansen, O. van Nieuwenhuizen, and M. Viergever: "Objective and reproducible segmentation and quantification of tuberous sclerosis lesions in FLAIR brain MR images," in Proceedings of SPIE 4322:1509-1518, 2001.
53. Y. Jin, A. Laine and C. Imielinska: "An adaptive speed term based on homogeneity for level-set segmentation," in Proceedings of SPIE.
54. S. Henn, M.G. Lemole, M.A.T. Ferreira, F.L. Gonzalez, M. Schornak, M.C. Preul, and R.F. Spetzler: Interactive stereoscopic virtual reality: a new tool for neurosurgical education, J. Neurosurgery 96(1): 144-149, 2002.
55. J. Sethian: Level Set Methods, Cambridge University Press, 1996.
56. S.P. Raya, J.K. Udupa, and W.A. Barrett: "A PC-based 3D imaging system: algorithms, software, and hardware considerations," Computerized Medical, Imaging and Graphics 14(5):353-370, 1990.
57. G. Frieder, D. Gordon, and R.A. Reynolds: "Back-to-front display of voxel-based objects," IEEE Computer Graphics and Applications 5:52-60, 1985.
58. www.llnl.gov/computing/tutorials/openMP/#Introduction, OpenMP 59. www.openmp.org/drupal/
60. www.sgi.com/products/servers/altix/4000/
61. A. Mockus, R.T. Fielding, and J.D. Herbsleb: "Two case studies of open source software development: Apache and Mozilla," ACM Trans. Software Engineering and Methodology 11(3):309-346, 2002.