Procedia Technology 4 ( 2012 ) 384 – 389
2212-0173 © 2012 Published by Elsevier Ltd. doi: 10.1016/j.protcy.2012.05.059
C3IT-2012
Application of Data Mining Techniques for Software Reuse
Process
B V Ajay Prakash
a, D V Ashoka
a, V N Manjunath Aradhya
b a.Department of Information Sceience and Engineering, S J B I T, Bangalore,Karnataka, IndiabDepartment of Information Science and Engineering, DSCE, Bangalore, Karnataka, India
Abstract
Nowadays’ most of the software products are developed by using existing versions or features in order to reduce the delivery time of software product, to improve the productivity and quality and to reduce the development effort. Software reuse has been a solution factor to acquire the existing knowledge from software repository. To extract existing knowledge from software repository data mining can be used. Data mining is the process of extracting useful patterns and analyzing enormous data sets from large data. This paper gives the description of software reuse process, knowledge discovery process and software metrics for object oriented programming language are identified. Software metrics are used as quantitative measure to determine, assess, evaluating the software components. Mapping is done, for different data mining techniques which can be used for software reusability process using different software metrics. We have prepared 167 instances data sets from open source projects. Data mining techniques is used for evaluating the software components. There is gap between the need of useful data from software repository to software project management practices. To bridge this gap we are applying data mining techniques efficiently and effectively to extract useful knowledge from software repository using different software metrics. Finally, this knowledge can be used by project managers for better management of the software projects. © 2011 Published by Elsevier Ltd. Selection and/or peer-review under responsibility of C3IT
Keywords: Software reuse, Software Metrics, Decision Tress, Clustering and Classification
1. Introduction
Software reuse is becoming a key factor in reducing the development time and effort in the software development process and also to improve the software quality and productivity. New horizons are opened since the idea of using the existing knowledge for software reuse appeared in 1968 [1]. The main idea behind the software reuse is domain engineering (aka product line engineering). Reusability is the degree to which a thing can be reused [2]. Software reusability represents the ability to use part or the whole system in other systems [3,4] which are related to the packaging and scope of the functions that programs perform [5]. According to [6], the US department of defense alone could save 300 million $ annually by increasing its level of reuse as little as 1%. Moreover, software reusability aimed to improve productivity, maintainability, portability and therefore the overall quality of the end product [7].
Open access under CC BY-NC-ND license.
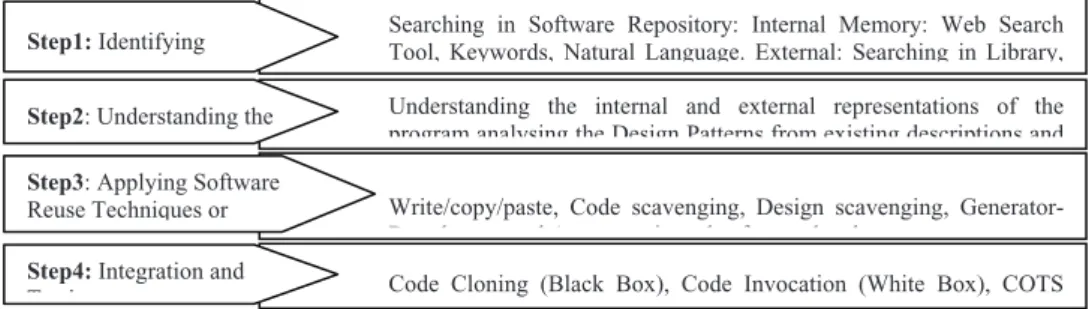
Figure 1: Software Reuse Process
Ramamoorthy et. al.[8] mentions that the reusability is not limited to the source code, but it has to include the requirements, design, documents, and test cases besides the source code. New technologies and techniques are required to reuse the existing knowledge from software historical data such as code bases, execution traces, historical code changes, contains a wealth of information about a software project’s status, progress, and evolution. Basically software reuse process consists of four steps such as identifying the software components, understanding the context, applying software reuse techniques, integration and evaluating. The software reuse process and description of each step is shown in Figure 1. Nowadays different data mining techniques are used in project management to extract useful data from software historical data. Data mining is the process of extracting patterns from data. Data mining, or knowledge discovery, is the computer-assisted process of digging through and analyzing enormous sets of data and then extracting the meaning of the data. A Typical knowledge discovery process (KDP) is shown in Figure 2. KDP may consist of the following steps: data selection, data cleaning, data transformation, pattern searching (data mining), and finding presentation, finding interpretation and evaluation. Data collection phase is to extract the data relevant to data mining analysis. The data should be stored in a database where data analysis will be applied.
Figure.2: Knowledge Discovery Process
Data cleaning and preprocessing and data transformation phase of KDP involves data cleansing and preparation of data, converting the data suitable for processing and obtaining valid results to achieve the desired results. Activity monitoring module deals with real time information. The purpose of data mining (DM) phase is to analyze the data using appropriate algorithms to discover meaningful patterns and rules to produce predictive models. Data mining is the most important phase of KDP cycle. After building data warehouse data mining algorithms such as clustering, classification, artificial neural networks, rule association, decision tree and classification and regression trees (CART) or chi-square automatic induction (CHAID) are applied. Interpretation and evaluation of results is the final phase involves making useful decisions by interpreting and evaluating results obtained from applying knowledge discovery techniques. A key element in the success of software reuse is the ability to predict needed variabilities in future assets. Research is needed to identify and validate measures of reusability, including good ways to estimate the number of potential reuses. Data mining is becoming an increasingly important tool to transform this data into information.
Searching in Software Repository: Internal Memory: Web Search Tool, Keywords, Natural Language. External: Searching in Library, Understanding the internal and external representations of the program analysing the Design Patterns from existing descriptions and
Write/copy/paste, Code scavenging, Design scavenging, Generator-B d d A i d f d l
Code Cloning (Black Box), Code Invocation (White Box), COTS
Step1: Identifying
Step2: Understanding the
Step3: Applying Software Reuse Techniques or
Step4: Integration and T ti Selecting Target Data Use full Patterns Knowledge Discovery Data Collection Data Transformation
Applying Data Mining Techniques Clustering Classification Artificial Neural Networks Association Rules CART Pre-processed Data Transformed Data Data Cleaning & pre-processing Interpretation Evaluation of Results Activity Monitoring
This paper consist of five sections: Section 2 gives detailed survey of different knowledge discovery techniques applied to various aspects of the software reuse activities. In Section 3 deals with application of data mining techniques to software reuse. Section 4 gives the conclusion.
2. Related Works
Several research works has been carried out on software reuse by many authors. Morisio et. al [9] has identified some of the key factors such as adapting or running a companywide software reuse. Prediction of reusability of object oriented software systems using clustering approach have been made by [10]. G. Boetticher et.al proposed a neural network approach that could serve as an economical, automatic tool to generate reusability ranking of software [11]. Morisio et. al [9] TSE article success and failure factors in software reuse sought key factors that predicted for successful software reuse. Tim Menzies et. al [21] has identified numerous discrepancies which exist between expert opinion and empirical data reported by Morisio et.al.’s in TSE article. Michail [12] have applied association rules, frequent sequence mining and clustering techniques to reveal usage patterns of program components from a corpus of existing code examples. Numerous work has being done in developing platforms for machine learning and on software engineering based on reusable components. Among that well known open-source machine learning platforms are WEKA [13], R-project [14] and Rapid Miner [15]. In [16] authors propose a DMTL (data mining template library) which consists of generic containers and algorithms for frequent pattern mining. They show that “the use of generic algorithms is competitive with special purpose algorithms”. Murthy, Safavian et. al [17] have done comparison of decision tree design. Large number of object-oriented (OO) measures has been proposed in the literature (see for example [18], [19]). Basili et. al. show in [20] that most of the metrics proposed by Chidamber and Kemerer in [19] are useful for predicting the fault-proneness of classes during the design phase of OO systems. Li and Henry showed that the maintenance effort could be predicted with combinations of metrics collected from the source code of OO components [20]. Sonia et. al [22] have proposed a framework for evaluating reusability of procedure oriented system using metrics based approach.
3. Methodology
We have prepared the data sets using Chidamber and Kemerer tool for object oriented programming by downloading open source projects from (www.sourceforge.net).
3.1 Selection of Software Metrics
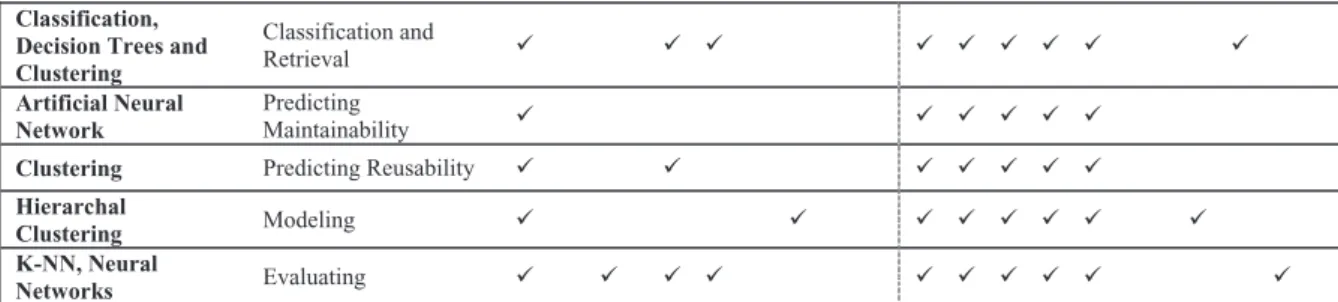
There is need for software metrics and models to determine quality, predict, and to measure the reusability aspects. [19,24] Software metrics such as Cyclomatic Complexity(CC), Cyclomatic Density (CD), LOC Total (LOCT), LOC Executable (LOCE), LOC Comments (LOCC), LOC Code and Comments, LOC Blank (LOCB), Number of Lines (NOC), Node Count (NC), Edge Count (EC), Weighted Methods per Class (WMC), Depth of Inheritance Tree (DIT), NOC Number of Children (NOC), Coupling between Object Classes (CBO), Response for a Class (RFC), Lack of Cohesion of Methods (LCOM1), Method Hiding Factor (MHF), Method Inheritance Factor (MIF), Polymorphism Factor (PF), Coupling Factor (CF), Number of interfaces, Class size, Number of classes, etc. are available for different programming paradigm such as procedure oriented and object oriented. We have classified the software metrics based on procedure and object oriented programming paradigm as shown in Table 1. Using this, it would be easy to apply different data mining techniques for software reuse process in various aspects.
Software Metric used for Procedure Oriented Paradigm
Software Metric used for Object Oriented Paradigm Knowledge
Discovery or Data Mining Techniques
Software Reusability
Activities CC CD LOCT LOCE LOCC LOCB NOC NC EC WMC DIT NOC CBO RFC LCO M1 TCC MHF MIF PF
Neural Networks, Classification,
Identifying a software
components 9 9 9 9 9 9 9 9 9
Classification, Decision Trees and Clustering Classification and Retrieval 9 9 9 9 9 9 9 9 9 Artificial Neural Network Predicting Maintainability 9 9 9 9 9 9
Clustering Predicting Reusability 9 9 9 9 9 9 9
Hierarchal
Clustering Modeling 9 9 9 9 9 9 9 9
K-NN, Neural
Networks Evaluating 9 9 9 9 9 9 9 9 9 9
Table 1: Shows the mapping of different data mining techniques used for software reusability activities using different software metrics.
3.2 Data Cleaning and Data Transformation
We have identified software metrics for procedure and object oriented programming language, which is used to measure quality of software components or system. Using this software metrics, we can apply data mining techniques to evaluate, predict quality of software components. The following metrics are used as input attributes of the software components of the open source projects:
¾ Weight Method per Class (WMC)
¾ Depth of Inheritance Tree (DIT)
¾ Number of Childers (NOC)
¾ Coupling Between Classes (CBO)
¾ Response for Class (RFC)
¾ Lack of Cohesion Method (LOC)
¾ Coupling Afferent (CE)
¾ Number of public method (NPM)
We have prepared 167 instances from open source projects from (www.sourceforge.net), for all this instances software components are measured using software metrics. Standard deviation and mean are calculated as shown in the Table 2.
WMC DIT NOC CBO RFC LOC CE NPM
Min 7 0 0 0 8 3 0 7
Max 162 65 9 39 768 1213 78 109 Mean 57.539 14.078 1.198 16.707 254.353 198.647 18.323 58.952 Std Dev 38.35 9.824 2.582 12.86 164.452 343.393 15.017 28.409
Table2: Statistics of the Input Attribute of the Data Sets
For evaluating precision, recall, mean absolute error (MAE), root mean-squared error (RMSE) is calculated. Precision for a class is the number of true positives (TP) (i.e. the number of items correctly labeled as belonging to the positive class) divided by the total number of elements labeled as belonging to the positive class [23]. The precision equation is:
/( )
precision TP TP FP --- (1)
Recall in this perspective is defined as the number of true positives divided by the total number of elements that actually belong to the positive class (i.e. the sum of true positives and false negatives (FN), which are items which were not labeled as belonging to the positive class but should have been) [23]. The recall can be calculated as follows:
Recall TP TP FN/( )--- (2)
Mean absolute error, MAE is the average of the difference between predicted and actual value in all test cases; it is the average prediction error. The formula for calculating MAE is given in equation shown below: 2 2 2 1 1 2 2 (a c) (a c) ... (an cn) MAE n --- (3)
Assuming that the actual output is a, expected output is c
RMSE is frequently used measure of differences between values predicted by a model or estimator and the values actually observed from the thing being modeled or estimated. Root of the mean square error as shown in equation given below:
2 2 2 1 1 2 2 (a c) (a c ) ... (an cn) R M S E n --- (4)
3.3. Applying data mining Techniques
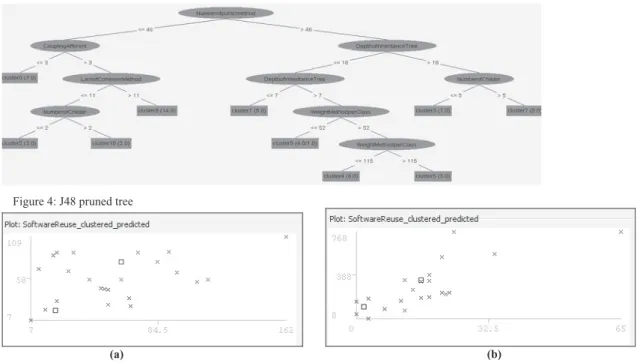
Using REP tree, J48 pruned tree and by setting the test mode to 10-fold validation, we have applied the classification for input attributes and the results are shown in Figure 3 and Figure 4. Using WEKA 3.6 visualize classifier graph has been plot shown in Figure 5.
ResponseForClass < 206 | LackofCohesionMethod < 126 | | DepthofInheritanceTree < 8 | | | CouplingBetweenClasses < 1 | | | | ResponseForClass < 93 | | | | | DepthofInheritanceTree < 1.5 : 12 (3/0) [1/0] | | | | | DepthofInheritanceTree >= 1.5 : 7 (2/0) [1/0] | | | | ResponseForClass >= 93 : 16 (9/0) [8/0] | | | CouplingBetweenClasses >= 1 : 22.24 (12/0.58) [9/1.14] | | DepthofInheritanceTree >= 8 : 33.21 (8/0.19) [6/0.15] | LackofCohesionMethod >= 126 | | DepthofInheritanceTree < 17 : 53.56 (7/0.49) [2/1.51] | | DepthofInheritanceTree >= 17 : 50 (7/0) [4/0] ResponseForClass >= 206 | CouplingBetweenClasses < 36.5 | | DepthofInheritanceTree < 23.5 | | | ResponseForClass < 365 | | | | Numberofpublicmethod < 67 | | | | | CouplingBetweenClasses < 26 | | | | | | DepthofInheritanceTree < 16.5 : 62 (6/0) [3/0] | | | | | | DepthofInheritanceTree >= 16.5 : 67.22 (7/0.12) | | | | | CouplingBetweenClasses >= 26 : 54 (2/0) [1/0] | | | | Numberofpublicmethod >= 67 | | | | | ResponseForClass < 332.5 | | | | | | DepthofInheritanceTree < 19 : 91 (9/0) [0/0] | | | | | | DepthofInheritanceTree >= 19 : 84 (9/0) [3/0] | | | | | ResponseForClass >= 332.5 | | | | | | DepthofInheritanceTree < 17 : 62 (3/0) [0/0] | | | | | | DepthofInheritanceTree >= 17 : 72 (5/0) [5/0] | | | ResponseForClass >= 365 | | | | DepthofInheritanceTree < 19.5 : 43 (4/0) [3/0] | | | | DepthofInheritanceTree >= 19.5 : 30 (3/0) [2/0] | | DepthofInheritanceTree >= 23.5 | | | ResponseForClass < 664.5 : 96 (3/0) [1/0] | | | ResponseForClass >= 664.5 : 113 (5/7.84) [2/16.66] | CouplingBetweenClasses >= 36.5 : 162 (7/0) [3/0] Figure 3: REP Tree of Input Attributes.
Figure 4: J48 pruned tree
(a) (b)
Figure 5 (a) Visualization of WMC (X-axis) vs NPM (Y-axis) (b) Visualization of DIT (X-axis) vs RFC (Y-axis).
Results are obtained from WEKA tool, version 3.6, as shown in Table 3. With 10-fold cross validation, coupling between classes (cluster 0) and coupling afferent class (cluster 1) precision, recall, TP rate and FP rate is calculated using equation 1and 2. MAE and RMSE is calculated from equation 3 and 4 and obtained 0.0526, 0.2294 respectively.
TP Rate FP Rate Precision Recall F-Measure ROC Area Class
0.964 0.069 0.931 0.964 0.947 0.948 cluster0
0.931 0.036 0.964 0.931 0.947 0.948 cluster1
Weighted Avg. 0.947 0.052 0.948 0.947 0.947 0.948
4. Conclusions
Software reuse has become the solutions to reduce development time, improve productivity and quality. Data mining techniques can be effectively used in software reuse process. The main contributions for this paper are as follows:
xIdentified the need of software reuse in software development practices.
xMapping of different data mining techniques which can be used for software reuse process using different software metrics.
xPrepared data sets from open source projects, i.e.,167 instances are identified
xApplied data mining techniques such as classification, clustering and visualizing for evaluating software reusable components.
These yield a better understanding and evaluating of software reuse components. For object oriented programming language C&K tool can be used to construct the software metrics such as WMC, DIT, NOC, CBO, RFC, LOC, CE and NPM. Using REP and J48 pruned tree is constructed, to classify the software reusable components. For more accuracy precision, recall, MAE and RMSE is calculated.
References
1. Gomes. P and Bento. C, "A Case Similarity Metric for Software Reuse and Design," Artif. Intell. Eng. Des. Anal.Manuf., Vol. 15, pp. 21-35, 2001.
2. Frakes.W and C.Terry, Software Reuse: Metrics and Models, ACM Computing Surveys, Vol. 28, No. 2, June 1996
3. Mccall,J.A et. al., "Factors in Software Quality," Griffiths Air Force Base, N.Y. Rome Air Development Center Air Force Systems Command, 1977.
4. Gill.N.S "Reusability Issues in Component-Based Development," Sigsoft Softw. Eng. Notes, Vol. 28, pp. 4-4, 2003. 5. Gaffney,J.J.E "Metrics in Software Quality Assurance," Presented at the proceedings of the ACM '81 Conference, 1981. 6. Poulin, J. S., 1997. Measuring Software Reuse–Principles, Practices and Economic Models, Addison-Wesley, 7. Sharma.A, et al., "Reusability assessment for software components," Sigsoft Softw. Eng. Notes, Vol. 34, pp. 1-6, 2009. 8. Ramamoorthy C. V., et. al., "Support for Reusability in Genesis," Software Engineering, IEEE Transactions, Vol. 14,
pp.1145-1154, 1988.
9. Morisio, M. Ezran, and C. Tully, “Success and Failure Factors in Software Reuse,” IEEE Transactions on Software Engineering, Vol. 28, No. 4, pp. 340–357, 2002
10. Anju Shri, Parvinder S. Sandhu, Vikas Gupta, Sanyam Anand, Prediction of Reusability of Object Oriented Software Systems Using Clustering Approach, World Academy of Science, Engineering and Technology, pp. 853-858, 2010.
11. Boetticher.G and D. Eichmann, “A Neural Network Paradigm for Characterising Reusable Software,” Proceedings of The 1st
Australian Conference on Software Metrics, 18-19 November 1993.
12. Michail.A. Data Mining Library Reuse Patterns Using Generalized Association Rules. In Proc. International Conference on Software Engineering (ICSE), pp 167–176, 2000.
13. Witten I. and Frank E., Data Mining: Practical Machine Learning Tools And Techniques, 2nd Edition, Morgan Kaufmann, San Francisco, 2005.
14. R Development Core Team, R: A Language and Environment for Statistical Computing, R Foundation for Statistical Computing, Vienna, Austria, 2008 [http://www.R-Project.Org].
15. Mierswa, I. M. Wurst, R. Klinkenberg, M. Scholz And T. Euler, Yale: Rapid Prototyping For Complex Data Mining Tasks. in: Proceedings of The 12th ACM Sigkdd International Conference on Knowledge Discovery and Data Mining, ACM Press, 2006, pp. 935-940.
16. Zaki, M.J. Parimi,N. . Gao N. De, F, B. Phophaakdee, J. Urban, V. Chaoji, M. Al Hasan and S Salem, Towards Generic Pattern Mining, Lecture Notes in Computer Science (2005), 91-97.
17. Murthy S.K., Automatic Construction of Decision Trees from Data: A Multidisciplinary Survey, Data Mining And Knowledge Discovery 2, 345-389.
18. Briand L. C. , S. Morasca , and V. R. Basili, Defining and Validating Measures for Object-Based High-Level Design, IEEE Transactions on Software Engineering, Vol. 25, No. 5, 1999, pp. 722-743
19. Chidamber S.R.,. Kemerer. C.F, “A Metrics Suite for Object Oriented Design”, IEEE Transactions on Software Engineering, 20 (6), 476-493, 1994.
20. ] Basili V. R., Briand. L. & Melo, W. “How reuse influences productivity in object-oriented systems”. Communications of the ACM, Vol. 30, N. 10, pp104-114, 1996.
21. Tim Menzies, Justin S. Di Stefano. “More Success and Failure Factors in Software Reuse", IEEE Transactions on Software Engineering, May 2003
22. Henry W. Li, S., “Object-Oriented Metrics That Predict Maintainability”, Journal of Systems and Software, 23 (2), 111-122, 1993.
23. Sonia Manhas, Rajeev Vashisht, Reeta Bhardwaj “Framework for Evaluating Reusability of Procedure Oriented System using Metrics based Approach” International Journal of Computer Applications Vol 9, Nov – 2010.
24. www.wikipedia.org/wiki/Precision_and_recall