Automatic Interpretation of Clock Drawings for
Computerised Assessment of Dementia
Zainab Harbi
Cardiff University
School of Engineering
This thesis is submitted in fulfilment of the requirement of the degree of
Doctor of Philosophy
September 2017ii
All praise is due to Allah,the most gracious, the most merciful.
Peace and blessings be upon our prophet Mohammed and upon
his family and companions
******
iii
Declaration and Statemnets
DECLARATION
This work has not been submitted in substance for any other degree or award at this or any other university or place of learning, nor is being submitted concurrently in candidature for any degree or other award.
Signed ……… (candidate) Date ……….………
STATEMENT 1
This thesis is being submitted in partial fulfilment of the requirements for the degree of ……… (insert MCh, MD, MPhil, PhD etc, as appropriate)
Signed……….……… (candidate) Date ……….……
STATEMENT 2
This thesis is the result of my own independent work/investigation, except where otherwise stated, and the thesis has not been edited by a third party beyond what is permitted by Cardiff University’s Policy on the Use of Third Party Editors by Research Degree Students. Other sources are acknowledged by explicit references. The views expressed are my own.
Signed ……….…… (candidate) Date ………
STATEMENT 3
I hereby give consent for my thesis, if accepted, to be available online in the University’s Open Access repository and for inter-library loan, and for the title and summary to be made available to outside organisations.
Signed ………..…..….. (candidate) Date ……… STATEMENT 4: PREVIOUSLY APPROVED BAR ON ACCESS
I hereby give consent for my thesis, if accepted, to be available online in the University’s Open Access repository and for inter-library loans after expiry of a bar on access previously approved by the Academic Standards & Quality Committee.
iv
Abstract
The clock drawing test (CDT) is a standard neurological test for detection of cognitive impairment. A computerised version of the test has potential to improve test accessibility and accuracy. CDT sketch interpretation is one of the first stages in the analysis of the computerised test. It produces a set of recognised digits and symbols together with their positions on the clock face. Subsequently, these are used in the test scoring. This is a challenging problem because the average CDT taker has a high likelihood of cognitive impairment, and writing is one of the first functional activities to be affected. Current interpretation systems perform less well on this kind of data due to its unintelligibility. In this thesis, a novel automatic interpretation system for CDT sketch is proposed and developed. The proposed interpretation system and all the related algorithms developed in this thesis are evaluated using a CDT data set collected for this study. This data consist of two sets, the first set consisting of 65 drawings made by healthy people, and the second consisting of 100 drawings reproduced from drawings of dementia patients.
This thesis has four main contributions. The first is a conceptual model of the proposed CDT sketch interpretation system based on integrating prior knowledge of the expected CDT sketch structure and human reasoning into the drawing interpretation system. The second is a novel CDT sketch segmentation algorithm based on supervised machine learning and a new set of temporal and spatial features automatically extracted from the CDT data. The evaluation of the proposed method shows that it outperforms the current state-of-the-art method for CDT drawing segmentation. The third contribution is a new
v
handwritten digit recognition algorithm based on a set of static and dynamic features extracted from handwritten data. The algorithm combines two classifiers, fuzzy k-nearest neighbour’s classifier with a Convolutional Neural Network (CNN), which take advantage both of static and dynamic data representation. The proposed digit recognition algorithm is shown to outperform each classifier individually in terms of recognition accuracy.
The final contribution of this study is the probabilistic Situational Bayesian Network (SBN), which is a new hierarchical probabilistic model for addressing the problem of fusing diverse data sources, such as CDT sketches created by healthy volunteers and dementia patients, in a probabilistic Bayesian network. The evaluation of the proposed SBN-based CDT sketch interpretation system on CDT data shows highly promising results, with 100% recognition accuracy for heathy CDT drawings and 97.15% for dementia data.
To conclude, the proposed automatic CDT sketch interpretation system shows high accuracy in terms of recognising different sketch objects and thus paves the way for further research in dementia and clinical computer-assisted diagnosis of dementia.
vi
ACKNOWLEDGEMENT
First, I am grateful to Allah (My Lord) the all high, the all great who made it possible for me to finish this work.
Second, I would like to thank my supervisors, Dr. Yulia Hicks, and Prof. Rossitza Setchi not only for their constant assistance, excellent guidance, and thoughtful advices, but also for their constant support and encouragement. I would also like to thanks my co-supervisor Prof. Antony Bayer from Llandaough hospital for his valuable advice.
I would like also to thank my colleagues in Knowledge Engineering Systems (KES) group, Dr. Bennaser, Dr. Romli, Dr. Anuar, Dr. Saadi, and Mr. O'Regan for stimulating discussion and their kind support.
I would like also to gratefully acknowledge establishment of martyrs, republic of Iraq-presidency of ministers for my PhD sponsorship.
Finally, I would like to express my sincere gratitude and appreciation to my late father, and my beloved family: my mother, sisters, husband, for their endless love, support and prayers. Thanks also to my beloved kids Mohammed and Zahraa.
Zainab Harbi
Table of Contents
Declaration and Statements………..….………....ii
Abstract……….….………...iv Acknowledgment……….……….v Table of Content………...….………....vi List of Figures………...…..ix List of tables……….………..…….…xi List of Abbreviations………....…..xii Chapter: 1 Introduction Motivation ... 1
Aims and Objectives ... 6
Thesis Outline ... 7
Chapter: 2 LiteratureReview Clock Drawing Test ... 9
Computer-Based CDT ... 14
Sketch Interpretation ... 17
Supervised Machine Learning ... 21
Segmentation ... 26
Handwriting Recognition ... 29
Knowledge Representation and Ontology ... 33
Reasoning Systems ... 34
Rule-based Reasoning ... 35
Bayesian Networks ... 36
Situation Assessment ... 39
Summary ... 40
Chapter: 3 Conceptual Model of CDT Sketch Interpretation System Data Capture ... 44
Data Sets ... 48
CDT Sketch Interpretation System ... 49
CDT Sketch Interpretation Definition ... 49
Conceptual Model………...…..49
i
Chapter: 4 Segmentation of CDT Sketches Based on Spatial and Temporal Features
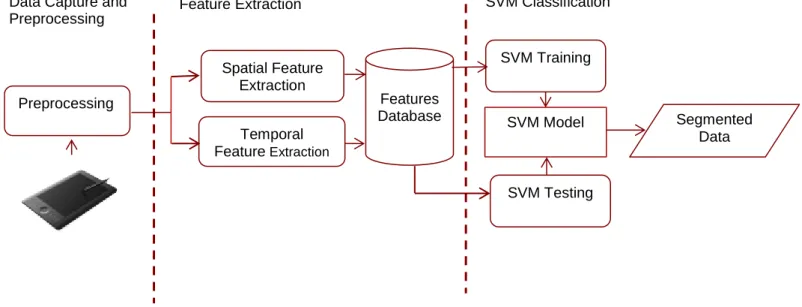
Proposed Segmentation System ... 58
Data Preprocessing... 60
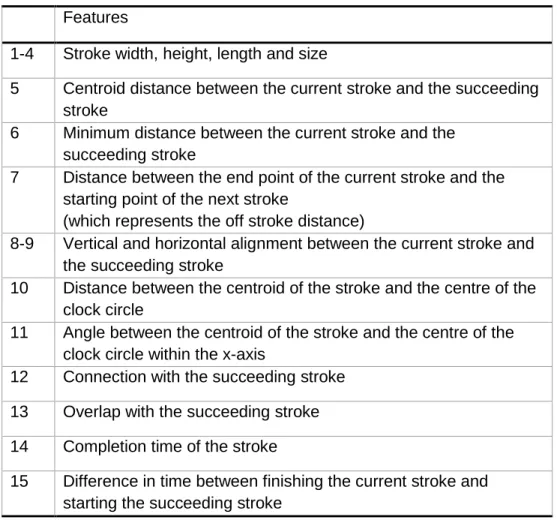
Feature Extraction ... 60
SVM Classification ... 64
Data Set and Experiment Setup ... 65
Results and Discussion ... 66
Summary ... 70
Chapter: 5 CDT Object Recognition using Static and Dynamic Features The Proposed Handwriting Digit Recognition System ... 72
Preprocessing and Normalisation ... 74
Static Feature Classification ... 75
Dynamic Feature Classification ... 77
Combining Classifier Output ... 78
Clock Hands Recognition ... 80
Data Sets and Experiments Set up ... 82
Results and Discussion ... 84
Digit Recognition ... 84
Clock hands Recognition ... 88
Summary ... 89
Chapter: 6 Rule Based Approach for CDT Sketch Interpretion System The Proposed System ... 92
Geometrical Features Extraction ... 93
Object Recognition ... 93
Ontology Knowledge Representation ... 94
Fuzzy Rules and The Inference Engine... 96
Evaluation and Discussion ... 99
Summary ... 102
Chapter: 7 Probablistic Approach for CDT Sketch Interpretation Situational Bayesian Network ... 104
Bayesian Network ... 104
Situation Assessment ... 107
ii
CDT Sketch Interpretation Based on SBN ... 109
Situational Assessment Layer ... 110
Bayesian Network Structure ... 112
Evaluation and Discussion ... 114
Situational Bayesian Network ... 115
Probabilistic CDT Sketch Interpretation ... 117
Summary ... 122
Chapter: 8 Conclusions and Future Work 8.1 Contributions………...…………...………...124
8.2 Conclusions………..…………...…………..…125
8.3 Future Work………..……….129
iii
List of Figures
Figure 2-1: Examples of clocks drawn by patients at Llandough Hospital, Cardiff, UK: (a) Normal elderly; (b) Alzheimer’s disease; (c) Mild dementia; (d) Vascular
dementia. ... 11
Figure 2-2: Examples of segmentation challenges in CDT sketches. ... 27
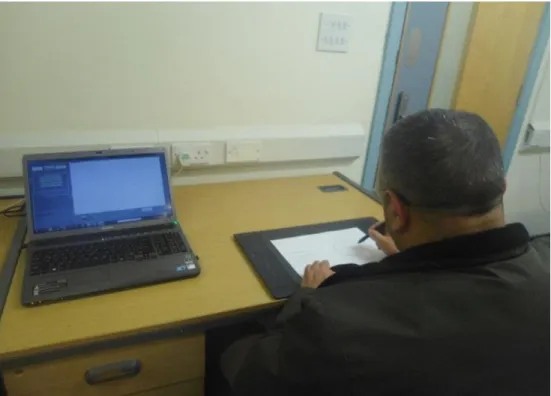
Figure 3-1: Data capturing using a Wacom digitiser tablet. ... 46
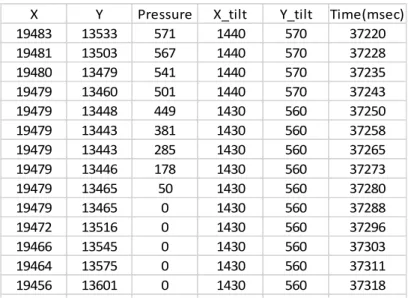
Figure 3-2: CDT-captured online data. ... 47
Figure 3-3: CDT digitiser interface. ... 47
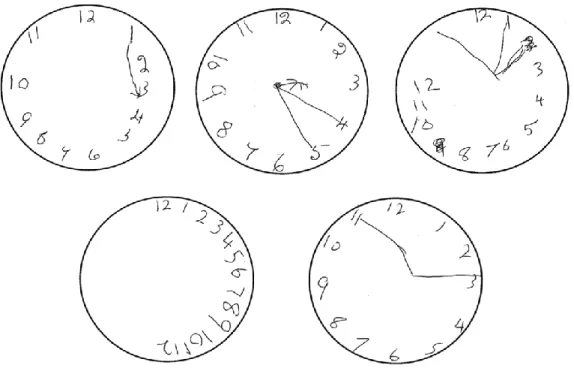
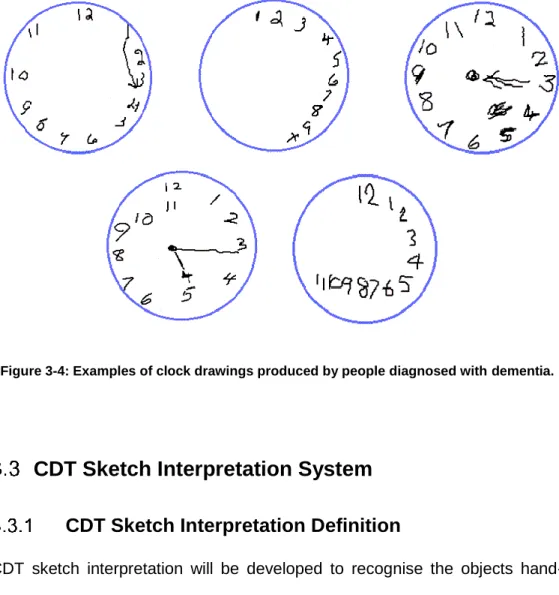
Figure 3-4: Examples of clock drawings produced by people diagnosed with dementia. ... 49
Figure 3-5: Contextual effect on handwriting recognition. ... 50
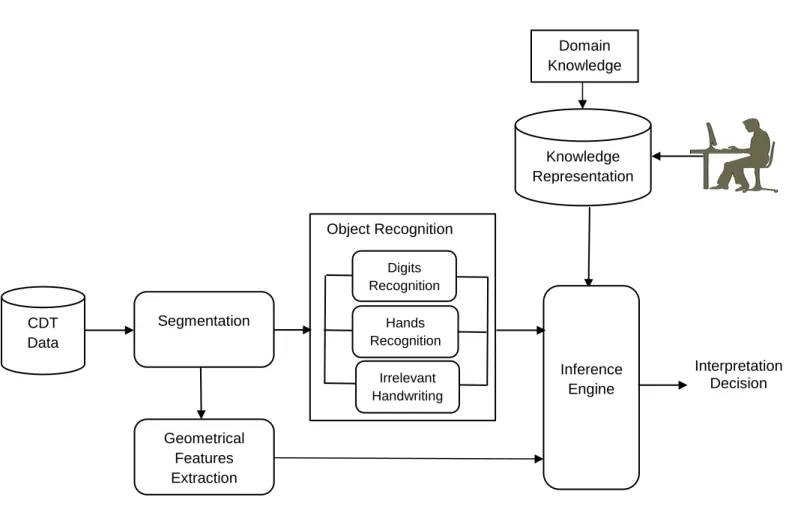
Figure 3-6: Conceptual model of CDT interpretation system. ... 52
Figure 4-1: Proposed segmentation system ... 59
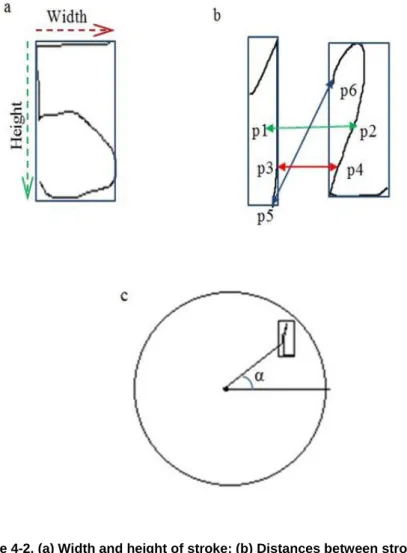
Figure 4-2. (a) Width and height of stroke; (b) Distances between strokes: (p1-p2) centroid, (p3-p4) minimum, and (p5-p6) end to start distance; (c) Angle between the stroke and the centre. ... 62
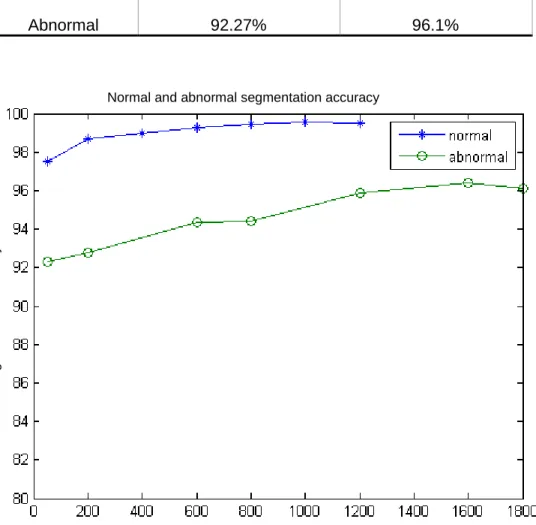
Figure 4-3: Segmentation accuracy versus size of the data set for both normal and abnormal drawings ... 67
Figure 4-4. (a) Original image; (b) Segmentation using a connected component algorithm;(c) Segmentation using the proposed algorithm ... ... 68
Figure 5-1: Proposed handwriting digit recognition system. ... 73
Figure 5-2: Examples of clock hands from CDT data set (a) healthy, (b) dementia ... 82
iv
Figure 5-3: Examples of incorrectly classified digits by the proposed handwriting digit recognition system. First line shows examples from pendigits data set, second line shows examples from normal digits while third one are examples
from abnormal digits. The label is corresponding truth->predicted. ... 88
Figure 6-1: Rule-based CDT interpretation system ... 92
Figure 6-2: Clock Ontology ... 95
Figure 6-3: Examples of CDT interpretation system labelling: (a) example from healthy data and (b) example from dementia data. ... 100
Figure 7-1: Decision process and situation analysis adapted from Bladon et al. (2002). ... 107
Figure 7-2: SBN Model. ... 108
Figure 7-3: Situation assessment layer for SBN-based CDT interpretion... 111
Figure 7-4: BN structure for SBN-based CDT interpretation. ... 113
Figure 7-5: Successful CDT sketch interpretations from dementia data using the proposed SBN. ... 120
Figure 7-6: Unsuccessful CDT sketch interpretations from dementia data using the proposed SBN. ... 121
v
List of Tables
Table 4-1: List of stroke features. ... 61 Table 4-2: Segmentation accuracy of normal and abnormal drawings. ... 67 Table 5-1: Recognition accuracy of Pendigits, normal and abnormal digits with MLP and CNN. ... 85 Table 5-2: Recognition accuracy of Pendigits, normal and abnormal digits with dynamic representation and KNN, MLP, Lib SVM, Naïve Bayes and RBF Network. ... 86 Table 5-3: Recognition accuracy of Pendigits, normal and abnormal digits for the combination system ... 87 Table 5-4: Recognition accuracy of normal and abnormal clock hands and irrelevant handwriting ... 89 Table 6-1: Fuzzy rules to be used by the interpretation system inference engine for clock numbers (Ac for accepted and Rej for rejected). ... 97 Table 6-2: Fuzzy rules to be used by the interpretation system inference engine for clock hands (Ac for accepted and Rej for rejected). ... 98 Table 6-3: Recognition accuracy of normal and abnormal sketch objects using the baseline and the proposed systems ... 99
Table
7-1: CDT interpretation accuracy using BN trained only on normal data, BN trained on all data, and SBN ... 115 Table 7-2: CDT interpretation accuracy using recognition-, rule-based and SBN approaches. ... 119vi
List of Abbreviations
CDT Clock Drawing Test
AI Artificial Intelligence
ML Machine Learning
SVM Support Vector Machine
kNN k-Nearest Neighbours
DNN Deep Neural Networks
CNN Convolutional Neural Network
BN Bayesian Network
SBN Situational Bayesian Network MLP Multi-Layer Perceptron
MNIST Modified National Institute of Standards and Technology UCI University of California, Irvine
MatConvNet Matlab Convolutional Network RBF Radial Basis Function
CPT Conditional Probabilistic Table
SSBN Structured Situational Bayesian Network USBN Unstructured Situational Bayesian Network
vii
List of Publications
Publications as a main author:
Harbi, Z., Hicks, Y., Setchi, R. and Bayer, T., 2015. “Segmentation of Clock Drawings Based on Spatial and Temporal Features”, 19th International Conference on Knowledge-Based and Intelligent Information and Engineering Systems, Singapore, pp.1640-1648.
Harbi, Z., Hicks, Y. and Setchi, R., 2016. “Clock Drawings Test Digit Recognition Using Static and Dynamic Features”, 20th International Conference on Knowledge-Based and Intelligent Information and Engineering Systems, York, United Kingdom, pp.1221-1230.
Harbi, Z., Hicks, Y. and Setchi, R., 2017. “Clock Drawings Test Interpretation System”, 21 International Conference on Knowledge-Based and Intelligent Information and Engineering Systems, Marseille, France, pp.1641-1650.
The author has also contributed to other publications in related work. These publications were not a part of this thesis, these are:
Shigemori, T., Harbi, Z., Kawanaka, H., Hicks, Y. and Setchi, R., 2015. “Feature Extraction Method for Clock Drawing Test”, 19th International Conference on Knowledge-Based and Intelligent Information and Engineering Systems, Singapore, pp.1707-1714.
Shigemori, T., Harbi, Z., Kawanaka, H., Hicks, Y. and Setchi, R., 2015. “A Study on Feature Extraction Method for Clock Drawing Images Using Weighted Direction Index Histogram”, 31st Fuzzy System Symposium, Chofu, September 2-4, 2015.
1
Chapter: 1
Introduction
Motivation
The Clock Drawing Test (CDT) has been used for decades as a screening tool to differentiate normal individuals from those with cognitive impairment. The CDT assesses the cognitive domains of comprehension, planning, visuospatial ability, visual memory, motor programming and execution, abstraction, concentration and response inhibition. The major benefit of the CDT is to provide a concrete visual reference of the patient’s cognitive dysfunction associated with neurological disorders such as Alzheimer’s and Parkinson’s diseases and other dementia types.
At present, a CDT is usually administrated in a hospital environment by a clinician. Patients are asked to draw a clock by using a pencil on a sheet of paper. The most common instructions are: ‘Draw a clock face in a pre-drawn circle and place the numbers on it. Then set the time to a specific time [usually five minutes to three].’ After that, the clinicians would spend hours analysing and scoring the tests using one of a number of subjective scoring systems that have a set of analytical rules. These systems have different degrees of complexity, which can range from simple binary rating to more complex qualitative and quantitative systems that capture a wide variety of errors in the drawn clock. This sort of assessment can often result in the assignment of a
2
specific ‘score’ to the patient’s output, based on which conclusion about the patient’s status can be made.
The main drawbacks of these scoring systems is their subjectivity and the time required for evaluation. In addition, not a single scoring system has been universally accepted as the most effective. Moreover, the inter-rater reliability in scoring can undermine effective objective assessment. Finally, these assessments almost always relate to the analysis of the end-product of the patient activity (i.e., the finished test output, seen as a complete entity, which is the drawn clock); they rarely attempt to provide an indicator of the underlying execution process. Investigating behavioural dysfunction during the test’s execution can provide important extra information about the impairments attributable to various neurological conditions.
Recently, a number of computerised systems for administering the CDT have been proposed, such as online data capture using smart pens or graphic tablets. Moving towards a system of online data capture and automated assessment can bring significant solutions to the shortcomings noted above. In addition to eliminating the problem of subjective scoring, online data capture is able to acquire additional dynamic data, whereby sequential and constructional information about the drawing process is collected and stored.
When administrating the test using a digital pen, touch screen tablet or digitiser, the test is recorded as a sequence of time-stamped drawing pixels. These input devices enable the capture of new information regarding the completion and thinking time, the planning strategies and the pressure and inclination of the pen on the paper (or the stylus on the tablet surface). In previous research, such data was shown to be significant when assessing the mental state of the
3
patients. Supplementing the computerised CDT with online data capture offers an advantage for diagnosing impairments related to various neurological disorders.
With computer-based CDT, the problem of automatic assessment has been highlighted. The assessment is based on identifying abnormalities in the drawings, which may include poor number positioning, omission of numbers, incorrect sequencing, missing clock hands and the presence of irrelevant writing. An automatic CDT sketch interpretation system is required so that the assessment is effective and reliable. The system can be challenged by unexpected input from a patient with a cognitive disorder. The limitations of the current state of the art make it difficult for an automated system to interpret clock drawings in a manner that matches human cognition. For example, the labelling of each of the sketched objects such as clock hours, hands or other drawing artefacts is still considered a challenging task.
Automatic sketch interpretation has received considerable attention in recent years as a means of communicating between humans and machines. Sketch-based communication is very attractive to people, as drawing by hand provides an easy way to input information. Sketch interpretation is a special case of image interpretation in which two general approaches can be identified. There is the classical recognition approach—in which object recognition depends solely on the object’s features—and knowledge-based where additional features relating to the context is used in the recognition process. Acknowledging the inherent trade-off between drawing freedom and interpretation accuracy, a number of successful approaches in limited interpretation domains have been developed, which benefit from exploiting the
4
contextual information. A CDT interpretation system could further utilise the advantages of prior knowledge, along with possible interpretations from the classical recognition systems, to improve the accuracy of recognition.
However, interpreting a CDT sketch produces new challenges regarding the abnormalities of the test context. As this test is designed for assessing cognitive impairment, a poorly-drawn object is to be expected. The main challenges in any CDT interpretation system are: first, segmenting the CDT sketches into objects; second, recognising these objects; and finally, deriving inferences from prior knowledge in order to improve and complete the CDT drawing interpretation. All these challenges have been addressed in this research and a solution is proposed in each area.
In order to recognise objects in a CDT sketch, accurate segmentation of the sketch is required. Segmentation is an important step in any recognition system, since it directly influences the recognition accuracy. A drawing of a clock is a special case of handwriting, but in terms of segmentation, it is much more difficult. This difficulty is due to the fact that in a CDT, the writing does not proceed in one direction, but changes direction arbitrarily. Moreover, in cognitive impairment cases, most objects’ aspects and spaces between elements are not preserved. Thus, the traditional handwriting segmentation algorithm would not be applicable in this area, and so a new algorithm is required. The supervised learning-based segmentation method is a new approach, and its application in a free handwriting platform would be attractive to resolving the CDT segmentation problem. Furthermore, a suitable segmentation system would consider the advantage of acquired temporal
5
information recorded by the online data capture of computerised CDT system in addition to the conventional spatial features.
In this research, most of the sketched objects are numbers, so the focus is on handwriting recognition. Recognising the handwriting of people with cognitive impairment is challenging, since their writing skills are often affected. Handwriting recognition is a large area in which many algorithms for both offline and online handwriting have been developed. Previous studies in computerised CDT have highlighted the handwriting recognition problem, but since their focus was on data capturing, they used existing algorithms. These algorithms relied on the shape or position of the objects which, in the case of CDT drawings from people with moderate or severe dementia, could lead to misclassifications due to the unusual positions or shapes of the clock digits. Hence, a new algorithm is required to tackle the problem of recognising CDT sketch objects. Offline handwriting recognition systems focus on the static image features, while online systems consider dynamic features related to the process of writing. Combining multiple classifiers, with each one an expert on a particular feature, has been a successful means of handwriting recognition and could improve the accuracy of CDT object recognition.
Integrating a state-of-the-art recognition system with domain-specific reasoning would improve the interpretation system’s performance. The more a dementia patient deviates from the expected baseline, the more challenging becomes CDT sketch interpretation. Patients can sketch elements in the wrong position, repeat numbers or omit them completely. They can also add components that are neither hands nor numerals. Thus, a flexible and comprehensive reasoning system is required. In terms of image interpretation, there are two general
6
approaches: the rule-based or expert system; and the probabilistic-based. Both approaches have their advantages and disadvantages, but within their application area, there has been little work investigating them. Moreover, the unstructured nature of abnormal CDT sketches (i.e. those produced by severe dementia patients) can introduce new challenges to applying these approaches. Thus, both avenues have been investigated in this research to highlight their functioning in this area.
Aims and Objectives
The scope of this project is a system for interpreting CDT sketches. The project aims to develop an automatic CDT sketch interpretation system as a step towards a computerised CDT. This system is envisaged to assist in the detection of dementia symptoms at the point of care. This will be achieved by developing an intelligent interpretation system based on artificial intelligence (AI) and machine learning techniques.
The specific objectives necessary to achieve the aim are identified as:
1. Creation of a conceptual model for an automatic CDT sketch interpretation system that can assist in developing the computerised CDT system for automatic assessment and early diagnosis of dementia.
2. Development of a novel algorithm to segment the CDT sketches into a number of objects, based on spatial and temporal features.
3. Development of a new handwriting recognition system that can recognise bad handwriting that is expected within the problem context.
7
4. Development of a knowledge-based reasoning approach for CDT sketch interpretation that can integrate domain knowledge with reasoning to improve the interpretation process. Two approaches for reasoning to be considered are the rule-based and probabilistic-based approaches.
Thesis Outline
This thesis is organised into the following structure:
Chapter 1 provides an introduction to the work.
Chapter 2 presents a review of the background information surrounding CDT and the computerised system, and discusses related work in the field. It also reviews the relevant literature related to image interpretation, image segmentation, object recognition, knowledge representation and reasoning systems.
Chapter 3 proposes a conceptual model for the CDT sketch interpreta-tion system. It also provides an overview of the process of collecting clock sketch data and the computerised CDT.
Chapter 4 introduces a novel segmentation algorithm for segmenting the CDT sketches.
Chapter 5 proposes a new recognition system, along with its validation by using Pendigits, a benchmarking data set.
Chapter 6 introduces the knowledge rule-based approach for automatic CDT sketch interpretation.
8
Chapter 7 introduces the probabilistic approach for automatic CDT sketch interpretation and compares it to the rule-based approach.
Chapter 8 highlights the contributions, and conclusions of this thesis, and proposes further work.
9
Chapter: 2
Literature Review
This chapter reviews previous research related to the work presented in this thesis. In particular, research in the areas of manual and computerised CDT assessment is reviewed in Section 2.2. Related areas of automatic sketch interpretation and machine learning methods are considered in the context of automatic CDT interpretation in Sections 2.3 and 2.4. Research on handwriting segmentation and recognition is reviewed in Sections 2.5 and 2.6. Finally, methods for knowledge representation, reasoning systems and situation assessment are reviewed in Sections 2.7–2.9. Section 2.10 summarises the chapter.
Clock Drawing Test
The clock drawing test has been widely employed as a tool for the assessment of cognitive abilities and neurological disorders over the past 30 years (Shulman, Shedletsky and Silver, 1986; Rouleau et al., 1992; Juby, Tench and Baker, 2002; Pinto and Peters, 2009; Spenciere, Alves and Charchat-fichman, 2017). It is used as a stand-alone test or as a part of general screening for cognitive changes such as: the Mini-Cog screening (Borson et al., 1999); the Cambridge Cognitive Examination (CAMCOG) (Schmand et al., 2000); and the Montreal Cognitive Assessment (MoCA) (Charbonneau, Whitehead and Collin, 2005). Researches show a high correlation between the results obtained via CDT and those acquired by other more detailed and time-consuming cognitive
10
assessment tools. The CDT is widely employed as a follow-up instrument because it can be easily and quickly applied, is well accepted by patients and is relatively independent of language, education and culture (Shulman, 2000).
During the test, the individual is asked to draw a clock face by using a pencil on a provided sheet of paper, then draw the hands to a specific time. The task of drawing a clock seems a simple one; however, to a neurologist it is a complex task, one that requires many neurological functions involving various brain regions. The CDT assesses the cognitive domains of comprehension, planning, visuospatial ability, visual memory, motor programming and execution, abstraction, concentration and response inhibition (Freedman et al., 1994). The CDT has been shown to be a useful screening tool to differentiate normal individuals from those with cognitive impairments such as Alzheimer’s and other dementia conditions (Pinto and Peters, 2009; Mazancova et al., 2016; Vyhnálek et al., 2016). Figure 2-1 shows an example of clocks drawn by patients with different types of dementia.
11
a b
c d
Figure 2-1: Examples of clocks drawn by patients at Llandough Hospital, Cardiff, UK: (a) Normal elderly; (b) Alzheimer’s disease; (c) Mild dementia; (d) Vascular dementia.
There are two ways in which individuals may be asked to perform the test. They could be given either 1) a verbal command to draw the clock and set the hands to a specific time; or 2) instructions to copy a given template. There is a difference between these methods in terms of the cognitive function required to understand the instructions and perform the test (Freedman et al., 1994). The verbal command is often further categorised into three different forms: 1) free-hand CDT, in which the individual is instructed to draw the face of the clock on a blank sheet of paper; 2) pre-drawn CDT, in which the individual is provided with a sheet of paper with a pre-drawn circle as a contour of the clock, and he or she is asked to complete the clock with the numbers and time; and 3) the
12
examiner CDT, where the individual is given a clock drawing with all the numbers written on it, then asked to set the hands to a specific time. The free-hand CDT has been criticised for the influence of the clock’s contour; for example, if the circle is drawn too small or is distorted, then the rest of the drawing will also be impaired (Pinto and Peters, 2009).
The time setting on the clock can also be varied in a CDT. The time settings most sensitive to neurocognitive dysfunction, and hence the most widely used, are ‘10 past 11’, ‘20 past 8’, and ‘5 to 3’. For these time settings, the hands are drawn in both the right and left visual fields, which calls upon the functionality of both hemispheres of the brain.
Currently, the clinical administration of the CDT in a hospital environment is performed by medical practitioners such as neuropsychologists, neurologists and clinical nurses (Shulman and Feinstein, 2005; Grober et al., 2008). The clinicians score the tests manually using various subjective scoring systems that have a set of analytical rules. There are many scoring systems, which have been developed to assess clock drawings and to diagnose cognitive impairments from the drawings (Shulman, Shedletsky and Silver, 1986; Mendez, Ala and Underwood, 1992; Rouleau et al., 1992; Tuokko et al., 2000; Jouk, 2007; Parsey and Schmitter-Edgecombe, 2011; Mendes-santos et al., 2015; Ricci et al., 2016). Each of these systems places an emphasis on a subset of cognitive functions. They have a different range of complexities, from a simple binary rating to more complex qualitative and quantitative assessments (Ismail, Rajji and Shulman, 2010). The most recent literature in this area can be found in (Spenciere, Alves and Charchat-fichman, 2017)). During the development of the scoring systems, most of the researchers proposed their
13
own methods to assess errors in the drawing, which could be qualitative and/or quantitative. The methods were usually proposed based on the personal experiences of the researchers using the CDTs, which explains why most of the scoring systems employ different lists of assessed errors (Shulman, Shedletsky and Silver, 1986; Mendez, Ala and Underwood, 1992).
While there are many well-regarded systems for manually scoring CDTs, they have their drawbacks, some of which are listed below:
1. Many of the scoring systems can be complex in design and require very detailed assessment rules. While the simplest ones can undermine effective objective assessment, the complex methods are far too labour-intensive and time consuming for routine use (Ricci et al., 2016).
2. The scoring systems often rely on the clinician’s subjective assessment (Price et al., 2011). For instance, one current scoring system calls for judging whether ‘the clock face must be a circle with only minor distortion acceptable’. Without providing a quantitative definition, this can lead to variability in scoring and analysis.
3. A lack of consensus on which criteria produce the best results (Spenciere, Alves and Charchat-fichman, 2017). Because of the inter-rater reliability in scoring, no system has been universally accepted as the most effective.
4. Although visual analysis can determine both qualitative and quantitative assessment of performance, these are almost always related to the analysis of the end-product of the test, which is the drawn clock without any indication of the underlying execution process. There is
14
temporal/constructional (also called ‘dynamic’) information inherently embedded in the test response (Potter et al., 2000). This dynamic information can characterise a behavioural dysfunction and provide a much richer source of valuable diagnostic data on various neurological conditions (Werner et al., 2006; Heinik et al., 2010; Rosenblum et al., 2013).
The above limitations may reduce the robustness of the CDT test and its usefulness as a cognitive impairment-screening tool. In recent research, computerised systems for administering the CDT have been proposed (Heinik et al., 2010; Kim, 2013). Using automatic assessment has the potential to bring significant advantages in dealing with the issues listed above, as will be discussed in the next section.
Computer-Based CDT
Since the advent of the personal computer, a significant amount of effort has been invested in developing a computerised tool to perform neurological assessment (Wild et al., 2008). Some of these assessment tools adapted standardised tests in a new way in order to benefit from the computer’s abilities in terms of administration and analysis of existing tests. Other tools presented an entirely new computer test to assess cognitive function. Examples include the Automated Neuropsychological Assessment Matrix (ANAM) (Rice et al., 2011), the Computer-Administered Neuropsychological Screen for Mild Cognitive Impairment (CANS-MCI) (Tornatore et al., 2005), the Cambridge Neuropsychological Test Automated Battery (CANTAB) (Robbins and
15
Sahakian, 1988) and the Computerised Neuro-psychological Test Battery (CNTB) (Culter et al., 1993).
Recently, a number of computerised systems have been developed to analyse and diagnose CDT drawings (Heinik et al., 2010; Kim, 2013; Bennasar, 2014; Davis et al., 2014). The research in this area has generally fallen into two groups. The first group focuses on developing a computer system for analysing and assessing the output of the paper-based CDT (the drawn clock), while the second administers the CDT using a digital pen, a digitiser or tablet computer, with these devices capturing the test onto an online database.
In recent research (Bennasar, 2014), supervised classification algorithm SVM and Random Forest (RF) with a set of features extracted from the clock images were used to score the CDT drawings automatically. The system was able to classify CDT drawings into several classes, including healthy and several kinds of dementia with an accuracy of 89.5%, which is comparable to that of medical practitioners. The author also identified new CDT features important for such a classification. However, most of the scoring features are extracted manually from the drawn clocks and only features extracted from the clock images (static features) are employed.
In another approach in computerised CDT, the system is used to administer the test in addition to automatically assessing it. The first studies in this area (Heinik et al., 2010) used a graphical tablet to capture the CDT output. A set of extracted kinematic features were examined for their importance in the diagnosis of mild Major Depressive Disorder (MDD). The focus group included 20 patients and 20 healthy individuals. The study explored seven features: the mean number of drawn segments, mean time to complete the task, mean pressure on the writing
16
surface, mean angle between the pen projection and the north line, segments’ width, segments’ height and segments’ length. The achieved accuracy in classifying mild MDD was 81.1%, with the most important factors being the writing pressure. Although the importance of dynamic features was highlighted, this study did not include the static features in which the original test was proposed.
Another study (Kim, 2013) employed a tablet computer for recording the drawing process so that clinicians could examine the planning strategy of the patients. The study introduced air time as a new feature, which was defined as the time during which the individual stopped drawing before resuming. The usability of the system was examined, with great acceptability reported from both subjects and practitioners. The work focused primarily on the user interface and did not specify the accuracy of the system in differentiating between normal and abnormal cases. However, the problem of labelling clock elements such as hands and numbers was identified.
A research neuropsychologist group at MIT (Davis et al., 2014) has been administering the CDT by using a digitising pen (DP-201, Anoto, Inc.) which works by recording its position on the page on temporal bases. More than 200 static and dynamic features have been introduced and used with machine learning in order to classify various dementia conditions. The challenge of automatically understanding the drawings (that is, determining the right label for every object) was also noted (Song et al., 2016). More recently, the CDT has been administered by a Wacom critique 13HD pen display (Shi et al., 2016), and new 3D orientation dynamic features were introduced for diagnosis.
17
Computing technologies have many advantages over traditional paper-based test, as have been shown in many studies (Brown and Brown, 2009; Dougherty et al., 2010; Leposavić, Leposavić and Šaula-Marojević, 2010). First, they can support the administration process through automatic data collection. Second, they can decrease the subjectivity of test examiners’ interpretations because of the support of automatic analysis, which can increase test standardisation. Third, they are able to acquire new behavioural data by capturing the execution process (Fairhurst et al., 2008; Liang et al., 2010). Dynamic data could not be captured or measured using paper tests, and now they provide a much richer source of potentially valuable diagnostic data. These systems capture both the result of the drawing and the behaviour that produced it: every pause, hesitation and time spent simply holding the pen versus writing. Such information helps in assessing the cognitive functions of the patients even when the test result appears superficially normal. Information such as how long the participant spent in the test could spotlight a cognitive problem with normal drawings (Guha, Kim and Do, 2010). Moreover, the test can be administered by a GP or even a nurse without the need for specialist medical practitioners.
To conclude, the computerised system could bring a number of advantages in terms of increased diagnostic accuracy and simplification the administration process. However, in order to take advantage of these opportunities, an automatic system for labelling different parts of the CDT sketches is required.
Sketch Interpretation
Image interpretation is the process of giving meaning to an image by identifying and labelling its objects (Kumar and Desai, 1996). For example, after
18
segmenting an image—that is, partitioning it into multiple segments—each segment is interpreted as being a road, river, building, trees, vehicle, etc. The human visual system is able to describe the image content instantly and without effort. However, for artificial intelligence, image interpretation remains a fundamental challenge (Fleuret et al., 2011). Much of the early successes in machine image interpretation have been made in constrained environments, e.g., remote sensing (Forestier et al., 2012; Huang et al., 2017), text recognition (Aurangzeb et al., 2010) and medical image analysis (Tadeusiewicz and Ogiela, 2004). Image interpretation in unconstrained environments is still largely an open problem (Sonka, Hlavac and Boyle, 1999). Sketches are a special case of images which offer the advantage of being able to adapt computer vision methodology and algorithms (Jorge and Samavati, 2011). For example, one system might represent the sketch as a bitmapped image, then perform image interpretation (Hse and Newton, 2004; Kara and Stahovich, 2005). In addition to these advantages, sketches can be recorded online, with the temporal information being useful in interpretation as reported by other authors (Arandjelović and Sezgin, 2011; Bresler, Průša and Hlaváč, 2016). Nonetheless, the unconstrained nature of sketches produces its own challenges for current image interpretation algorithms (Jorge and Samavati, 2011).
In image interpretation, two main approaches exist: bottom-up and top-down (Behnke, 2003). The bottom-up approach consists of a sequence of steps that transform an image from one representation into another. These steps generally are pre-processing, segmentation, feature extraction and recognition. Image interpretation systems that follow this approach are called classical recognition-based systems (Kopparapu and Desai, 2002). It does not have a hierarchical
19
decision scheme of elimination and acceptance. One popular method belonging to this approach is labelling an image using a statistical classifier based on information at a local level only (Shih, 2010). However, no matter how good the classifier technique is, or how much training data is available, the classifier’s performance will be limited if there is ambiguity in an object’s appearance. While certain post-processing procedures are used to smooth out the outputs of a local classifier, they are usually problem-specific and based on heuristics (Campbell, Mackeown and Thomas, 1997). In CDT sketches, badly drawn objects are expected since the writing skills of people with cognitive impairment are often affected (Rosenblum et al., 2013). Thus, the classical recognition-based approach will be challenged with the impaired object’s appearance.
The top-down approach to image analysis works in the opposite direction. It starts from objects’ models, generates a set of hypotheses in which additional information related to the objects is considered—for example, their position. The hypotheses are matched with the features extracted from the image in order to accept or reject them. This method is successful if good models of image objects are available and one ensures that the correct hypothesis is among the first ones (Behnke, 2003).
Sketch interpretation research with a focus on specific domains has been gaining interest in recent years (Olsen et al., 2009; Jorge and Samavati, 2011). Popular application domains include electrical circuits (Guihuan Feng, Christian Viard-Gaudin, 2009), mathematical equations (Laviola and Zeleznik, 2004) and digital logical circuits (Johnston and Alvarado, 2013). Domain knowledge has been used in most of the above systems in the form of constraints to ease the recognition of objects. However, this was limited to the type of objects expected
20
in a sketch without utilising other knowledge, such as the expected positions of the objects or their relationships with other objects. This kind of information is used extensively by people to solve ambiguity when objects have a similar appearance (Hudelot, Atif and Bloch, 2008).
For computerised CDTs, previously developed sketch interpretation approaches were a classical recognition-based system, in which all objects are segmented, and then a classifier employed for labelling them. In early research (Cho, Kim and Do, 2010) on computerised CDT interpretation, only the shape of the drawing strokes was used to recognise the clock numbers, which could lead to low recognition accuracy when the numbers were badly drawn. A similar approach was used by Shi et al. (2016). Kim et al. (2010) used Microsoft’s recognition engine for recognising clock numbers, and suggested further post-processing by considering the context. That is, the recognised characters were converted into appropriate numeric digits. As Kim stated, the context is a clock and so no letters were expected. However, irrelevant handwriting is expected from dementia patients (Freedman et al., 1994). In early research (Song et al., 2016), the context of the CDT sketch objects was also taken into account. However, this was limited to recognising clock numbers only, which was similar to all previous proposed CDT sketch interpretation systems that did not include hands or irrelevant writing.
Previous research in image and sketch interpretation focused on top-down or bottom-up approaches, but no research explored the advantages of integrating the two approaches. Yet human vision employs such an integration during the task of image interpretation. A person first produces a set of possible interpretations depending on the object’s appearance. Then the important
21
properties of the objects are compared with a set of expectations that is derived from prior knowledge. Following this process, the nominated hypotheses are further eliminated or accepted. Thus the domain of prior knowledge is employed for final visual inference (Ogiela, 2008). Using such a reasoning process, a person can make interpretations even in difficult cases. This integration has been successfully applied in object detection (Hoiem, Efros and Hebert, 2008; Hedau, Hoiem and Forsyth, 2010; Bao, Sun and Savarese, 2011; Hsiao and Hebert, 2012) and interpreting video-based traffic scenes (Geiger et al., 2014).
Computer vision supports a wide variety of competing paradigms in image interpretation. One approach is supervised machine learning (Kotsiantis, 2007). This approach accounts for many of the successful methods in computer vision such as segmentation and recognition (Wu, 2013). These two processes are essential in the conceptual model of CDT sketch interpretation. More details of supervised machine learning and some of their classifiers are presented in the next section.
Supervised Machine Learning
Machine Learning (ML) is a set of algorithms that give the computer its ability to perform a specific task by learning from data. The most significant application of ML is predictive data mining, which is about extracting patterns and data classification (Somvanshi and Chavan, 2016). These algorithms learn by using training data, in which every instance in the data set is represented by the same set of features. These features could be binary, continuous or categorical. If labels are given, then the learning is called supervised, in contrast to
22
unsupervised learning, where data set is unlabelled (Jain, Murty and Flynn, 1999).
The process of ML begins with data collection and processing (Kotsiantis, Zaharakis and Pintelas, 2006). During this step, issues such as missing values, discretisation and noise removal are resolved by employing pre-processing algorithms. The next step is feature extraction to identify the most relevant features. Then classification, and the final step is the evaluation, in which there are various approaches to perform, all of which are based on dividing the available data into training and testing sets. The only difference is how the division between these data sets is made. Examples of these validation procedures are cross-validation, ‘leave one out’ and ‘third to one’.
Supervised classification is one of the tasks most frequently carried out by so-called Intelligent Systems (Kotsiantis, Zaharakis and Pintelas, 2006). In the following subsection a relevant classifier of this type will be introduced.
Support Vector Machine (SVM)
SVM are discriminative classifier that use a separating hyper-plane to distinguish between the classes (Cortes and Vapnik, 1995). The selected hyper-plane is the one that maximises the margins between the classes. The rationale behind searching for the hyperplane with a large margin is that the largest margin hyperplane should be the one that is more resistant to noise (Ertekin, 2009).
An SVM is a linear classifier suitable for binary classification problems. However, it has the capability to work within high-dimensional feature spaces without any extra computational complexity. This is achieved by mapping the
23
projection of initial data to a feature space with a higher dimension using a kernel function. In this new space, the data are considered as linearly separable. A linear kernel has been recorded to provide the best performance in many applications (Ben-Hur and Weston, 2010).
In addition to the wide use of SVM in recognition systems (Burges, 1998), they have been employed in many handwriting segmentation systems in order to make segmentation point decisions. SVM has been applied successfully for segmentation in text handwriting (Sun et al., 2004), online overlaid handwriting (Lv et al., 2013) and online Japanese handwriting (Fukushima and Nakagawa, 2000).
The k-Nearest Neighbour Classifier
The k-nearest neighbour kNN classifier is one of the oldest and simplest methods used for classification (Cover and Hart, 1967). Despite its simplicity, the kNN gives competitive results and has the advantage of learning from even a small set of examples (Bay, 1998). The label of the observation is predicted based on which class is more common among the kth closest point to that observed in the labelled sample. The best choice of k depends upon the data. Generally, larger values of k reduce the effect of noise on the classification. Several different distance measurements for classification have been used, but the most commonly used function is Euclidean distance (Fosseng, 2013; Zunjarrao, 2017). One difficulty with kNN is that, once an input vector is assigned to a class, there is no indication of the strength of its ‘membership’ in that class. This problem has been addressed by developing fuzzy kNNs in which fuzzy set theory is incorporated into the kNN rule (Keller, Michael and Givens, 1985).
24
kNN has been widely employed and a good performance has been reported in online handwriting recognition (Castro-Bleda et al., 2009; Li, Zhang and Su, 2012; Zunjarrao, 2017) and online symbol sketch recognition (Ouyang and Davis, 2009).
Multilayer Perceptron
The Multilayer perceptron (MLP) is a feed-forward neural network consisting of multiple mutually interconnected layers of neurons (Hornik, Stinchcombe and White, 1989). The layers are stacked one onto each other. Every neuron in one layer is connected to every neuron in the following layer. The ability to learn is the key concept of neural networks. The aim of the learning process is to find the optimal parameters of the network for solving the given task. Learning is carried out on the training set by feeding the training data through the network. It is an iterative process, where the outputs produced on each input from the training set are analysed and the network is repeatedly being adjusted to produce better results. The network is considered to be trained after reaching the target performance on the training data. Learning is performed in multiple epochs. After each epoch the error is validated on the validation data set. Once this error starts to increase, the learning process stop at this point.
Deep Neural Networks
Neural networks are systems inspired by parallel distributed processing in the brain (Zurada, 1992). They help to group unlabelled data according to similarities among the example inputs, and they classify data when they are trained on a labelled data set. A Deep Neural Network (DNN) is the name used for ‘stacked neural networks’; that is, networks composed of several layers.
25
One of the most widely-used types of deep network is the deep Convolutional Neural Network (CNN). This network uses a special architecture that is particul- arly well-adapted to classifying images (Ciresan, Meier and Schmidhuber, 2012). It consists of a succession of convolutional and max pooling layers, which are general, hierarchical feature extractors that map raw pixel intensities of the input image into a feature vector. Several subsequent fully connected layers classify these features.
Each convolutional layer performs a 2D convolution of its M n−1input maps with a filter of size Kx n x Ky n. The resulting activations of the Mn output maps are
given by the sum of the Mn−1 convolutional responses, which are passed through a nonlinearactivation function. Thus, in the convolutional step of the CNN, the input image is convolved with filter to obtain the convolutional response map.
Max-pooling layer creates slight position invariance over larger local regions and down-samples the input image. The output of a max-pooling layer is given by the maximum activation over non-overlapping rectangular regions of size Kx
x Ky. This represent a reduction in dimensionality of the convolutional responses
and confer a small degree of translational invariance into the model.
Kernel sizes of convolutional filters and max-pooling rectangles are chosen such that either the output maps of the last convolutional layer are down-sampled to 1 pixel per map, or a fully connected layer combines the outputs of the last convolutional layer into a 1D feature vector. The last layer is always a fully connected layer with one output unit per class in the recognition task.
With the aid of GPU-based computers, CNN has won many image recognition competitions (Schmidhuber, 2015). In addition, CNN reported impressive
26
results in recognising handwritten digits (Ciresan, Meier and Schmidhuber, 2012).
Segmentation
Segmentation is the process of extracting individual objects from a given image. It is a crucial step in further image analysis and object recognition. Segmentation used for text-based images aims at retrieving written characters from the entire image (Lu and Shridhar, 1996; Mehul et al., 2014). Unlike printed documents, segmentation of unconstrained handwritten documents has remained a key problem in character recognition (Stafylakis et al., 2008; Papavassiliou et al., 2010; Dave, 2015). Since the main objects in CDT sketches are handwritten digits, the focus in this section is on handwriting segmentation.
Handwriting segmentation can be generally classified as segmentation-recognition and segmentation-recognition-based (Casey and Lecolinet, 1996). In the former, segmentation is performed separately before recognition, and the result of the segmentation is the isolated characters. In the latter, segmentation and recognition happen simultaneously. This method produces good results, but is computationally expensive (Kokkinos and Maragos, 2009).
Segmentation can be done both offline and online (Plamondon, Srihari and S., 2000). In the offline approach, the completed writing is available as an image, and segmentation algorithms analyse the image’s spatial characteristics. In the online case, the two-dimensional coordinates of the writing are stored in the order of strokes made by the writer as a function of time, so both the temporal and spatial information is available for the segmentation.
27
Recently, several state-of-the-art segmentation methods have been tested on a common database used by (Liu et al., 2003; Ribas et al., 2013; Stamatopoulos et al., 2013). Eleven offline algorithms were evaluated and some of them showed high segmentation accuracy. Most of the algorithms use statistical information on spacing, together with horizontal and vertical projection, in order to segment the written document. These methods can work well with normal images, but would fail when applied to drawings of clocks. In clock drawings, the writing does not proceed from one side to another, but changes direction— especially when the drawings are made by people with cognitive impairment. Figure 2-2 shows examples of clock images that produce segmentation challenges using a traditional segmentation method.
Figure 2-2: Examples of segmentation challenges in CDT sketches.
Most sketch recognition systems override the segmentation step by employing stroke-based recognition. The sketch is recorded online as a set of strokes that are identified as a set of points from the pen on paper until lifting it. These
28
strokes are recognised as lines, curves or other basic subcomponents of diagrams (Alvarado and Davis, 2005). This kind of segmentation was developed to work with shapes rather than handwriting (Alvarado, 2011). Other sketch recognition systems place restrictions on the user’s writing style in order to make recognition easier and to eliminate the segmentation problem. For example, users must press a recognition button after each symbol or pause notably between symbols (Cohen et al., 1997; Hse and Newton, 2005). These approaches are inapplicable for CDT sketch segmentation, because the test needs to be unrestricted.
In CDT, sketch segmentation systems (Kim, 2013) used a connected component algorithm to segment the clock elements. The connected component algorithm (Gonzalez, Woods and Eddins, 2004) has been widely used in image segmentation. It segments binary images by detecting connected components between pixels. This method has some limitations in the segmentation of clock drawings. For example, when elements are connected, as in the first clock in Figure 2-2 where the number 3 is connected to the clock hand, it will lead to an under-segmentation error (Cardoso and Corte-Real, 2005) (i.e., when the segmented object contains more than one character). In the case when a number consists of two fragments (as the number 5 in the second clock in Figure 2-2), it will lead to an over-segmentation error (when the segmented object is not a complete character). In (Shi et al., 1997), one proposed solution to the problem of fragmented characters uses vertical blurring of the original images before segmentation. However, this solution is limited to short gaps (no more than two pixels), which is impractical in clock drawings, where subjects may leave a large gap between a character’s parts.
29
In the recent Think project (Davis et al., 2014), the clock drawings were segmented by first separating the clock hands based on their position near the centre of the clock. Then the k-means algorithm was applied to cluster the remaining elements into 12 groups using the time when they were drawn and the distance from the centre. This proposed method works well with clock drawings produced by people with no cognitive impairment. However, as reported by the authors, in drawings by impaired people, assistance was required to achieve accurate segmentation results.
The supervised classification algorithms such as SVMs have been used successfully in segmentation. In (Sun et al., 2004), an SVM with a set of geometrical features was used to classify inter- and intra-word gaps in the segmentation of handwritten text. An SVM was also used to successfully segment the online overlaid handwriting (Lv et al., 2013). High segmentation accuracy has been reported in online Japanese handwriting segmentation in (Furukawa et al., 2006; Bilan and Masaki, 2008) using a set of spatial and temporal stroke-based features. However, these systems are specifically designed for handwritten document segmentation and the employed features are specified for this handwriting style. Developing new spatio-temporal-based segmentation for CDT sketches would be valuable.
Handwriting Recognition
Handwriting recognition systems can be divided into two categories: online and offline. In an online system, a sequence of time-stamped coordinates representing the movement of the pen tip is transformed into meaningful text. By contrast, in an offline recognition system, only the scanned image of the text
30
is available (Plamondon, Srihari and S., 2000). Over the last few decades, a large number of algorithms have been proposed in both categories; for a detailed review the reader is referred to the broader survey in (Plamondon, Srihari and S., 2000; Arica and Yarman-vural, 2001; Tanaka, Iwayama and Akiyama, 2004).
Recently, CNNs (LeCun et al., 1998) showed state-of-the-art performance in various domains such as speech recognition and visual object detection and recognition (Schmidhuber, 2015). They consist of multiple alternating convolu-tional and pooling layers. Their structure of successive alternating layers is designed to learn progressively higher-level features, where the last layer produces the classification results. CNNs were applied to recognise offline-handwritten digits with an error of just 0.23%, as reported on the MNIST database of handwritten digits (Ciresan, Meier and Schmidhuber, 2012). This is comparable to human performance.
With the recent development of smartphones and digital tablets, interest in online handwriting recognition has increased. Several new algorithms have been proposed (Namboodiri and Jain, 2004; Castro-Bleda et al., 2009; Deborah, Elijah and Olaosebikan, 2012; Tagougui, Kherallah and Alimi, 2013; Keysers et al., 2017), with good results reported. Most of these algorithms use a set of features such as the normalised first and second derivatives of the x,y coordinates, the distance and angles between pairs of points, the curvature, the start and end point positions and whether the pen is on and off (if there are multiple strokes). These features could be called ‘dynamic’ since they are derived from the process of writing. Online recognition methods have been shown to be more robust than offline algorithms against variations in input
31
shape. A significant recognition accuracy of 99.4%. was reported in (Castro-Bleda et al., 2009) for online handwritten digit recognition. The kNN classifier that uses approximate Dynamic Time Warping (DTW) (Berndt and Clifford, 1994) with a histogram of directional features is employed. However DTW is a computationally expensive process. More recently, kNN and backpropagation also employed in Lipi toolkit (Zunjarrao, 2017),an online character recognition engine, yet the reported result was only 90%.
So far, research efforts have focused on getting the best recognition accuracy with any one of the approaches listed above (static images, offline and online). Relatively little effort has been spent to explore how various recognition methods can be used as individual sources of information and combined to boost the recognition accuracy. Specifically, how can online recognition methods be combined with offline recognition methods.
Combining multiple classifier systems is an approach proposed in (Liwicki and Bunke, 2007), where a system based on hidden Markov models was used with digit representations. The result was derived using a voting strategy. The results showed a 2% improvement over the best individual recogniser. Other methods (Alimoglu and Alpaydin, 2001) achieved an improvement of 1.2% by combining the results of two multi-layer perceptron (MLP) classifiers, one trained on dynamic x,y coordinates and the other on the static images of digits.
In the area of computerised CDT research, several approaches to digit recognition have been employed. The first was by (Cho, Kim and Do, 2010), in which the system recognises the unique shape of each number by comparing the curved and straight lines and the writing sequences of strokes. The system has been tested on 20 clocks drawn by healthy participants and achieved
32
97.67% recognition accuracy. Although good accuracy was achieved, the developed system was only tested on a small number of healthy people. With bad handwriting resulting from cognitive impairment, the patient does not follow the standardised digit writing form of curves and straight lines.
The second approach (Davis et al., 2014; Souillard-mandar et al., 2016) adapted a symbol recognition algorithm originally developed by Ouyang (Ouyang and Davis, 2009) for electrical circuit diagrams. It uses k-nearest neighbour as a classifier with five feature images. Four of the feature images describe the stroke from the horizontal, vertical and diagonal point of view while the fifth represents the stroke endpoint. The reported result was over 96% recognition accuracy after the algorithm was trained and tested on clocks from healthy individuals. More recently, probabilistic Conditional Random Field (CRF)(Lafferty, McCallum and Pereira, 2001) has been used for classifying clock numbers (Song et al., 2016). In addition to the numbers’ visual shapes, features related to context information are included, including their position within the clock and the preceding and succeeding numbers’ visual shapes. Using this contextual information, the classifier accuracy improved from 88.96% to 99.3%. However, there was no indication of classifier performance in cases when the numbers were not in their expected position nor in sequence with the previous and next numbers. Such cases would affect the classification results. More than fifty percent of the dementia data set involved in the current study are neither in their correct position nor in their expected sequence.
Convolutional neural networks achieved promising results in offline handwriting (LeCun et al., 1998), but their application is limited due to the huge amount of data required for training to avoid overfitting (Srivastava et al., 2014).
33
Nonetheless, their performance can be improved by using them in combination with other classifiers, which are not highly dependent on the size of the training data set. An example of such a classifier is kNN. In addition, the classification features employed with CNNs are static, such as the image of the digit. Dynamic features that describe the sequence of writing would be useful when the digits are visually unclear. This combination will contain information about ‘what’ and ‘how’, which both support the recognition process.
Knowledge Representation and Ontology
Knowledge representation as a branch of AI relates to the formalisation of knowledge and its processing within machines (Grimm, Hitzler and Abecker, 2007). Knowledge represented in a machine-interpretable form enables computer systems to make decisions based on reasoning about particular domains, similar to humans. Knowledge representation has been extensively used in image interpretation (Monique, 2002).
Ontology is a popular knowledge representation technology in information science. Ontologies have become popular as computational artefacts capable of providing systems with a conceptual model of a particular domain of interest. Ontologies encode a partial view of the world, with respect to a given domain, by defining a set of concepts and their relational structure, which can be used to describe and reason about a domain. Their robustness as valid contexts of knowledge representation have been proven by many researchers (Gu et al., 2004; Grimm, Hitzler and Abecker, 2007).
Ontological modelling of domain knowledge has been applied in many real-world applications, such as medicine (Luciano et al., 2011) and decision making
34
(Kornyshova and Rebecca, 2010; Bastinos and Krisper, 2013). It has also been widely used in image interpretation (Durand et al., 2007; Hudelot, Atif and Bloch, 2008; Bannour and Hudelo