THE INTEGRATION OF FUNCTION ANALYSIS AND VIRTUAL REALITY SIMULATION
Richard L. Johnson, PE, CVS, John Dovel, Del Younker, CVS, Chuck Hixon, Craig Miller, PE PMA Consultants LLC
4901 Vineland Road, Suite 330 Orlando, Florida 32811, USA 407/351-7016
BIOGRAPHY
Richard L. Johnson, PE, CVS is a Principal with PMA Consultants LLC, an international program/project management firm. Mr. Johnson is a Professional Engineer registered in Florida, North Carolina and South Carolina, a Certified Value Specialist, and a Diplomate with the American Academy of Environmental Engineers. He serves as the Owner’s Authorized Representative for the Orlando International Airport and Orange County Utilities. He manages Value Engineering Contracts with the Florida Department of Transportation Statewide and is the Value Engineering consultant for the National Park Service under the Continuing Engineering Consultant contract held by PBS&J, Inc.
He has an extensive and diverse background in civil and environmental engineering that includes roadway paving and drainage, airport airside improvements, airport terminal vertical construction, and National and community parks.
John Dovel is the District 6 Value Engineering Coordinator for Florida Department of Transportation, Del Younker is the sole proprietor of Value Consulting, Chuck Hixon is the Creative Director with Bergmann Associates and Craig Miller is President of Miller Consulting, Inc.
ABSTRACT
The Florida Department of Transportation owns eight acres of property in the area known as the Golden Glades Interchange. There is a planned Golden Glades Multimodal Transportation Facility that is the in the middle of several major transportation alternatives. It is the southern terminus for Florida’s Turnpike, Interstate 95 transects the property, as does the Palmetto Expressway (SR 826), State Road 9, US 441, CSX Railroad and there is a Park & Ride Terminal for buses that use a High Occupancy Vehicle lane on I-95 to downtown Miami. The Railroad is a Miami-Dade Transit planned corridor for Metrorail extensions.
This paper will present how FDOT first used function analysis to define the major components and then used Virtual Reality Visualization/Simulation to visually show the site using GIS information with aerial photography and areas where each function could be addressed. The presentation will demonstrate the virtual simulation process to show how project stakeholders are able to see what the site would look like in three-dimensional perspective with finished improvements on the site.
INTRODUCTION
The proposed Golden Glades Multimodal Transportation Facility is located in the southeast
quadrant of the Golden Glades Interchange (Figure 1) where State Road (SR) 826, Interstate (I)-95, SR 9, Florida’s Turnpike and the South Florida Rail Transit Authority’s commuter rail converge near North Miami Beach, Florida. The intent of the project is to move people and goods more expediently through the region at the Golden Glades Multimodal Center.
The Florida Department of Transportation (FDOT) assembled a Value Engineering (VE) team to investigate the best use and configuration for the facility. The team was tasked to perform a function analysis and prepare a Function Analysis System Technique FAST Diagram that incorporated virtual reality visualization simulation to convey the project functions and help the area stakeholders visualize what the proposed project will look like in relation to various project functions and features.
The VE team consisted of the FDOT District 6 VE Coordinator, PMA Consultants LLC, Miller Consulting, Inc., Bergmann Associates, and the major
stakeholders’ representatives from Miami-Dade County, North Miami Beach, Congressman Kendrick Meek’s office, South Florida Rail Transit Authority, Miami Transit Authority and potential developers. The VE team followed the SAVE International and FDOT
recommended Value Engineering Job Plan in conducting the team’s work for two separate work sessions. The team gathered and reviewed information on the current FDOT District 6 (D6) current conceptual plans for the Golden Glades Center.
The VE team began by discussing some creative ideas and concepts on the first day of Workshop No. 1 and introduced the ideas and a virtual reality simulation model of the concept locations during a discussion with the FDOT Statewide District Value Engineers. During this workshop the FAST Diagram was developed and presented with a preliminary version of the simulation model
consisting of the three-dimensional model. The presentation showed how the model can be
manipulated to show what the aerial view of the interchange will look like from a “one-half sphere” perspective.
Feedback from that presentation was incorporated into the facilitators’ presentation for Workshop No. 2, as an information-sharing meeting with major stakeholders in the area. During the February stakeholders’ meeting the team and stakeholder panel identified several ideas that should be investigated further. An alternate location for the Rail Terminal was also considered in the northeast quadrant of the interchange in a private yard adjacent to FDOT owned property, see
Figure 2. The FDOT D6 plans to use the ideas generated during these sessions to optimize the Golden Glades Multimodal Facility and use the simulation model to demonstrate potential planned improvements to management and area stakeholders.
The workshop process that brought
participants to the site and the demonstration of the project visual simulation model was well received by the members of the workshops, because the three dimensional model allowed the group members to see what the proposed improvements would look like and visualize ingress and egress for the site. The flyover and fly-through
features of the model were extremely useful to see features from the ground as well as overhead. In one instance the model
demonstrated what ingress to the site would be like in virtual reality if a road were constructed under an existing overpass for a railroad spur.
WORK PRODUCT
This planning level Value Engineering work assignment consisted of the two workshops previously mentioned. A draft report was prepared following the initial conceptual ideas workshop in October 2003. The virtual reality simulation model database was populated with GIS data and overlaid on aerial photography for the study area.
This innovative approach to combine value engineering with virtual reality modeling was the
brainchild of John Dovel, who is the FDOT District 6 VE Coordinator. John reasoned that this was a high-profile project with many agencies, governments and businesses that will be affected, so the best way to arrive at early conceptual consensus was to identify the project functions and visually present them to the decision-makers or their representatives. He laid out a program where the VE Team conducted the two-phased study with a draft report for presentation to the stakeholders with a final report for participating members. A presentation meeting and workshop was conducted in February 2004 and results and findings of that meeting were captured in a Final Report.
Draft Report
Based on the findings obtained during Workshop No. 1 the team prepared a draft report of options and prepared for a presentation to the Golden Glades project stakeholder members. The major functions to be discussed at Workshop No. 2 in District 6 were identified and a FAST Diagram was prepared with associated links to various options/alternatives for improvements to the interchange and multimodal center.
Presentation Meeting with Golden Glades Stakeholders Team
A one-day presentation made to the Golden Glades stakeholders team confirmed and solidified the functions and how to improve them in ways that will be beneficial and acceptable to the
communities, FDOT, and the general public. The presentation consisted of a draft report of ideas and concepts to consider for the project and several PowerPoint presentations by the design team to orient the stakeholders and then the VE team’s presentation of VE methodology and how the ideas in the draft report were derived and some options for them to consider. The stakeholders provided their input of issues and concerns to be considered to improve the Golden Glades Multimodal Facility site and how to accommodate transportation agencies and potential development partners.
Final Report
After the February 11, 2004 workshop with the Golden Glades Multimodal Facility stakeholders, a report was prepared describing the findings of the one-day study. The report prepared under this assignment will be used for future VE and design study teams for Golden Glades Interchange projects.
FUNCTION ANALYSIS AND VISUAL SIMULATION
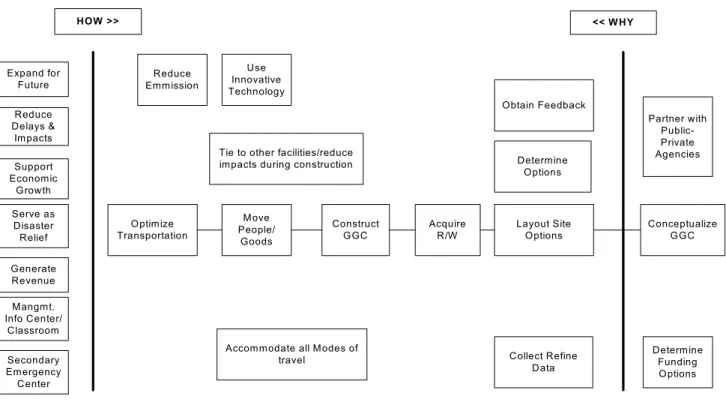
A FAST Diagram was developed to define the requirements for the overall Golden Glades Multimodal Facility and regional transportation system and to ensure that the Study Team had a complete and thorough understanding of the functions (basic and others) needed to satisfy the facility’s requirements. The development of a FAST diagram helped to stimulate team members to think in terms of required functions, not just normal solutions and to enhance their creative idea development. The project’s primary tasks, the critical path functions, the project’s primary basic functions and other required functions that must be satisfied were shown in Figure 3, on the following page.
Figure 3 – FAST Diagram
Golden Glades Multimodal Transportation Facility
<< WHY HOW >> Layout Site Options Collect Refine Data Determine Options Acquire R/W Construct GGC Move People/ Goods Optimize Transportation Support Economic Growth Conceptualize GGC Reduce Delays & Impacts Serve as Disaster Relief Determine Funding Options Partner with Public-Private Agencies Generate Revenue Expand for
Future EmmissionReduce
Use Innovative Technology
Obtain Feedback
Accommodate all Modes of travel
Tie to other facilities/reduce impacts during construction
Mangmt. Info Center/ Classroom Secondary Emergency Center
The FAST Diagram was linked to the visual simulation virtual reality model so that if we click on a function on the FAST Diagram the software toggles to featured potential improvements within the Golden Glades Interchange. For example, if we click on the function “Aquire Right of Way” the onscreen view converts to the aerial view of the entire interchange area and shows parcels adjacent and in proximity to the Golden Glades Interchange. Within this view one can also activate a keystroke that will also show DOT owned property.
If we click on the function “Construct Golden Glades Center” the onscreen view converts to the 3-dimensional aerial view and one can view either or both potential sites for the Rail/Bus Terminal. The model allows one to navigate a virtual tour of the exterior and the interior of the Terminal, the bus parking area, stairs and crosswalk over the railway to the train loading dock north of SR 9. In summary, the model can be built to any level of detail (i.e., building finishes, interior piping, landscaping, etc.) necessary to demonstrate and display features important to decisionmakers to help them make an informed and educated determination.
CONCLUSION
The FDOT assembled a VE team to investigate the best use and configuration for the Golden Glades Mulitmodal Facility. The team performed a function analysis and prepared a FAST
Diagram that incorporated a virtual reality visualization simulation model. The model conveyed the project functions and helped the area stakeholders visualize what the proposed project would look like in relation to various project functions, features and alternate locations for improvement infrastructure, structures, and buildings.
The FAST Diagram was linked to the visual simulation virtual reality model and presented to local government representatives, transportation agencies and potential development partners. An after-meeting questionnaire was distributed to obtain feedback regarding the VE process and the Function Analysis/Virtual Reality model. The purpose of the questionnaire was to determine if the
stakeholders found the process helpful. The overwhelming response was satisfaction with the process and they were very impressed and appreciative of the prerspective provided by the model.