Evaluating intertwined effects in e-learning programs: A novel hybrid
MCDM model based on factor analysis and DEMATEL
Gwo-Hshiung Tzeng
a,c, Cheng-Hsin Chiang
b, Chung-Wei Li
a,*aInstitute of Management of Technology, National Chiao Tung University, Hsinchu, Taiwan bApplications and Services Division, National Taiwan University, Taipei, Taiwan
c
College of Management, Kainan University, Taoyuan, Taiwan
Abstract
Internet evolution has affected all industrial and commercial activity and accelerated e-learning growth. Due to cost, time, or flexi-bility for designer courses and learners, e-learning has been adopted by corporations as an alternative training method. E-learning effec-tiveness evaluation is vital, and evaluation criteria are diverse. A large effort has been made regarding e-learning effeceffec-tiveness evaluation; however, a generalized quantitative evaluation model, which considers both the interaffected relation between criteria and the fuzziness of subjective perception concurrently, is lacking. In this paper, the proposed new novel hybrid MCDM model addresses the independent relations of evaluation criteria with the aid of factor analysis and the dependent relations of evaluation criteria with the aid of DEM-ATEL. The AHP and the fuzzy integral methods are used for synthetic utility in accordance with subjective perception environment. Empirical experimental results show the proposed model is capable of producing effective evaluation of e-learning programs with ade-quate criteria that fit with respondent’s perception patterns, especially when the evaluation criteria are numerous and intertwined. 2006 Elsevier Ltd. All rights reserved.
Keywords: E-learning; Factor analysis; Fuzzy integral; DEMATEL; Multiple criteria decision making (MCDM)
1. Introduction
Internet has significantly impacted the establishment of Internet-based education, or e-learning. Internet technol-ogy evolution and e-business has affected all industrial and commercial activity and accelerated e-learning indus-try growth. It has also fostered the collaboration of educa-tion and Internet technology by increasing the volume and speed of information transfer and simplifying knowledge management and exchange tasks. E-learning could become an alternative way to deliver on-the-job training for many companies, saving money, employee transportation time, and other expenditures. An e-learning platform is an emerging tool for corporate training, with many companies
developing their own e-learning courses for employee on-the-job training. Employees can acquire competences and problem solving abilities via Internet learning for benefits among business enterprises, employees, and societies while at work.
Although e-learning has been developing for several years, evaluating e-learning effectiveness is critical as to whether companies will adopt e-learning systems. A con-siderable number of studies have been conducted empha-sizing the factors to be considered for effectiveness evaluation. Several evaluation models are considered with specific aspects. The criteria used for e-learning effective-ness evaluation are numerous and influence one another.
The evaluation models however, are deficient and do not have an evaluation guideline. Effectiveness evaluation crite-ria must integrate learning theories, relative website design, course design, and learning satisfaction theories to form an integrated evaluation model (Allen, Russell, Pottet, & Dobbins, 1999; Hall & Nania, 1997; Hsieh, 2004). Since
0957-4174/$ - see front matter 2006 Elsevier Ltd. All rights reserved. doi:10.1016/j.eswa.2006.02.004
*
Corresponding author. Address: 7th Floor, Assembly Building 1, 1001 Ta-Hsueh Road, Hsinchu, Taiwan. Tel.: +886 3 5712121x57505; fax: +886 3 5753926.
E-mail address:[email protected](C.-W. Li).
www.elsevier.com/locate/eswa Expert Systems with Applications 32 (2007) 1028–1044
sidered for e-learning effectiveness, this paper used several methods to establish the evaluation model. Factor analysis figures the main aspects of e-learning evaluation and gener-ates independent factors/aspects for further evaluation using the AHP method. Criteria interrelations, and compo-nents of independent factors are usually intertwined and interaffected. Applying the DEMATEL (Decision Making Trial and Evaluation Laboratory) method (Fontela & Gabus, 1974, 1976; Warfield, 1976) illustrates the interrela-tions among criteria, finds the central criteria to represent the effectiveness of factors/aspects, and avoids the ‘‘overfit-ting’’ for evaluation. Thus, non-additive methods, fuzzy measure, and fuzzy integral, are used to calculate the dependent criteria weights and the satisfaction value of each factor/aspect for fitting with the patterns of human perception. Finally, the analytic hierarchy process (AHP) method is employed to find out the weights of factors/ aspects and obtain each e-learning program score.
The empirical experiments of this paper are demon-strated with two e-learning company-training programs. The proposed model could be used to evaluate effectiveness by considering the fuzziness of subjective perception, find-ing the central criteria for evaluatfind-ing, illustratfind-ing criteria interrelations, and finding elements to improve the effec-tiveness of e-learning programs. Moreover, the results show that the effectiveness calculated by the proposed model is consistent with that from traditional additive methods.
The remainder of this paper is organized as follows. E-learning concepts, including definitions, categories, char-acteristics, evaluation criteria, and evaluation effectiveness models, are described in Section 2. In Section 3, a brief introduction of factor analysis, the DEMATEL method, fuzzy measure, fuzzy integral, and AHP method is given. Establishing a model using these methods is also proposed. In Section 4, empirical experiments of two real e-learning cases (Masterlink Securities Corporation training pro-grams) are shown using the proposed evaluation model. The analysis result is discussed and compared with the tra-ditional additive evaluation model in Section5. Section6
concludes the paper.
2. Environments and the effectiveness evaluation models of e-learning
E-learning combines education functions into electronic form and provides instruction courses via information technology and Internet in e-Era. The most popular defini-tion of e-learning as defined by the American Society for Training and Development (ASTD) is a wide set of
appli-and learn as much, if not more, than in traditional courses. E-learning is currently a burgeoning educational and training tool because of its cost saving advantages, institu-tion reusability, and learner flexibility. World governments emphasize e-learning for social and public education, and want to enlarge it as a branch of education. The European Union in 2000, proposed the eEurope project, promoting an information society for all (Europa, 2004). Moreover, the Japanese government has proposed the eJapan project, making e-learning one of seven main application develop-ment items. E-learning has also been used with university and enterprise education. Enterprises can introduce e-learning courses and systems into the firm, which can then be used by the human resources or research develop-ment departdevelop-ment to do on-the-job training. When compa-nies induce e-learning courses into their organization, they can save money otherwise used for guest lecturers, and employees can learn on demand.
Each e-learning procedure, from course design to lear-ner response or behavior measurement, will affect course performance. According to previous research, instructional system design process models are process-oriented rather than product-oriented and include built-in evaluation and revision systems (Hannum & Hansen, 1989). Systematic instructional system designs follow five learner need stages: (1) analysis, (2) design, (3) development, (4) implementa-tion, and (5) evaluaimplementa-tion, or the ADDIE acronym model (Hegstad & Wentlign, 2004). The ADDIE is usually used in mentoring as an intervention that can be linked to three primary functions: (1) organization, (2) training and devel-opment, and (3) career development (Mhod, Rina, & Sur-aya, 2004).
The basic reason for e-learning evaluation is to find out the effectiveness, efficiency, or appropriateness of a partic-ular course of action. E-learning effectiveness evaluation intends to highlight good or bad practice, detect error and correct mistakes, assess risk, enable optimum invest-ment to be achieved, and allow individuals and organiza-tions to learn (Roffe, 2002). Evaluation can be most effective when it informs future decisions (Geis & Smith, 1992) and is better used to understand events and processes for future actions, whereas accountability looks back and properly assigns praise or blame.
Over the past few years, considerable studies have been undertaken primarily to find the dimensions or factors to be considered in evaluation effectiveness, however, with a specific perspective. Kirkpatrick proposed four levels of training evaluation criteria: (1) reactions, (2) learning, (3) behavior, and (4) results (Kirkpatrick, 1959a, 1959b, 1960a, 1960b).Garavaglia (1993)proposed five dimensions
to evaluate e-learner change: (1) supervisory report, (2) on-the-job peer surveys, (3) action plan reports, (4) observa-tion, and (5) self-report. Among these five methods, the observation method can avoid the possible bias a supervi-sor may have when reporting on a subordinate. The self-report method involves either interviews or surveys dis-tributed or conducted two to three months after the learn-ing session. Philips (1996) formed a logical framework to view ROI (return on investment) both from a human per-formance and business perper-formance perspective. Urdan (2000) proposed four measure indicators, learner focused measures, performance focused measures, culture focused measures, and cost-return measures, to evaluate corporate e-learning effectiveness. Since web-based instruction has become the most engaging type for learning, four factors that affect the e-learning environment should also be iden-tified: (1) efficacy studies, (2) technological advances, (3) pressures of competition and cost containment, and (4) professional responses to market influences (Miller & Miller, 2000).
Formative evaluation and summative evaluation are two common methods for evaluating e-learning course effectiveness in recent decades. Formative evaluation is used at the onset of new instructional program implemen-tation to assess the needs and learning goals of an organi-zation, or for program evaluation following training to revise existing programs. Several familiar formative evalu-ation models prescribe a four-part evaluevalu-ation procedure employing expert reviews, one-to-one evaluations, small group evaluation, and field trials (Dick & Carey, 1996). Formative evaluation is typically categorized according to different processes such as design-based, expert-based, and learner-based for assessment, although.
Summative evaluation, one of the most popular meth-ods focused on outcomes and used in classroom education. For example, the CIRO (contents/contexts, inputs, reac-tions and outcomes) model which measures learning/train-ing effectiveness by CIRO elements, both before and after training, is currently widely used in business (Cooper, 1994). The strength of the CIRO model is consideration of objectives (contexts) and training equipment (inputs). The main emphasis of CIRO is measuring managerial training program effectiveness, but it does not indicate how measurement takes place. Adopting measures during training provides the training provider with important information regarding the current training situation, lead-ing to improvements (Charles, Mahithorn, & Paul, 2002). Summative evaluation models lack consideration of other factors, such as individual characteristics, e-learning inter-face design, instructional system design, and course design, which may influence e-learning effectiveness.
Most evaluation models however, do not measure e-learning effectiveness from an overall perspective and ignore the interrelation among criteria. Most evaluation models concentrate on finding factors, aspects, or casual relationships between them. Quantitative study models mainly use traditional statistic methods or linear models
(e.g. ANOVA, factor analysis and structural equation model) to find learner satisfaction or dissatisfaction via questionnaires or facial communications (Marks, Sibley, & Arbaugh, 2005; Moore, 1989; Muilenburg & Berge, 2005; Ng & Murphy, 2005; Sherry, Fulford, & Zhang, 1998). Typically, e-learning program effectiveness is evalu-ated by multiple intertwined and interaffected criteria, and the perceptions of utility for learners are not monotonic. Establishing a model to evaluate all available criteria and to determine central criteria, learner utility perception about these criteria, and the future improvement direction for the programs is necessary.
3. Evaluation structure model combined factor analysis and the DEMATEL method for determining the criteria weights
In this section, the concepts of establishing the evalua-tion structure model, combined factor analysis, and the DEMATEL method for determining the criteria weights, are introduced. In real evaluation problems, it is difficult to quantify a precise value in a complex evaluation system. However, the complex evaluation environment can be divided into many criteria or subsystems to more easily judge differences or measure scores of the divided criteria groups or subsystems. The factor analysis method is com-monly used to divide criteria into groups. Although it seems logical to sum the scores of these criteria for calculat-ing factor effectiveness, the weights between the criteria may differ and the criteria may have interdependent rela-tionships. Assuming that criteria weights are equal may distort the results. In the proposed model, DEMATEL, fuzzy measure, and fuzzy integral are used to overcome these problems. DEMATEL is used to construct the inter-relations between criteria, while fuzzy measure and fuzzy integral are used to calculate the weights and synthetic util-ity of the criteria. Factor weights can then be obtained via processing individual or group subjective perception by the AHP method. Then, the final effectiveness value can be obtained.
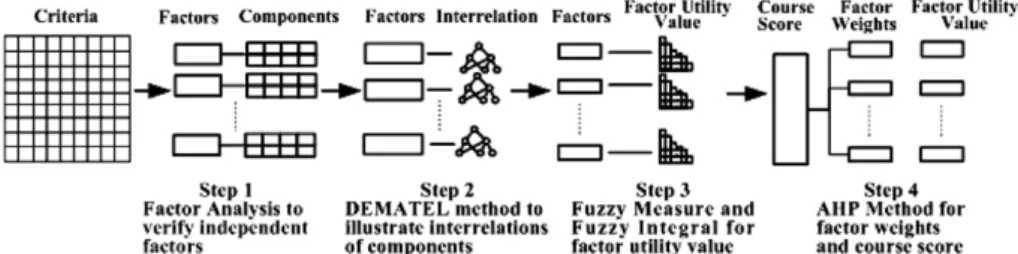
The hybrid MCDM model procedures are shown briefly inFig. 1. Factor analysis, the DEMATEL method, fuzzy measure, fuzzy integral, AHP method, and the goals for combining these methods to evaluate e-learning effective-ness will be explained as follows.
3.1. Finding independent factors for building a hierarchical system
Based on various points of view or the suitable measur-ing method, the criteria can be categorized into distinct aspects. In real program problem assessment based on a general problem statement, various opinions from partici-pants and the evaluation criteria will be setup. When the evaluation criteria in real complex problems are too large to determine the dependent or independent relation with others, using factor analysis can verify independent factors.
Another reason for using factor analysis in this paper is the conventional AHP method, which performs the final eval-uation in an additive type, based on the assumption of independence among criteria within the evaluating struc-ture systems.
Factor analysis is a dimension reduction method of multi-variate statistics, which explores the latent variables from manifest variables. Two methods for factor analysis are generally in use, principal component analysis, and the maximum likelihood method. The main procedure of principal component analysis can be described in the fol-lowing steps when applying factor analysis:
Step 1:Find the correlation matrix (R) or
variance–covari-ance matrix for the objects to be assessed.
Step 2:Find the eigenvalues (kk,k= 1, 2,. . .,m) and
eigen-vectors (bk= [b1k,. . .,bik,. . .,bpk]) for assessing the factor loading ðaik¼
ffiffiffiffiffi
kk
p
bikÞand the number of factors (m).
Step 3:Consider the eigenvalue ordering (k1> >kk>
>km;km> 1) to decide the number of common factors, and pick the number of common factors to be extracted by a predetermined criterion.
Step 4:According toKaiser (1958), use varimax criteria to
find the rotated factor loading matrix, which pro-vides additional insights for the rotation of fac-tor-axis.
Step 5:Name the factor referring to the combination of
manifest variables.
When a large set of variables are factored, the method first extracts the combinations of variables, explaining the greatest amount of variance, and then proceeds to combi-nations that account for progressively smaller amounts of variance. Two kinds of criteria are used for selecting the number of factors: latent root criterion and percentage of variance criterion. The former criterion is that any individ-ual factor should account for the variance (Var(Yk) =kk) of at least a single variable if it is to be retained for inter-pretation. In this criterion only the factors having eigen-values greater than 1 (i.e. kkP1, k= 1, 2,. . .,m) are considered significant. The latter criterion is based on achieving a specified cumulative percentage of total vari-ance extracted by successive factors. Its purpose is to ensure the extracted factors can explain at least a specified amount of variance. Practically, to be satisfactory the total
amount of variance explained by factors should be at least 95% in the natural sciences, and 60% in the social sciences. However, no absolute threshold has been adopted for all applications (Hair, Anderson, Tatham, & Black, 1998).
3.2. Clarifying the interrelation between criteria of a factor
In a totally interdependent system, all criteria of the sys-tems are mutually related, directly or indirectly; thus, any interference with one of the criteria affects all the others, so it is difficult to find priorities for action. The decision-maker who wants to obtain a specific objective/aspect is at a loss if the decision-maker wants to avoid disturbing the rest of the system while attaining the decision-maker’s objective/aspect. While the vision of a totally interdepen-dent system leads to passive positions, the vision of a clearer hierarchical structure leads to a linear activism which neglects feedback and may engineer many new prob-lems in the process of solving the others.
The DEMATEL method, developed by the Science and Human Affairs Program of the Battelle Memorial Institute of Geneva between 1972 and 1976, was used for research-ing and solvresearch-ing the complicated and intertwined problem group. DEMATEL was developed in the belief that pio-neering and appropriate use of scientific research methods could improve understanding of the specificproblematique, the cluster of intertwined problems, and contribute to iden-tification of workable solutions by a hierarchical structure. The methodology, according to the concrete characteristics of objective affairs, can confirm the interdependence among the variables/attributes and restrict the relation that reflects the characteristic with an essential system and development trend (Chiu, Chen, Tzeng, & Shyu, 2006; Hori & Shimizu, 1999; Tamura, Nagata, & Akazawa, 2002). The end prod-uct of the DEMATEL process is a visual representation— an individual map of the mind—by which the respondent organizes his or her own action in the world.
The purpose of the DEMATEL enquiry in this paper is the analysis components structure of each factor, the direc-tion and intensity of direct and indirect reladirec-tionships that flow between apparently well-defined components. Experts’ knowledge is checked and analyzed to contribute to a greater understanding of the component elements and the way they interrelate. The result of DEMATEL analysis can illustrate the interrelations structure of components
and can find the central components of the problem to avoid the ‘‘overfitting’’ for decision-making.
The steps of the DEMATEL method are described as follows:
Step 1: Calculate the average matrix. Respondents were
asked to indicate the direct influence that they believe each element exerts on each of the others according to an integer scale ranging from 0 to 4. A higher score from a respondent indicates a belief that insufficient involvement in the prob-lem of eprob-lement iexerts a stronger possible direct influence on the inability of element j, or, in positive terms, that greater improvement iniis required to improvej.
From any group of direct matrices of respondents it is possible to derive an average matrix A. Each element of this average matrix will be in this case the mean of the same elements in the different direct matrices of the respondents.
Step 2: Calculate the initial direct influence matrix. The
initial direct influence matrixDcan be obtained by normal-izing the average matrixA, in which all principal diagonal elements are equal to zero. Based on matrix D, the initial influence which an element exerts and receives from another is shown.
The element of matrixDportrays a contextual relation-ship among the elements of the system and can be converted into a visible structural model—an
impact-digraph-map—of the system with respect to that
relation-ship. For example, as shown in Fig. 2, the respondents are asked to indicate only direct links. In the directed digraph graph represented here, element i directly affects only elements j and k; indirectly, it also affects first l, m
and n and, secondly, o and q. The digraph map helps to understand the structure of elements.
Step 3: Derive the full direct/indirect influence matrix. A
continuous decrease of the indirect effects of problems along the powers of the matrix D, e.g. D2,D3,. . .,D1, and therefore guarantees convergent solutions to matrix inversion. In a configuration like Fig. 2, the influence exerted by elemention elementqwill be smaller than influ-ence that elementiexerts on elementm, and again smaller than the influence exerted on elementj. This being so, the infinite series of direct and indirect effects can be illustrated. Let the (i,j) element of matrix A is denoted by aij, the matrix can be gained following Eqs. (1)–(4).
D¼sA; s>0 ð1Þ or
dij¼saij; s>0;i;j2 f1;2;. . .;ng ð2Þ
0<s<sup; sup¼Min 1 max16i6n Pn j¼1jaijj ; 1 max16j6n Pn i¼1jaijj ! ð3Þ and lim m!1D m¼ ½ 0; whereD¼ ½dijnn; 06dij<1 ð4Þ
The full direct/indirect influence matrix F—the infinite series of direct and indirect effects of each element—can be obtained by the matrix operation of D. The matrix F
can show the final structure of elements after the continu-ous process (see Eq.(5)). LetWi(f) denote the normalized ith row sum of matrixF; thus, the Wi(f) value means the sum of influence dispatching from element i to the other elements both directly and indirectly. The Vi(f), the nor-malizedith column sum of matrix F, means that the sum of influence that elementireceives from the other elements.
F¼X
1
i¼1
Di¼DðIDÞ1 ð5Þ
Step 4: Set threshold value and obtain the impact-digraph-map. Setting a threshold value,p, to filter the obvious effects denoted by the elements of matrixF, is necessary to explain the structure of the elements. Based on the matrixF, each element, fij, of matrix F provides information about how elementiinfluences to elementj. If all the information from matrixFconverts to the impact-digraph-map, the map will be too complex to show the necessary information for deci-sion-making. To obtain an appropriate impact-digraph-map, decision-maker must set a threshold value for the influence level. Only some elements, whose influence level in matrixFhigher than the threshold value, can be chose and converted into the impact-digraph-map.
The threshold value is decided by the decision-maker or, in this paper, by experts through discussion. Like matrixD, contextual relationships among the elements of matrixFcan also be converted into a digraph map. If the threshold value is too low, the map will be too complex to show the necessary information for decision-making. If the threshold value is too high, many elements will be presented as independent elements without showing the relationships with other ments. Each time the threshold value increases, some ele-ments or relationships will be removed from the map.
After threshold value and relative impact-digraph-map are decided, the final influence result can be shown. For example, the impact-digraph-map of a factor is the same asFig. 2 and eight elements exist in this map. Because of continuous direct/indirect effects between the eight ele-ments, the effectiveness of these eight elements can be repre-sented by two independentfinal affected elements:oandq. The other elements not shown in the impact-digraph-map of a factor can be considered as independent elements because no obvious interrelation with others exists.
3.3. Determining the criteria weights and utility value of factors
The reason for applying fuzzy measure and fuzzy inte-gral is based on the assumption that the synthetic effects of human perception exist between dependent criteria (shown as Fig. 3). Traditionally, researchers use additive techniques to evaluate the utilities of each criterion to meet the assumption of independent relationship among consid-ered criteria. In the proposed model, the non-additive methods, or the sum between the measure of a set and the measure of its complement is not equal to the measure of space, are used to evaluate e-learning program effective-ness. Unlike the traditional definition of a measure based on the additive property, the non-additive MCDM meth-ods, fuzzy measure and fuzzy integral, have been applied to evaluate the dependent multi-criteria problem.
The fuzzy measure was used to determine weights of dependent criteria from subjective judgment and the fuzzy integral was used to evaluate the effectiveness of the final affected elements in an e-learning program. Since Zadeh put forward the fuzzy set theory (Zadeh, 1965), and Bell-man and Zadeh described the decision-making methods in fuzzy environments (Bellman & Zadeh, 1970), an increasing number of studies have dealt with uncertain fuzzy problems by applying fuzzy measure and fuzzy inte-gral (Chiou & Tzeng, 2002; Chiou, Tzeng, & Cheng, 2005; Shee, Tzeng, & Tang, 2003; Tzeng, Yang, Lin, & Chen, 2005).
The concept of fuzzy measure and fuzzy integral was introduced by Sugeno. Fuzzy measure is a measure for rep-resenting the membership degree of an object to candidate sets (Sugeno, 1977). A fuzzy measure is defined as follows: Definitions. LetXbe a universal set andP(X) be the power set ofX.
A fuzzy measure, g, is a function, which assigns each crisp subset ofXa number in the unit interval [0, 1] with three properties:
1.g:P(X)![0, 1];
2.g(B) = 0,g(X) = 1 (boundary conditions); 3.AB2Ximpliesg(A)6g(B) (monotonicity).
In fuzzy measure, researchers always choose k-measure to measure the relationship of each element. Sugeno pro-posed the so-called k-fuzzy measure or Sugeno measure satisfying the following additional two properties:
1."A,B2P(X),A\B=/;
2.gk(A[B) =gk(A) +gk(B) +kgk(A)gk(B),
wherek2(1,1).
For two criteria A and B, if k> 0, i.e. gk(A[B) >
gk(A) +gk(B) implies A, B have multiplicative effect;
k= 0 impliesAandBhave additive effect; andk< 0 imply
A,Bhave substitutive effect. Sincekvalue is in the interval (1,1), researcher usually choosekvalue as0.99 and 1 to represent the different types of effect and to discuss the results.
General fuzzy measures and fuzzy integrals, which require only boundary conditions and monotonicity, are suitable for real life. Fuzzy measures and fuzzy integrals can analyze the human evaluation process and specify deci-sion-makers’ preference structures. Following the results of Section 3.2, the impact-digraph-map and the interrelation between components of each factor are illustrated. Criteria effectiveness is affected directly/indirectly by other criteria, and can be calculated as follows:
Step 1: Calculate affected element weights using fuzzy
measure. LetXbe a finite criterion set,X= {x1,x2,. . .,xn},
andP(X) be a class of all the subsets ofX. It can be noted asgi=gk(xi). Based on the properties of Sugeno measure, the fuzzy measure gk(X) =gk({x1,x2,. . .,xn}) can be
for-mulated as Eqs.(6) and (7)(Leszcynski, Penczek, & Groc-hulski, 1985). gkðfx1;x2;. . .;xngÞ ¼X n i¼1 giþkX n1 i1¼1 Xn i2¼i1þ1 gi1gi2þ þkn1gi1gi2 gin ¼1 k Yn i¼1 ð1þkgiÞ 1 for 1<k<1 ð6Þ kþ1¼Y n i¼1 ð1þkgiÞ ð7Þ
Step 2: Calculate the effectiveness of final affected
ele-ments using fuzzy integral. The fuzzy integral is often used
with fuzzy measure for the purpose of congregating infor-mation evaluation. The Choquet integral of fuzzy measure is the most frequently used calculation method. This paper adopts this method to calculate the effectiveness scores of final affected elements (criteria) of a factor. The basic con-cept of traditional integral and fuzzy integral can be illus-trated inFig. 4.
Lethis a measurable set function defined on the measur-able space ðX;@Þ, suppose that h(x1)Ph(x2)P P h(xn), then the fuzzy integral of fuzzy measure g(Æ) with respect to h(Æ) can be defined as Eq. (8) (Chen & Tzeng, 2001; Chiou & Tzeng, 2002; Ishii & Sugeno, 1985; Sugeno, 1974) (ðcÞRhdgmeans the Choquet integral). In addition, ifk= 0 andg1=g2= =gnthenh(x1)Ph(x2)P P h(xn) is not necessary. The basic concept of traditional inte-gral and fuzzy inteinte-gral can be illustrated inFig. 4.
ðcÞ Z hdg¼hðxnÞ gðHnÞ þ ½hðxn1Þ hðxnÞ gðHn1Þ þ þ ½hðx1Þ hðx2Þ gðH1Þ ¼hðxnÞ ½gðHnÞ gðHn1Þ þhðxn1Þ ½gðHn1Þ gðHn2Þ þ þhðx1Þ gðH1Þ; whereH1 ¼ fx1g;H2¼ fx1;x2g;. . .;Hn ¼ fx1;x2;. . .;xng ¼X ð8Þ
Step 3: Calculate factor effectiveness. Factor effectiveness
can be obtained based on the effectiveness of the final affected elements and other independent elements using the AHP method to be described in Section3.4.
3.4. Determining factors weights and overall utility value
The analytical hierarchy procedure (AHP) is proposed bySaaty (1980). AHP was originally applied to uncertain decision problems with multiple criteria, and has been widely used in solving problems of ranking, selection, eval-uation, optimization, and prediction decisions (Golden, Wasil, & Levy, 1989).Harker and Vargas (1987)stated that ‘‘AHP is a comprehensive framework designed to cope with the intuitive, rational, and the irrational when we make multi-objective, multi-criteria, and multi-factor deci-sions with and without certainty for any number of alterna-tives.’’ The AHP method is expressed by a unidirectional hierarchical relationship among decision levels. The top element of the hierarchy is the overall goal for the decision model. The hierarchy decomposes to a more specific crite-ria until a level of manageable decision critecrite-ria is met (Meade & Presley, 2002). Under each criterion, subcriteria elements relative to the criterion can be constructed. The AHP separates complex decision problems into elements within a simplified hierarchical system (Shee et al., 2003).
AHP procedures to gain the weights are described as follows:
Step 1:Pairwise-compare the relative importance of
fac-tors and obtain a n·n pairwise comparison matrix;nmeans the number of criteria.
Step 2:Check the logical judgment consistency using the
consistency index (C.I.) and consistency ratio (C.R.). The C.I. value is defined as C.I. = (kmax
n)/(n1), and the kmax is the largest eigenvalue of the pairwise comparison matrix. The C.R. value is defined as C.R. = C.I./R.I. (R.I.: random index. The R.I. value is decided by the value ofn. The R.I. values fromn= 1 to 10 be 0, 0, 0.58, 0.9, 1.12, 1.24,
struct a hierarchical evaluation system. Based on the inde-pendent factors obtained in Section 3.1 and the reduced criteria derived from Section3.2, the AHP method could gain factor weights and criteria, and then obtain the final effectiveness of the e-learning program.
4. Empirical experiment: cases of evaluating intertwined effects in e-learning
The empirical experiment in this paper was a collabora-tive research with MasterLink Securities Corporation, Tai-wan. The empirical examples are two e-learning training programs. Program 1, a novice-training program designed to acquaint new employees with the regulations, occupa-tional activities, and visions of a corporation, was estab-lished by Masterlink Securities. Program 2, designed by the Taiwan Academy of Banking and Finance, is a profes-sional administration skills training program. Based on the approach constructed in Section3, these two programs are used to explain the feasibility and features of the proposed evaluation model.
4.1. Materials
MasterLink Securities, founded in 1989, developed its core business to including brokerage, asset management, and investment banking in Taiwan, China, and Hong Kong. In Taiwan, Masterlink Securities Corporation with its 44 branches, has used e-learning as a training tool since 2003. Except for courses developed by Masterlink Securi-ties Corporation or purchased from the Taiwan Academy of Banking and Finance, some courses are outsourcing to consulting firms. An effective e-learning evaluation model is necessary for a company designed training programs and budget allowance.
Based on the criteria and approaches from the ADDIE model, Kirkpatrick theories, CIRO model, and other theo-ries (Bitner, 1990; Giese & Gote, 2000; Moisio & Smeds, 2004; Noe, 1986; Santos & Stuart, 2003; Wang, 2003), 58 criteria related to e-learning evaluation were chosen (shown inAppendix) and used to design Questionnaire 1. Employees in Questionnaire 1 were asked to score the importance of each element for effectiveness evaluation; then, the experiment was executed according to four stages as follows:
Step 1: The factor analysis to obtain independent criteria
groups. One hundred copies of Questionnaire 1 were
dis-tributed to employees of Masterlink Securities Corpora-tion, with 65 responses. Respondents included experts and professionals, familiar and experienced with
e-learn-ship and influence level of criteria under the same factor, and to score the relationship among criteria based on the DEMATEL method. Factors were divided into different types, so the experts could answer the questionnaire in areas they were familiar with. In order to limit information loss from DEMATEL method results, threshold values were decided after discussion with these experts and an acceptable impact-digraph-map was found.
Step 3: The fuzzy measure approach to find out the weights of intertwined criteria and the fuzzy integral to
cal-culate effectiveness. According to DEAMTEL results, the
intertwined criteria structures of a factor were found and the fuzzy measure employed to derive central criteria weights. Based on a map of each factor, after setting the
kvalue as0.99 and 1, the substitute effect and multiplica-tive effect, the fuzzy measure was used to calculate two dif-ferent weight sets of final affected elements. Concurrently, Questionnaire 2 was designed to investigate criteria effec-tiveness for using the fuzzy integral method. Questionnaire 2, a web questionnaire, asked Masterlink Securities Corpo-ration employees to score the utility value of criteria of two programs.
Step 4: The AHP method to find the weights and derive
e-learning program effectiveness. A further goal for
Ques-tionnaire 2 was to use a pair-comparing method to find the factor weights and reduced criteria by AHP methods, and ask employees to score the satisfaction utility of crite-ria. The score is based on the Likert five-point scale; 1 stands for very dissatisfied, 2 for dissatisfied, 3 for neither dissatisfied or satisfied, 4 for satisfied, 5 for very satisfied. Because there were two different program types and objec-tives, Questionnaire 2 was delivered to different employee groups. Twenty-six and 28 e-learning questionnaire surveys were returned, after which, factor weights and criteria were obtained and program effectiveness calculated.
4.2. Results
4.2.1. Result of Stage 1
Questionnaire reliability analysis was analyzed follow-ing responses received. Accordfollow-ing to reliability analysis results, Cronbach’savalue is higher than 0.8 and the stan-dardized element a value is 0.977 showing questionnaire reliability to be significant and effective (reliability analysis results shown inTable 1).
KMO and Bartlett’s test was used to measure the appro-priate usage of factor analysis. According to Kaiser’s research, KMO > 0.7 is middling to do factor analysis, and KMO > 0.8 is meritorious. The KMO value of this paper is 0.737 (Bartlett’s test of sphericity: approximately
v2= 4740, d.f. = 1653, significance = 0.000); therefore, it is suitable for factor analysis. This method uses a correlation coefficient to test whether it is suitable and significant to use factor analysis. According to the results of KMO and Bartlett’s test, this questionnaire is suitable to use factor analysis.
The principle component analysis was used to extract factors from 58 criteria and the varimax method was used for factor rotation. Then, nine factors whose eigenvalue was more than 1.0 were chosen. Nine factors were named based on the loading of each factor: ‘‘Personal Character-istics and System Instruction,’’ ‘‘Participant Motivation and System Interaction,’’ ‘‘Range of Instruction Materials and Accuracy,’’ ‘‘Webpage Design and Display Of Instruc-tion Materials,’’ ‘‘E-Learning Environment,’’ ‘‘Webpage Connection,’’ ‘‘Course Quality and Work Influence,’’ ‘‘Learning Records’’ and ‘‘Instruction Materials’’ (Shown inTable 2).
4.2.2. Result of Stage 2
According to factor analysis results, some experts and professionals were invited to discuss and scored the rela-tion between criteria of each factor based on the DEMA-TEL approach. Experts and professionals included system designers, webpage designers, instructors, manag-ers, and human resources experts. Factors 1 and 2 were dis-cussed with managers and human resources experts. Factor 4 was discussed with webpage designers. Factors 5 and 6 were discussed with system designers. Instructors were responsible to factors 3, 7, 8, and 9.
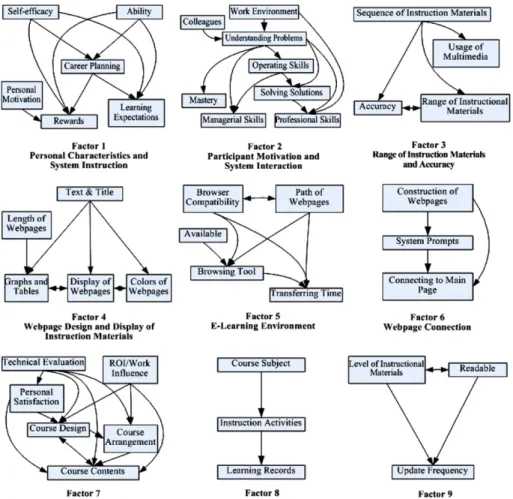
Thus, after experts and professionals scored the relation of criteria, the full direct/indirect influence matrix and the impact-digraph-map of each factor was calculated and drawn. According to the results of DEMATEL, the thresh-old value of each factor was decided by the experts. The threshold value of each factor from factors 1 to 9 is 0.85, 0.47, 1.5, 2.1, 1.6, 6.5, 2.1, 3.8 and 3.5. The
impact-digraph-maps of DEMATEL method results were
obtained and shown asFig. 5.
4.2.3. Result of Stage 3
According toFig. 5, the intertwined structures of several criteria, affected by other criteria, were illustrated. There-fore, the fuzzy measure for the final affected elements of each factor could be calculated out. Using factor 1 as an example, the criteria, ‘‘Rewards’’ and ‘‘Learning Expectations,’’ are two final affected elements affected by other criteria, but they did not influence other criteria. ‘‘Rewards’’ was affected by ‘‘Personal Motivation,’’ ‘‘Self-Efficacy,’’ ‘‘Career Plan-ning,’’ and ‘‘Ability;’’ ‘‘Learning Expectations’’ was affected
Table 1
Reliability analysis results
Source of variance Sum of sq. d.f. Mean square F-test Probability Between people 4541.418 65 69.868 Within people 6210.810 376 1.651 Between measures 308.001 57 5.404 Residual 5902.809 371 1.593 3.392 0.000 Total 10752.229 383 2.81 Grand mean 6.973 Alpha 0.977
Standardized element alpha = 0.978
Table 2
Factor analysis result: names and components (criteria) of factors
Factor Components ka Ab Bc
1 Personal Characteristics and System Instruction
Personal Motivation, Rewards, Work Attitude, Learning Expectation,
Work Characteristics, Self-Efficacy, Ability, Career Planning, Organization Culture, Instruction Goals, System Functions, System Instructions
25.98 44.8 44.8 2 Participant Motivation
and System Interaction
Operating Skills, Solving Solutions, Mastery, Managerial Skills, Professional Skills, Inspire Originality, Supervisor’s Support, Colleagues, Work Environment, Causes of Problem, Understanding Problems, Pre-Course Evaluation, Multi-Instruction, Communication Ways
4.926 8.494 53.3
3 Range of Instruction Materials and Accuracy
Accuracy, Range of Instruction Materials, Sequence of Instruction Materials, Usage of Multimedia
3.945 6.802 60.1 4 Webpage Design and
Display of Instruction Materials
Text & Title, Display of Webpages, Sentence Expression, Length of Webpages, Graphs and Tables, Colors of Webpages
2.533 4.368 64.5 5 E-Learning Environment Browser Compatibility, Browsing Tool, Path of Webpages, Transferring Time,
Available, Reflection of Opinions
1.956 3.372 67.83 6 Webpage Connection Underconstructing Webpages, System Prompts, Connecting to Main Page,
Connection of Webpages
1.846 3.183 71.02 7 Course Quality
and Work Influence
Course Arrangement, Course Design, Personal Satisfaction, Technical Evaluation, Course Contents, ROI/Work Influence
1.667 2.874 73.9 8 Learning Records Learning Records, Instruction Activities, Course Subject 1.505 2.596 76.5 9 Instruction Materials Level of Instructional Materials, Update Frequency, Readable 1.282 2.21 78.7 Extraction method: principal component analysis.
Rotation method: Varimax with Kaiser normalization.
a Eigenvalue. b Percentage of variance. c Cumulative %.
by ‘‘Career Planning,’’ ‘‘Ability,’’ and ‘‘Self-Efficacy.’’ Since these criteria have an influential relationship, the fuzzy mea-sure should be employed to evaluate the weights of ‘‘Rewards’’ and ‘‘Expectations.’’ The k value was set as 1 and0.99, indicating different synthetic effects of criteria.
Fuzzy measure results of final affected elements of factor 1 are listed inTable 3. The e-learning satisfaction survey could then be implemented to calculate the fuzzy integral value of each factor. For example, the satisfaction value of the crite-ria, ‘‘Personal Motivation,’’ ‘‘Self-Efficacy,’’ ‘‘Ability,’’ and
Fig. 5. The impact-digraph-maps of nine factors derived by DEMATEL method.
Table 3
Fuzzy measure for two final affected elements of factor 1 Factor Element k Fuzzy measure
1 Rewards 1 g1–1= 0.192,g1–6= 0.190,g1–7= 0.190,g1–8= 0.189 g(1–1,1–6)= 0.416,g(1–1,1–7)= 0.416,g(1–1,1–8)= 0.417,g(1–6,1–7)= 0.411,g(1–6,1–8)= 0.412,g(1–7,1–8)= 0.412, g(1–1,1–6,1–7)= 0.683,g(1–1,1–7,1–8)= 0.683,g(1–1,1–6,1–8)= 0.683,g(1–6,1–7,1–8)= 0.678 g(1–1,1–6,1–7,1–8)= 1 0.99 g1–1= 0.696,g1–6= 0.689,g1–7= 0.689,g1–8= 0.690 g(1–1,1–6)= 0.910,g(1–1,1–7)= 0.910,g(1–1,1–8)= 0.910,g(1–6,1–7)= 0.908,g(1–6,1–8)= 0.910,g(1–7,1–8)= 0.908, g(1–1,1–6,1–7)= 0.978,g(1–1,1–7,1–8)= 0.978,g(1–1,1–6,1–8)= 0.978,g(1–6,1–7,1–8)= 0.978 g(1–1,1–6,1–7,1–8)= 1 Learning Expectations 1 g1–6= 0.260,g1–7= 0.260,g1–8= 0.260 g(1–6,1–7)= 0.587,g(1–6,1–8)= 0.588,g(1–7,1–8)= 0.588, g(1–6,1–7,1–8)= 1 0.99 g1–6= 0.792,g1–7= 0.792,g1–8= 0.793 g(1–6,1–7)= 0.963,g(1–6,1–8)= 0.963,g(1–7,1–8)= 0.963, g(1–6,1–7,1–8)= 1
Table 4
Fuzzy integral results of each element in different programs
Factor Elements of factor kvalue Integral value Directive impact elements Indirective impact elements
Program 1 Program 2
1 Rewards 1 2.475 3.589 Self-Efficacy, Ability, Career Planning, Personal Motivation
0.99 2.552 3.753
Learning Expectations 1 2.447 3.593 Self-Efficacy, Ability, Career Planning
0.99 2.476 3.764
2 Managerial Skills 1 2.529 3.641 Understanding Problems, Operating Skills Work Environment, Colleagues
0.99 2.548 3.693
Professional Skills 1 2.507 3.609 Work Environment, Understanding Problems, Solving Solutions Colleagues, Operating Skills
0.99 2.623 3.761
Masterya 2.585 3.684 Understanding Problems Work Environment, Colleagues
3 Accuracy 1 2.671 3.626 Sequence of Instruction Materials, Range of Instruction Materials
0.99 2.763 3.682
Range of Instruction Materials 1 2.641 3.604 Sequence of Instruction Materials, Accuracy
0.99 2.696 3.678
Usage of Multimediaa 2.484 3.745 Sequence of Instruction Materials
4 Display of Webpages 1 2.537 3.697 Text & Title, Graphs and Tables, Colors of Webpages Length of Webpages
0.99 2.645 3.740
Graphs and Tables 1 2.471 3.688 Text & Title, Length of Webpages, Display of Webpages Colors of Webpages
0.99 2.577 3.739
Colors of Webpages 1 2.508 3.736 Text & Title, Display of Webpages Length of Webpages, Graphs and Tables
0.99 2.601 3.745
5 Transferring Time 1 2.360 3.602 Browser Compatibility, Browsing Tool, Path of Webpages Available
0.99 2.413 3.643
6 Connect To Main Page 1 2.498 3.608 Construction of Webpages, System Prompts
0.99 2.498 3.620
7 Course Contents 1 2.604 3.718 Technical Evaluation, ROI/Work Influence,
Personal Satisfaction, Course Design, Course Arrangement
0.99 2.676 3.771
8 Learning Recordsa 2.318 3.658 Instruction Activities Course Subject
9 Update Frequency 1 2.520 3.720 Level of Instructional Materials, Readable
0.99 2.546 3.741
a
Without synthetic effect, the element did not use the fuzzy measure and fuzzy integral for evaluation.
G.-H. Tzeng et al. / Expert Systems with Applications 32 (2007) 1028–1044
‘‘Career Planning’’ in program 2 are 3.597, 3.792, 3.719 and 3.370, and the integral value of ‘‘Rewards’’ atk= 1 is 3.589. The fuzzy integral values of the final affected elements are shown inTable 4. These results could be implemented to cal-culate final results of each program.
4.2.4. Result of Stage 4
The weights of nine factors and the reduced criteria were calculated out and used to find the effectiveness of each program. The final score for each program is shown in
Table 5.
5. Discussions
The proposed novel hybrid MCDM method should be a useful model for evaluating e-learning program effective-ness. Based on our empirical experiments of the Masterlink Securities Corporation’s e-learning program survey, factor
analysis was used to classify each element into nine differ-ent independdiffer-ent factors. Those criteria under the same fac-tor had some interrelations with each other. The direct/ indirect influential relationship of criteria was figured using the DEMATEL method. Affected criteria effectiveness was determined with the fuzzy integral value. Then, program effectiveness values were calculated by considering indepen-dent criteria effectiveness results, fuzzy integral value of intertwined criteria, and AHP factor weights. The hybrid MCDM model proposed in this paper contains the follow-ing properties:
5.1. The key elements found and improvement alternatives illustrated
Using the proposed model, a company may find factors that improve e-learning effectiveness. This paper also used the DEAMTEL method to find the direct/indirect influential
0.086 Work Attitudea 2.438 3.729 2.438 3.729 0.082 Work Characteristicsa 2.517 3.666 2.517 3.666 0.084 Organization Culturea 2.451 3.537 2.451 3.537 0.085 Instruction Goalsa 2.186 3.703 2.186 3.703 0.086 System Functionsa 2.362 3.640 2.362 3.640 0.082 System Instructionsa 2.258 3.615 2.258 3.615 2 0.115 0.183 Managerial Skills 2.548 3.693 2.529 3.641 0.183 Professional Skills 2.623 3.761 2.507 3.609 0.180 Masteryb 2.585 3.684 2.585 3.684 0.077 Inspire Originalitya 2.281 3.518 2.281 3.518 0.077 Supervisor’s Supporta 2.578 3.799 2.578 3.799 0.078 Causes of Problema 2.475 3.597 2.475 3.597 0.073 Pre-Course Evaluationa 2.498 3.495 2.498 3.495 0.074 Multi-Instructiona 2.592 3.729 2.592 3.729 0.074 Communication Waysa 2.438 3.684 2.438 3.684 3 0.109 0.378 Accuracy 2.763 3.682 2.671 3.626
0.378 Range of Instruction Materials 2.696 3.678 2.641 3.604 0.245 Usage of Multimediab 2.484 3.745 2.484 3.745 4 0.109 0.284 Display of Webpages 2.645 3.740 2.537 3.697 0.276 Graphs and Tables 2.577 3.739 2.471 3.688 0.278 Colors of Webpages 2.601 3.745 2.508 3.736 0.167 Sentence Expressiona 2.601 3.719 2.601 3.719
5 0.114 0.835 Transferring Time 2.413 3.643 2.360 3.602
0.165 Reflection of Opinionsa 2.331 3.631 2.331 3.631 6 0.111 0.679 Connect To Main Page 2.498 3.620 2.498 3.608 0.321 Underconstructing Webpagesa 2.498 3.597 2.498 3.597
7 0.109 1 Course Contents 2.676 3.771 2.604 3.718
8 0.104 1 Learning Recordsb 2.318 3.658 2.318 3.658
9 0.110 1 Update Frequency 2.546 3.741 2.520 3.720
Final score 2.489 3.644 2.452 3.610
a The criteria whoseinfluence leveldid not reach the threshold value were considered independent criteria. b Without synthetic effect, the element did not use the fuzzy measure and fuzzy integral for evaluation.
relationship of criteria that helps reduce the number of crite-ria and find factor improvement direction. Therefore, inter-active effects accurately reflect in the final evaluation.
According to weights derived by the AHP, central fac-tors, which are more important and will affect e-learning effectiveness, could be found. Therefore, the evaluator could determine the score of one e-learning program. After using this e-learning effectiveness evaluation model, evalu-ators found the aspects needing improvement, for e-learn-ing effectiveness to increase. Although the difference of each factor weight is not significant, as shown in Table 5, factor 5, ‘‘E-Learning Environment’’, with the highest weight (0.114) should be given more attention to effective-ness. The performance of factor ‘‘E-Learning Environ-ment’’ will affect the entire program effectiveness.
Using the DEMATEL can reduce the number of criteria for evaluating factor effectiveness; concurrently, a company can improve the effectiveness of a specific factor based on the impact-digraph-map. For example, the effectiveness of factor ‘‘Personal Characteristics and System Instruction,’’ can be represented by the effectiveness of central criteria ‘‘Rewards’’ and ‘‘Learning Expectations,’’ but the key ele-ment for improving factor ‘‘Personal Characteristics and System Instruction’’ are ‘‘Self-Efficacy’’ and ‘‘Ability.’’ It is easier for a company to find the exact department or per-sons responsible for improvement using results from the proposed model.
5.2. The fuzziness in effectiveness perception considered
The non-additive multi-criteria evaluation techniques, fuzzy measure and fuzzy integral, are employed to refine the situations which conform to the assumption of indepen-dence between criteria. Thekvalue used in the fuzzy measure and fuzzy integral affords another viewpoint for evaluating how to remove the mechanical additive evaluating method. This means improving individual criterion performance by considering the effect from the others if the synthetic effect exists. In other words, if the evaluator investigates the types of synthetic effects of learners, designer, managers, and other respondents, program effectiveness can be improved on the dependent criteria with a multiplicative effect.
Moreover, the concepts of the fuzzy measure and fuzzy integral approach used in the proposed model will make evaluation more practical and flexible by using differentk
values. For example, the original satisfaction value of crite-rion ‘‘Rewards’’ of factor, ‘‘Personal Characteristics and System Instruction’’ in program 1 is 2.416. According to
Table 4, the synthetic effect comes from ‘‘Personal Motiva-tion,’’ ‘‘Self-Efficacy,’’ ‘‘Ability,’’ and ‘‘Career Planning’’ criteria. After calculating the effectiveness using fuzzy mea-sure (k=0.99) and fuzzy integral, the effectiveness value of element ‘‘Rewards’’ changed to 2.552. This also con-forms to the situation that ‘‘Rewards’’ is not the single cri-terion for a learner to express the satisfaction on factor ‘‘Personal Characteristics and System Instruction.’’ If the criteria are independent, thek value can be set to 0.
5.3. The result of hybrid MCDM model is consistent with the traditional additive model
According to Table 5, the effectiveness of the general administration training (program 2) is better than the nov-ice training (program 1). Whether from substitutive effects (k=0.99) or multiplicative effects (k= 1), the effective-ness (satisfaction) of novice training is less than general administration training. The main reason for this result is that new employees go through novice training for the first time and are not familiar with e-learning type training. Therefore, they may not feel comfortable using this system and attending these kinds of programs. Furthermore, gen-eral administration training is an e-learning program rela-tive to daily work. The program consists of professional skills helpful to work; hence, employee satisfaction is high. Comparing the proposed hybrid MCDM model with the traditional additive models, the results are consistent. Pro-gram effectiveness is calculated by the traditional AHP method and the scores for programs 1 and 2 are 2.451 and. 3.617. Another survey, which asked employees to score the programs according to the Likert five-point scale for program satisfaction using the simple additive weight-ing (SAW) method, showed scores for programs 1 and 2 at 2.697 and. 3.828. These results show novice training to be less satisfactory than general administration training which is consistent with results from the proposed model. The results also mean that the hybrid MCDM model is a reasonable tool to evaluate e-learning programs.
6. Concluding remarks and future perspectives
E-learning evaluation is still deficient and does not have evaluation guidelines. Since e-learning could be evaluated in numerous and intertwined facets and criteria, a multi-criteria decision making model should be more suitable for e-learning evaluation. This paper outlines a hybrid MCDM evaluation model for e-learning effectiveness.
Based on several aspects of e-learning effectiveness eval-uation, this paper integrated several methods to make the proposed model, the hybrid MCDM model, much closer to reality. According to the results of empirical study, the hybrid MCDM model should be a workable and useful model to evaluate e-learning effectiveness and to display the interrelations of intertwined criteria. As a result, if the effectiveness of an e-learning program is deficient we could find out the problem based on AHP weights and interrelation based on the impact-digraph-map of each fac-tor. After using this e-learning effectiveness evaluation model, the evaluators could find the aspects needing improvement, so that e-learning program effectiveness could increase. Compared with traditional e-learning eval-uation, this model considers more aspects and criteria which may affect e-learning program effectiveness.
Though this paper establishes a new model to evaluate e-learning effectiveness, some interesting points may be worth investigating for further researches. This paper did
No. Criteria Description
1 Browser Compatibility Learning materials could be read by different browsers
2 Browsing Tool Browsing tool means the tools that could let users know how to go front page, next page and enlarge or contraction pictures. Browsing tool design, menu button design and interface design are consistency and easy to use 3 Path of Webpages System provides suitable function of learner control. Display the path of
learning materials
4 Transferring Time When a learner is learning online, the waiting time for transferring data is appropriate
5 Available Learning materials are easy to access and always be available
6 Reflection of Opinions Instruction website could let instructors to know the opinions of learners
7 Underconstructing
Webpages
Webpage won’t connect to under-construction Webpages and each links are work
8 System Prompts When something should be described and give some instructions, system will provide appropriate system prompt. System prompts and instructions match up with learning materials
9 Connecting to Main Page Every webpage could link back to main page 10 Connection of Webpages Relative Webpages could connect to each other
11 Text & Title The size of text and headline are appropriate. The row spacing and spacing are appropriate
12 Display of Webpages To display in screen size, general appearance are regularity and adjustment 13 Sentence Expressions The reading sequence, paragraphs, erratum and expression of
sentence are appropriate
14 Length of Webpage The classification of webpage contents and webpage length are comfortable to read 15 Graphs And Tables Graphs and tables are suitable expressed, the integration and composition
and background are displayed appropriately
16 Colors of Webpages Media display skills and usage of color could let learners feel comfortable. The colors of webpage design consider contrast of colors, systematic usage of colors and harmony of colors
17 Accuracy The accuracy of learning materials or cited terminology is appropriately used
18 Range of Instruction Materials
The contents of learning material, such as range, depth, integration and structure are properly display
19 Sequence of Instruction Materials
The display of learning materials is ordinal. The instruction materials integrate relative subjects and the structures of instruction material contents are appropriate
20 Usage of Multimedia Multimedia design is appropriate. The usage of voice and image could attract learners’ attention
21 Course Arrangement Course arrangement is proper. And course arrangement will affect the intention and the level of learners’ transfer what they have learned into their daily work 22 Course Design Course design provides what learners want to learn. According to course
design principle, the level of transference of implementing what learners have learned into daily work
23 Personal Satisfaction Personal satisfaction affects the level of transference of what workpeople have learned into work
24 Technical Evaluation Personal attitude toward the reflection of technical evaluation feedback affect the level of transference of what workpeople have learned into work
25 Course Contents According to course contents, the level of transference of implementing what workpeople has learned into work
Appendix(continued)
No. Criteria Description
26 ROI/Work Influence After participating e-learning courses, the affective level of spending time, investment and the return on investment
27 Learning Records System could record learners’ learning behavior and evaluate the learning performance
28 Instruction Activities Each instructional activity matches up with e-learning. Instruction activities are properly used
29 Course Subject The range and subject of course is appropriate
30 Level of
Instruction Materials
The level of instruction materials is suitable for learners. The learning materials contain their uniqueness
31 Update Frequency The update date of learning materials, the contents, the subjects and the items are fit in with trend and different time or places
32 Readable Learning materials are readable. They contain theories and practical issues
33 Personal Motivation Personal motivations of participating e-learning affect the level of transference of what learners have learned into work
34 Rewards Merit system and rewards affect the transference of what learners have
learned into work
35 Work Attitude Work attitude affect the level of transference of what learners have learned into work
36 Learning Expectation Personal expectations toward e-learning affect the level of transference of what learners have learned into work
37 Work Characteristics Personal work characteristics affect the level of transference of what learners have learned into work
38 Self-Efficacy Self-efficacy affects the level of transference of what learners have learned into work
39 Ability Personal abilities affect the level of transference of what learners have
learned into work
40 Career Planning Career planning and objectives setting affect the level of transference of what learners have learned into work
41 Organization Culture Organization climate and organization culture encourage learners applying what knowledge they have learned to workforce
42 Instruction Goals Learners realize the instruction goal of e-learning website
43 System Functions Provide the functional label of system operating interface. Provide search function of learning materials
44 System Instructions Provide instructions of system software and hardware. Provide the functions of download and print. Provide system menu
45 Operating Skills After learning, learners could increase the level of operating skills 46 Solving Solutions After learning, learners could find the way to solve problems
47 Mastery After learning, learners could master what they have learned during
e-learning courses
48 Managerial Skills After learning, learners could increase the level of managerial skills 49 Professional Skills After learning, learners could increase the level of professional skills 50 Inspire Originality After learning, learners could inspire originality
51 Supervisor’s Support Supervisors support affect learners implement what they have learned into work
52 Colleagues Colleagues could discuss and implement what they have learned into work
53 Work Environment Working environment encourages learners apply what they have learned to work
54 Causes of Problem After learning, learners could know the real reason which leads to occurrence
55 Understanding Problems After learning, learners could increase the understanding level of problems which they want to know
56 Pre-Course Evaluation According to learners’ background, provide pre-course assessment. Attract the motivation and interests of learners
57 Multi-instruction E-learning courses use multi-instructional ways to express
Bitner, M. J. (1990). Evaluating service encounters: The effects of physical surroundings and employee responses.Journal of Marketing, 54(2), 69–82.
Charles, T., Mahithorn, B., & Paul, A. B. R. (2002). The design of a training porgramme measurement model.Journal of European Indus-trial Training, 26(5), 230–240.
Chen, Y. W., & Tzeng, G. H. (2001). Fuzzy integral for evaluating subjectively perceived travel costs in a traffic assignment model. European Journal of Operational Research, 130(3), 653–664.
Chiou, H. K., & Tzeng, G. H. (2002). Fuzzy multiple-criteria decision-making approach for industrial green engineering. Environmental Management, 30(6), 816–830.
Chiou, H. K., Tzeng, G. H., & Cheng, D. C. (2005). Evaluating sustainable fishing development strategies using fuzzy MCDM approach.Omega, 33(3), 223–234.
Chiu, Y. J., Chen, H. C., Tzeng, G. H., & Shyu, J. Z. (2006). Marketing strategy based on customer behavior for the LCD-TV.International Journal of Management and Decision Making, 7(2/3), 143–165. Cooper, M. (1994). Evaluating professional training. Training and
Development, 10(10), 26–31.
Dick, W., & Carey, L. (1996).The systematic design of instruction. New York: Harper Collins.
Europa (2004). The eContent programme: Stimulating the production of digital content and promoting linguistic diversity. Available from
http://europa.eu.int/scadplus/leg/en/lvb/l24226d.htm.
Fontela, E., & Gabus, A. (1974). DEMATEL, innovative methods, Report no. 2, Structural analysis of the world problematique. Battelle Geneva Research Institute.
Fontela, E., & Gabus, A. (1976). The DEMATEL observer. Battelle Institute, Geneva Research Center.
Garavaglia, P. L. (1993). How to ensure transfer of training.Training & Development, 47(10), 57–69.
Geis, G. L., & Smith, M. E. (1992). The function of evaluation. In H. D. Stolovitch & E. J. Keeps (Eds.), Handbook of human performance technology. San Francisco: Jossey-Bass.
Giese, J. L., & Gote, J. A. (2000). Defining consumer satisfaction. Academy of Marketing Science Review. Available from http:// www.amsreview.org/articles/giese01-2000.pdf.
Golden, B. L., Wasil, E. A., & Levy, D. E. (1989). Applications of the analytic hierarchy process: A categorized, annotated bibliography. In B. L. Golden, E. A. Wasil, & P. T. Harker (Eds.), The analytic hierarchy process. Berlin: Springer-Verlag.
Hair, J. J. F., Anderson, R. E., Tatham, R. L., & Black, W. C. (1998). Multivariate data analysis. Englewood Cliffs, NJ: Prentice-Hall. Hall, M. L., & Nania, S. (1997). Training design and evaluation: An
example from a satellite based distance learning program. Public Administration Quarterly, 21(3), 370–385.
Hannum, W., & Hansen, C. (1989).Instructional systems development in large organizations. Englewood Cliffs, NJ: Educational Technology Publications.
Harker, P., & Vargas, L. (1987). The theory of ratio scale estimation: Saaty’s analytic hierarchy process. Management Science, 33(11), 1383–1403.
Hegstad, C. D., & Wentlign, R. M. (2004). The development and maintenance of exemplary formal mentoring programs in fortune 500 companies.Human Resource Management, 15(4), 421–448.
Hori, S., & Shimizu, Y. (1999). Designing methods of human interface for supervisory control systems. Control Engineering Practice, 7, 1413–1419.
Kirkpatrick, D. L. (1959b). Techniques for evaluating training programs: Part 2—learning.Journal of ASTD, 13(12), 21–26.
Kirkpatrick, D. L. (1960a). Techniques for evaluating training programs: Part 3—behavior.Journal of ASTD, 14(1), 13–18.
Kirkpatrick, D. L. (1960b). Techniques for evaluating training programs: Part 4—results.Journal of ASTD, 14(2), 28–32.
Leszcynski, K., Penczek, P., & Grochulski, W. (1985). Sugeno’s fuzzy measure and fuzzy clustering. Fuzzy Sets and Systems, 15(2), 147– 158.
Marks, R. B., Sibley, S. D., & Arbaugh, J. B. (2005). A structural equation model of predictors for effective online learning.Journal of Manage-ment Education, 29(4), 531–563.
Meade, L. M., & Presley, A. (2002). R&D project selection using the analytic network process.IEEE Transactions on Engineering Manage-ment, 49(1), 59–66.
Mhod, T. L., Rina, A., & Suraya, H. (2004). Teaching and learning of e-commerce courses via hybrid e-learning model in unitar.Journal of Electronic Commerce in Organizations, 2(2), 78–94.
Miller, S. M., & Miller, K. L. (2000). Theoretical and practical considerations in the design of web-based instruction. In B. Abbey (Ed.),Instructional and cognitive impacts of web-based education. IDEA Group Publishing.
Moisio, A., & Smeds, R. (2004). E-learning: A service offering.Knowledge and Process Management, 11(4), 252–260.
Moore, M. G. (1989). Three types of interaction.The American Journal of Distance Education, 3(2), 1–6.
Muilenburg, L. Y., & Berge, Z. L. (2005). Student barriers to online learning: A factor analytic study. Distance Education, 26(1), 29– 48.
Ng, K. C., & Murphy, D. (2005). Evaluating interactivity and learning in computer conferencing using content analysis techniques. Distance Education, 26(1), 89–109.
Noe, R. A. (1986). ‘trainees’ Attributes and attitudes: Neglected influences on training effectiveness. Academy of Management Review, 11(4), 736–749.
Philips, J. (1996).Accountability in human resource management. Oxford: Butterworth-Heinemann.
Roffe, I. (2002). E-learning: Engagement, enhancement and execution. Quality Assurance in Education, 10(1), 40–50.
Saaty, T. L. (1980). The analytical hierarchy process: Planning priority setting, resource allocation. New York: McGraw-Hill.
Santos, A., & Stuart, M. (2003). Employee perceptions and their influence on training effectiveness.Human Resource Management Journal, 13(1), 27–45.
Shee, D. Y., Tzeng, G. H., & Tang, T. I. (2003). AHP, fuzzy measure and fuzzy integral approaches for the appraisal of information service providers in Taiwan. Journal of Global Information Technology Management, 6(1), 8–30.
Sherry, A. C., Fulford, C. P., & Zhang, S. (1998). Assessing distance learners’ satisfaction with instruction: A quantitative and a qualitative measure.The American Journal of Distance Education, 12(3), 4–28. Sugeno, M. (1974).Theory of fuzzy integrals and its applications. Tokyo:
Tokyo Institute of Technology.
Sugeno, M. (1977). Fuzzy measures and fuzzy integrals: A survey. New York: North-Holland.
Tamura, M., Nagata, H., & Akazawa, K. (2002). Extraction and systems analysis of factors that prevent safety and security by structural models. In41st SICE annual conference, Osaka, Japan.
Tzeng, G. H., Yang, Y. P. Ou, Lin, C. T., & Chen, C. B. (2005). Hierarchical MADM with fuzzy integral for evaluating enterprise Intranet web sites.Information Sciences, 169(3–4), 409–426.
Urdan, T. A. (2000).Corporate e-learning: Exploring a new frontier. San Francisco: W.R. Hambrecht.
Wang, Y. C. (2003). Assessment of learner satisfaction with asynchronous electronic learning systems.Information & Management, 41(2), 75–86. Warfield, J. N. (1976).Societal systems, planning, policy and complexity.
New York: John Wiley & Sons.