Predictive Modelling and Analysis of Student Academic Performance Using One-Vs-All
Logistic Regression Approach
David Otoo-Arthur1,
Abdulai Jamal-Deen2,
Ferdinand Apietu Katsriku3
1,2,3Department of Computer Science University of Ghana, Legon, Accra - Ghana
Abstract –
Keywords: Educational Data Mining, One-Vs-All Logistic Regression, Prediction Model, Graduating Class, The quality of students and their academic achievement is critical to national development and hence the need to be able to predict their performance in order to forestall future failures. As such predictive modelling has drawn significant attention from the research community as it plays a significant role in determining the worth of graduates who will be responsible for economic and social growth of the country. Whereas most previous studies employed the use of data that are not purely academic, using purely students’ academic performance data from 2004 to 2014, this study employs educational data mining technique to describe the impact of the combination of high school grades and final course combination on the graduating class of students at the University of Ghana, Legon. The results obtained showed that high school grades and final course
I. Introduction
One important reason for educating individuals is to create an enabling environment for them to transform their lives and provide the manpower needs that drives the growth of every country. For this reason, the quality of students and their academic achievement has become critical and drawn much attention from the research community as it plays a significant role in determining the worth of graduates who will be responsible for economic and social growth of the country.
Studies conducted on the academic performance of students in relation to their programme orientation in Ghana showed that, socio-economic and psychological issues are the most predominant factors that impacts on academic performance [1][2][3]. It has also been identified that, course selection is another factor that influences the performance of students [4]. Pitchforth et. al [5] suggested that, factors that were mostly considered to directly influence timely completion were mainly personal, the research environment, the research project, and incoming skills.
Being able to predict the outcome of the academic performance of a student is very critical in every educational system. Management, lecturers, students and other stakeholders in education have always taken keen interest in the successful completion of students and their academic performance. Recently, there has been a heightened interest in tracking learning due to the emphasis on accountability in educational setting and the scarce national resources. A failure of a student in a course would increase the number of credit hours a student takes in a semester, consequently affecting the graduating class of such student and the time of certification [1].
Data mining techniques can be used to assist managers of education to extract interesting information and trends from academic records [6]. Data mining is the analysis of (often large) observational data sets to find unsuspected relationships and to summarize the data in novel ways that are both understandable and useful to the data owner [7][8][9]. Application of data mining techniques such as Classification Analysis, Decision Trees, Anomaly or Outlier Detection, Clustering Analysis and Regression Analysis on educational data can help improve some aspects of educational quality. For instance, knowledge discovered from the usage these techniques can be used in predicting the enrolment of students in a particular course, detection of unfair means used in online examination, detection of abnormal values in the result sheets of students, prediction about students’ performance and assist educators to monitor their students achievements [10][11].
composed of high school grades, course combination studied and student graduating class over the period of 2004 to 2014 obtained from the University of Ghana, Legon.
The rest of this study is organised as follows. Section II reviews the theoretical foundations underpinning the current study. Section III focuses on the methodology used to carry out the research. Section IV presents the results and discussions, and Section V presents the conclusion of the study and recommendations for future work.
II. Related Work
The application of data mining techniques in educational settings has received a lot of attention from researchers in recent years [12][13][14]. Data mining typically identifies valid novel, potentially useful and understandable correlations and patterns that exist in data [15]. The most common task of data mining usually involves: description, estimation, prediction, classification, clustering and association [9][16][17].
In an educational study, McNamarah [10] used descriptive data mining technique to determine the demographic attributes, qualification on entry, aptitude test scores, performance in first year courses, and their overall performance on the program. The study had implications on the School's admission policy which helped in the identification of an optimal set of admission indicators, which have the potential of predicting students' performance.
Among Predictive models, Classification has been used predominantly of all data mining approaches. In classification, the learning process is mostly supervised, and the acquired model is then used to assign new data to one of a set of well-defined classes [8][18][19].
Kovačić [17] used estimation to predict successful and unsuccessful students in a distance education by exploring the socio-demographic variables. The empirical results show that the most important factors separating successful from unsuccessful students are: ethnicity, course programme and course block. Similarly, this study aims to extrapolate a student academic performance, but unlike Kovačić [17], the variables used are purely academic.
The emergence of educational data mining has been phenomenal. Many educational researchers have described a number of ways in which data has supported decision making. Thorn [20] explored the application of Knowledge Management (KM) techniques to educational information systems—particularly in support of systemic reform efforts. He discovered that schools present difficult technical problems due to the variety of data needs and usage at schools.
Barneveld [21], showed that Data Mining can be used to identify the root problems of education and track progress of the student by showing a number of complexities in data collected at the school.
support in fostering improved teaching performance and better knowledge of students’ needs. Baradwaj and Pal [23], conducted a study on the analysis of student performance by selecting 50 students of Master of Computer Application from session 2007 to 2010. By means of classification, it was shown that extracting students’ performance at the end of semester examination assisted in identifying the dropouts and students who need special attention.
Baker [8] in his study on data mining for education enumerated several merits of Educational Data Mining EDM to education. One key area of application is in improving student models to offer complete information about a student’s features, such as knowledge, metacognition, motivation, and attitudes.
Prabha and Shanavas [14] discussed the application of EDM in making prediction based on increasing visibility into student actions using an experiment conducted on 6th grade student log from MathsTutor for mensuration. The outcome provided the teacher with a means of identifying the knowledge level of a student and grouping students for assistance. Sundar [24] applied Bayesian Network Classifiers for predicting student’s academic performance and generates a model which helps in early identification of dropouts and allow the teacher to provide appropriate counselling to students who need special attention.
Kardan et al. [25] examined the various elements that influence student course selection using neural networks in the context of e-learning and applying the obtained function to predict the final number registrations in every course after the drop and add period. Findings unveiled high prediction correctness proposed model performed better than three regression and naive approaches used in machine learning significantly. In addition, Guo [27] investigated and predicted student course satisfaction using neural networks. Student survey results collected from 43 courses in 11 semesters from 2002 to 2007, showed that the high distinction rate and number of students enrolled to a course in final grading are the two most significant factors to student course satisfaction.
A case study conducted by Mashael & Muna [26] used decision trees to predict student final GPA. The study showed that students will graduate with an excellent GPA depending on the grades obtained in mandatory courses. The study extracted useful knowledge for final GPA, and identify the most important courses in the students' study plan based on their grades in the mandatory courses.
Richardson and Woodley [4] investigated predictors of attainment in students awarded first degrees by institutions of higher education in the UK in 1995–96. Results showed that, those aged under 21 or between 26 and 50 at graduation were more likely to obtain first-class honours or second-class upper honours, but the pattern of age-related variation was different across different subjects of study. Overall, women were more likely to obtain good degrees than men with substantial difference in the ratio of good degrees in different subjects.
predicted the retention of 477 master’s and 124 doctorial students. Results from the study show the model was spot on as it increased the chances of students graduating with a degree and doctorate.
A study conducted by Rifkin and Klautau [28] in defence of OVA compared it to other schemes and showed that there is no compelling evidence that either single-machine approach or correcting coding outperform OVA when the underlying binary classifiers are well trained.
Karsmakers et al. [29] presented an algorithm to compute a multi-class kernel logistic regression model scalable to large data sets. Their result revealed that the performance was a straight forward probabilistic outcomes compared to support vector machine.
In another instance, [23] analyzed students’ performance data using ID3 classification algorithm to predict students’ marks in master of computer applications course from 2007 to 2010 in VBS Purvanchal University, Jaunpur. Their study extracted set of rules that sought to help students and tutors find ways to improve students' performance. Similarly, the authors in [18] used a classification model to predict the study track for 248 students from basic six schools in Mafraq city in Jordan. The decision tree reached an overall accuracy of 87%.
Nandeshwar and Chaudhari [30] compared the performance of various classifiers using educational data mining to predict students’ enrollment using admissions data. Their work built various classification learners' models to compare the result of the different learners and identified that the rules from J48 with Fayyad-Iranis’s discretizer, RiDor and nbins discretizer was to be the best. However, there was no substantial change found between the two datasets by any of the learners, by means of t-test with 95% confidence.
Most of the previous studies reviewed used demographic and students’ physical attribute variables. Others used a combination of academic data and demographic and/or students’ physical attributes. Also, some of these reviewed studies employed the use of purely statistical data analysis, neural networks, logistic regression and Bayesian network classifiers. Unlike these studies, our focused is entirely on purely academic variables. Moreover, this study aims at using OVA technique to build a classifier model which will be used to assess the level of impact on students’ final graduating class based on their high school grades and their course combinations of study in their final year. The variables we used were solely academic characteristics.
III. Methodology
Data on students’ high school grades and final year course combination at the university relevant to this study was obtained from the registry of University of Ghana, Legon. The data made up of 15,909 students record formed the basis of this study.
the University.
The basic idea behind OVA is that, a classification algorithm trains a logistic regression classifier ɵ(𝑖)(𝑥) for each class i to predict the probability that y = i. A new input 𝑥, to make prediction
picks the class i that maximizes. 𝑚𝑎𝑥𝑖 ɵ(𝑖)(𝑥)
The graduating class was categorized from 1 to 5 representing First Class, Second Class Upper, Second Class Lower, Third Class and Pass.
The modelling framework of this research was based on data mining process models CRISP-DM standard. Figure 1 shows the modelling framework, where f is the OVA logistic regression function.
Figure 1. Model Framework
We considered the following mathematical function on which the OVA Logistic Regression is based.
The normalized values were calculated using the following function.
𝑋𝑗𝑖 = 𝑋𝑗𝑖−𝜇𝑗
𝑆𝐷𝑗 (1)
Where i = record row number j = feature
𝑋𝑗𝑖 = 𝑗𝑡ℎ 𝑓𝑒𝑎𝑡𝑢𝑟𝑒 𝑓𝑜𝑟 𝑡𝑒 𝑖𝑡ℎ 𝑟𝑒𝑐𝑜𝑟𝑑
𝜇𝑗= 𝜇𝑗=(𝑋𝑗
1+ 𝑋
𝑗2+ 𝑋𝑗3+ ⋯ + 𝑋𝑗𝑛)
𝑛
𝑖. 𝑒. 𝐴𝑣𝑒𝑟𝑎𝑔𝑒 𝑓𝑜𝑟 𝑡𝑒 𝑗𝑡ℎ 𝑐𝑜𝑙𝑢𝑚𝑛
𝑎𝑛𝑑 𝑛 𝑖𝑠 𝑡𝑒 𝑡𝑜𝑡𝑎𝑙 𝑛𝑢𝑚𝑏𝑒𝑟 𝑜𝑓 𝑟𝑒𝑐𝑜𝑟𝑑𝑠.
The Records positions in the dataset were randomly shuffled and divided into three sets: training set, cross-validation, and the test set in the ratio of 70%, 15% and 15% respectively. This was implemented with a Matlab script.
We use equation (2) a function for fitting the parameters theta.
𝐽(𝜃) = 1
𝑚 ∑ [−𝑦(𝑖)𝑙𝑜𝑔 (𝜃(𝑥(𝑖))− 1(1 − 𝑦(𝑖))𝑙𝑜𝑔 (1 − 𝜃(𝑥(𝑖)))+
𝑚
𝑖=1 + 2𝑚𝜆 ∑𝑛𝑗=1𝜃𝑗2 (2)
𝑤𝑒𝑟𝑒 𝑚 = 𝑡𝑜𝑡𝑎𝑙 𝑛𝑢𝑚𝑏𝑒𝑟 𝑜𝑓 𝑡𝑟𝑎𝑖𝑛𝑖𝑛𝑔 𝑟𝑒𝑐𝑜𝑟𝑑𝑠, 𝜆 = 𝑇𝑒 𝑟𝑒𝑔𝑢𝑙𝑎𝑟𝑖𝑧𝑎𝑡𝑖𝑜𝑛 𝑝𝑎𝑟𝑎𝑚𝑒𝑡𝑒𝑟
𝑦𝑖 = 𝑖𝑡ℎ 𝑟𝑒𝑐𝑜𝑟𝑑 𝑡𝑎𝑟𝑔𝑒𝑡 𝑣𝑎𝑟𝑖𝑎𝑏𝑙𝑒𝑠
f
High School Grades
Graduating Class
𝑥(𝑖)= 𝑖𝑡ℎ 𝑓𝑒𝑎𝑡𝑢𝑟𝑒
We presented the hypothesis using the sigmoid function in equation (3)
𝜃(𝑧) = 1+𝑒1−𝑧, 𝑤𝑒𝑟𝑒 𝑧 = −𝜃𝑇𝑋(𝑖) and 𝑥(𝑖)= 𝑖𝑡ℎ 𝑟𝑒𝑐𝑜𝑟𝑑
In order to prevent overfitting, the cost function was regularized to give the equation (4)
𝐽(𝜃) = 1
𝑚 *∑ [𝑦𝑖((𝑥(𝑖)) + (1 − 𝑦(𝑖))(1 − 𝜃(𝑥(𝑖)))+
𝑚
𝑖=1 + 𝜆 ∑𝑛𝑗=1𝜃𝑗2+ (4)
𝑤𝑒𝑟𝑒 𝑛 = 𝑡𝑒 𝑛𝑢𝑚𝑏𝑒𝑟 𝑜𝑓 𝑓𝑒𝑎𝑡𝑢𝑟𝑒𝑠 𝑎𝑛𝑑 𝜆 = 𝑡𝑒 𝑟𝑒𝑔𝑢𝑙𝑎𝑟𝑖𝑧𝑎𝑡𝑖𝑜𝑛 𝑝𝑎𝑟𝑎𝑚𝑒𝑡𝑒𝑟.
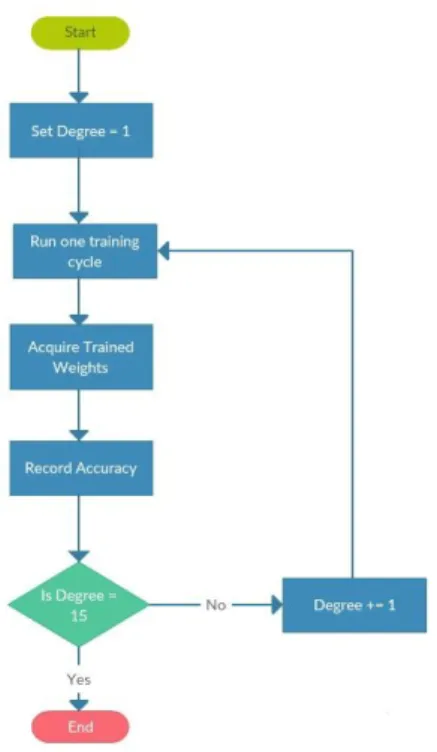
Weights were then acquired for each training cycle and the associated prediction accuracies on the training set and the cross validation sets were recorded to obtain the right polynomial degree to map features. Each training cycle consisted of two thousand iterations. The range of polynomial degree used was 1 to 15. This is illustrated in figure 2.
Table 1 shows sample of records during the selection of the right polynomial degree.
Training CV Test set
1 0.477946 0.471014 0.481411
2 0.49811 0.478576 0.483932
3 0.503466 0.486137 0.485507
4 0.503361 0.480781 0.485822
5 0.501155 0.480151 0.486137
6 0.506196 0.485192 0.490548
Table 1: Selection of the right polynomial degree
Figure 3: Flow chart showing how the right polynomial degree was selected
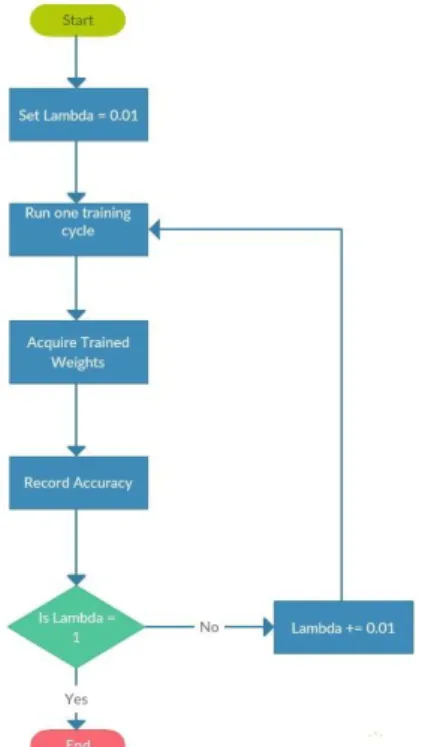
To select the right lambda for the hypothesis, weights for predicted accuracies were varied from 0.01 to 1 at an interval of 0.01 and the associated prediction accuracies were recorded. Each training cycle consisted of two thousand iterations. This is illustrated using the flow chart in figure 3.
IV. Results and Discussion
Results from model selectionvalidation set however recorded its highest accuracy with a polynomial degree of 3 with 49.05% and that of the lowest at 47.10% at a degree of degree 1 as shown in figure 4
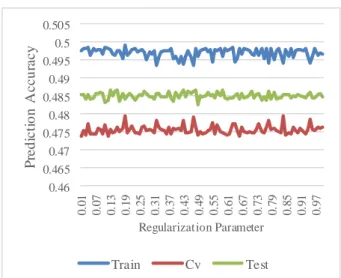
The highest prediction accuracy on the training set and cross validation set recorded were 49.90% and 47.95% with the same lambda at 0.19. The minimum prediction accuracy for the training set and cross validation set were 49.36% at 0.47 and 47.39 at 0.12. This is illustrated in figure 5.
Figure 4: Chart showing the Prediction Accuracy of the Degree of Hypothesis.
Figure 5: Prediction accuracies associated with regularization parameter.
Results from Hypothesis testing
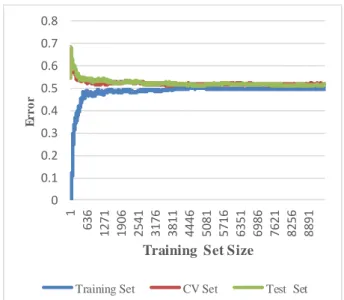
The learning rate for the training set of OVA showed an easy fit for the hypothesis initially with few errors. As the training set size grew the error on the training set increased from 0 and rapidly rose to 0.48 within a training set size of 682 and then maintained a steady increase with a very slow pace, this is typical, because as the training size grows it becomes more difficult for the hypothesis to completely the fit the data points. Conversely, the error on the cross validation set rose up from 0.54 to 0.68 within a set size of 28 initially and decreased rapidly from 0.68 to 0.52 at a set size of 1,253 and then decrease further at a slower pace, this is also typical, because
0.45 0.46 0.47 0.48 0.49 0.5 0.51
1 2 3 4 5 6 7 8 9 10 11 12 13 14 15
P re d ic ti o n A c c u ra c y
The Hypothesis Degree
Training CV Test set
0.46 0.465 0.47 0.475 0.48 0.485 0.49 0.495 0.5 0.505 0 .0 1 0 .0 7 0 .1 3 0 .1 9 0 .2 5 0 .3 1 0 .3 7 0 .4 3 0 .4 9 0 .5 5 0 .6 1 0 .6 7 0 .7 3 0 .7 9 0 .8 5 0 .9 1 0 .9 7 P re d ic ti o n A c c u ra c y Regularization Parameter
increased training set allows the hypothesis to generalize well on unseen data. This is illustrated in figure 6.
Figure 6: Learning Rate OVA Logistic Regression Model.
1 2 3 4 5
1 0.00 53.95 46.05 0.00 0.00
2 0.00 41.82 58.18 0.00 0.00
3 0.00 22.40 77.60 0.00 0.00
4 0.00 8.10 91.90 0.00 0.00
5 0.00 45.00 55.00 0.00 0.00
Table 1. Confusion Matrix for our Experiment
Table 1 shows the classification results in OVA model. The confusion matrix reports correctly classified and misclassified classes for the various graduating classes. The highest values that were correctly classified is 77.68% for second class lower division with the second class upper recording 41.82% for correct classification.
V. Conclusion and Future Work
Extrapolating students’ possible performance based on the high school final grades and choice of course combination in the tertiary level is very essential in helping students’ choose the appropriate course combinations and educators to enhance teaching and learning process. In this paper, multi-class classification technique is applied on a dataset of 15,872 students to assess the impact of high school grades and university course combination on a student’s
0 0.1 0.2 0.3 0.4 0.5 0.6 0.7 0.8
1
636 1271 1906 2541 3176 3811 4446 5081 5716 6351 6986 7621 8256 8891
E
r
r
o
r
Training Set Size
graduating class. OVA logistic regression model was developed based on some selected inputs from students’ high school grades and the final year course combination at the university. The model best performance revealed that there is no significant impact of students’ high school grades and final year course combination on the graduating class of students. This in essence can largely be associated to the nature of the data and not the developed model, since the learning curve in figure 6 illustrates that the model exhibits an impressive learning capability and also, on a close observation of the data acquired, some students performed extremely well in their Senior High School scores but had a very poor graduating class at the university, and vice versa.
Future work will focus on a comparative analysis with other data mining techniques on the same dataset to assess, compare and contrast their outcomes.
References
[1] A. Luguterah and B. Apam, “Predicting Student Completion Status Using Logistic Regression Analysis,” vol. 9, no. 20, pp. 207–213, 2013.
[2] R. E. V. P. D. a Nyarko, “Polytechnic Education in Ghana: The Challenges and Prospects,” An
Address, no. Act 745, pp. 1–7, 2011.
[3] V. Mlambo, “An analysis of some factors affecting student academic performance in an introductory biochemistry course at the University of the West Indies,” vol. 1, no. 2, pp. 79–92, 2011.
[4] J. T. E. Richardson and A. Woodley, “Another look at the role of age, gender and subject as predictors of academic attainment in Higher Education,” Stud. High. Educ., vol. 28, no. 4, pp. 475–493, 2003.
[5] J. Pitchforth, S. Beames, A. Thomas, M. Falk, C. Farr, S. Gasson, S. A. Thamrin, and K. Mengersen, “Factors affecting timely completion of a PhD: A complex systems approach,” J.
Scholarsh. Teach. Learn., vol. 12, no. 4, pp. 124–135, 2012.
[6] A. Sharabiani, F. Karim, A. Sharabiani, M. Atanasov, and H. Darabi, “An Enhanced Bayesian Network Model for Prediction of Students ’ Academic Performance in Engineering Programs,” no. April, pp. 832–837, 2014.
[7] D. Hand, Principles of Data Mining, vol. 2001. 2001.
[8] R. S. J. Baker, “Data Mining for Education Data Mining for Education Advantages Relative to Traditional Educational Research Paradigms.”
[9] D. Kabakchieva, “Predicting student performance by using data mining methods for classification,” Cybern. Inf. Technol., vol. 13, no. 1, pp. 61–72, 2013.
[10] A. Mohamed, W. Husain, and A. Rashid, “The Third Information Systems International Conference A Review on Predicting Student ’ s Performance using Data Mining Techniques,” Procedia - Procedia Comput. Sci., vol. 72, pp. 414–422, 2015.
Students using Classification,” vol. 2, no. 2, pp. 51–56, 2012. [12] J. Luan, “Data Mining Applications in Higher Education,” 2004.
[13] M. Vranic, D. Pintar, and Z. Skocir, “The use of data mining in education environment,” pp. 243–250, 2007.
[14] S. L. Prabha, “E d m a,” vol. 1, no. 1, pp. 23–29, 2014.
[15] H. C. Chang and C. C. Hsu, “Using topic keyword clusters for automatic document clustering,” IEICE Trans. Inf. Syst., vol. E88–D, no. 8, pp. 1852–1860, 2005.
[16] DANIEL T. LAROSE, Discovering Knowledge in Data. 2005.
[17] Z. J. Kovacic, “Predicting student success by mining enrolment data,” Res. High. Educ. J., vol. 15, no. iii, pp. 1–20, 2012.
[18] Q. a Al-radaideh, A. Al Ananbeh, and E. M. Al-shawakfa, “a Classification Model for Predicting the Suitable Study Track for School Students,” Ijrras, vol. 8, no. August, pp. 247– 252, 2011.
[19] M. Agaoglu, “Predicting Instructor Performance Using Data Mining Techniques in Higher Education,” pp. 2379–2387, 2016.
[20] C. A. Thorn, “Knowledge Management for Educational Information Systems : What Is the State of the Field ?,” vol. 9, no. 47, pp. 1–32, 2001.
[21] C. Van Barneveld, “WHAT WORKS ? Research into Practice,” pp. 2–5, 2008.
[22] J. C. Wayman, “Technology-Supported Involvement of Entire Faculties in Examination of Student Data for Instructional Improvement,” vol. 112, no. August, 2006.
[23] B. K. Baradwaj, “Mining Educational Data to Analyze Students ‟ Performance,” vol. 2, no. 6, pp. 63–69, 2011.
[24] P. V. P. Sundar, “A Comparative Study for Predicting Stude Nt ’ S Academic Performance Using Bayesian Network Classifiers,” vol. 3, no. 2, pp. 37–42, 2013.
[25] A. A. Kardan, H. Sadeghi, S. S. Ghidary, and M. R. F. Sani, “Prediction of student course selection in online higher education institutes using neural network,” Comput. Educ., vol. 65, pp. 1–11, 2013.
[26] M. a. Al-Barrak and M. Al-Razgan, “Predicting Students Final GPA Using Decision Trees: A Case Study,” Int. J. Inf. Educ. Technol., vol. 6, no. 7, pp. 528–533, 2016.
[27] S. W. . Pyke and P. M. . Sheridan, “Logistic Regression Analysis of Graduate Student Retention,” Can. J. High. Educ., vol. XXIII, no. 2, pp. 44–64, 1993.
[28] R. Rifkin, “In Defense of One-Vs-All Classification,” vol. 5, pp. 101–141, 2004.
[29] P. Karsmakers, K. Pelckmans, and J. A. K. Suykens, “Multi-class kernel logistic regression : a fixed-size implementation,” vol. 1, no. 3.
[30] A. Nandeshwar and S. Chaudhari, “Enrollment prediction models using data mining,”