109
Descriptive Analysis of Somatic Cell Count Using
Statistical Tools
Alina Cărunta
1, Mihai Chiș
1, Daniela Elena Ilie
2,3, Kristian Miok
1,
Radu Moleriu
1,
Raluca Mureșan
1, Claudia Zaharia
1, Daniela Zaharie
11West University of Timișoara, Faculty of Mathematics and Computer Science, 300223, Timisoara,
blvd. Vasile Pârvan, 4, Romania
2Research and Development Station for Bovine – Arad, 310059, Arad, Bodrogului, 32, Romania
3Banat’s University of Agricultural Sciences and Veterinary Medicine “King Michael I of Romania” from
Timisoara, 300645, Timisoara, Calea Aradului 119, Romania
Abstract
Somatic cell count (SCC) can be used as an indicator of subclinical mastitis and its analysis in relation with the milk composition can provide useful information on the existence of some correlations or patterns. Based on milk production data recorded during 5 years (2012-2015, 2017) at the Research and Development Station for Bovine Arad we conducted a statistical analysis aiming to identify correlations between SCC and milk characteristics (protein and fat content, lactose, non-fat solids, milk quantity, pH, casein) and to find potential profiles of SCC evolution. The correlation analysis was based on 226 lactating cows for which at least 20 measurements were available. Both classical correlation coefficient (i.e. Pearson) and correlation coefficient for repeated measurements (i.e. Bland-Altman) have been computed. In both cases, a moderate negative correlation between SCC and the lactose level has been identified while no significant correlation between SCC and the other milk characteristics has been detected. However, a more accurate description of the relation between SCC and lactose was obtained using a linear mixed model. Aiming to analyse SCC profiles, an additional attribute has been added to the data based on the following encoding rule: the attribute has value 0 if SCC is smaller than 2x10⁵ cells/ml, 1 if it is larger than 2x10⁵ cells/mL and 2 if the value is missing. In this way, data vectors containing 13 values per year have been constructed for 175 cows and a dissimilarity matrix has been constructed as a first step for cluster analysis. Overall, the results have shown that lactose and SCC were negatively correlated.
Keywords: clustering, correlation analysis, mastitis, similarity measures, somatic cell count.
1. Introduction
Mastitis is one of the most frequently occurring and costly diseases in dairy industry worldwide [1, 2] with an incidence ranging from 12% to 40%. The disease represents one of the major reasons for involuntary culling and productive loss. Economical estimations indicated an average cost per mastitis case ranging from 95 to 211 USD, depending on the pathogen and status of the cow
* Corresponding author: Alina Cărunta, [email protected]
110 somatic cell count (SCC) is frequently utilized to control the intramammary infections status at both herd and cow levels. The SCC measurements are extensively available to dairy farmers and are used more often as a result of low cost comparing to microbiological culture [6].
Milk somatic cells are secreted in milk during the normal course of milking and are a mixture of milk-producing cells and immune cells [7]. The SCC represents the cell count of somatic cells in milk and is used as an indicator for estimating mammary health and milk quality of dairy animals. The SCC is quantified as the number of somatic cells per millilitre and within Europe, the limit is 4x10⁵
cells/ml according to Council Directive 92/46/EEC of 1992. In the USA, the legal maximum SCC is 7.5 x10⁵ cells/ml and Canada has a limit of 5x10⁵
cells/ml of raw milk [8]. Generally, a level of SCC below 105 cells/ml represents a healthy quarter and a
level larger than 2x10⁵ cells/ml indicates mastitis [8,
9]. Many countries employ SCC as an indicator in order to monitor the mastitis frequency in dairy cows and also as a marker of raw milk quality because of wide availability and use throughout the dairy industry in the world. The number of somatic cells in milk can be significantly increased by poor management practices, stressful conditions and any environmental conditions changes [7]. However, the number of somatic cells in milk is influenced also by other factors such as parity, lactation stage, cow productivity, health and breed. Increased SCC is correlated with decreases in casein, milk fat, and lactose; increased enzymatic activity; and implicitly reduced quality and yield of milk [2, 10]. The inflammatory process in the mammary gland was observed at cow and heard level using the SCC as diagnostic tool.
The aim of the current research was to analyse the applicability of several statistical approaches (correlation analysis, mixed linear models, cluster analysis) in the identification of correlations between SCC and milk characteristics (protein and fat content, lactose, non-fat solids, milk quantity, pH) and of some potential profiles of SCC evolution.
2. Materials and methods
Animals
All research activities involved in the present study were performed in accordance with the European Union’s Directive for animal
experimentation (Directive 2010/63/EU). The study was carried out in a farm situated in the West part of Romania at the Research and Development Station for Bovine Arad, where Romanian Spotted and Romanian Brown cows, managed under identical conditions, were included in the research herd. The cattle involved in the study were primiparous and multiparous (between 1th and 11th lactation) and were included in the Official Performance and Recording Scheme. A dataset of 264 cows (215 Romanian Spotted and 49 Romanian Brown) was analysed.
All cattle were milked twice per day in a ‘herringbone’ milking parlour (2 sides x 14 units). The milking parlour was equipped with AfiMilk 3.076 A-DU® software. Furthermore, all cattle were fitted with AfiTag® pedometers. During the study, cattle were kept on deep straw bedding, with a space allowance of 9 m2 in the resting area
and free access to water and outside paddocks. Cattle were housed in groups of 40 to 50 animals, according to lactation stage and productivity, regardless of their breed.
Data collection
Milk yield per milking session and milk conductivity were recorded and collected daily using AfiMilk 3.076 A-DU® software and
hardware fitted in the milking parlour during 5 years (2012-2015, 2017). Production and milk quality data (milk production, protein and fat content, lactose, non-fat solids, pH and the somatic cell count) were taken from the results of the official performance recordings
Statistical analysis
Aiming to identify statistical methods appropriate for the analysis of the collected data, characterized by a temporal but also hierarchical structure due to repeated measurements, several methods have been investigated. The analysed statistical techniques are shortly described in the following.
a) Pearson correlation analysis. Primary
statistical tools to study correlations between two quantitative variables X and Y are the Pearson correlation coefficient r (quantifying linear association) and the Spearman correlation coefficient ρ (used to investigate monotonic associations that may not necessarily be linear).
(b) Intra-class correlation coefficient. An
111 observations on the same subject tend to be more alike than observations on different subjects. The extent of this homogeneity is quantified by the intra-class correlation coefficient (ICC), defined, for a given quantitative variable, as the ratio of the between-subject variance and the total variance. A high ICC indicates that groups of observations are homogeneous and/or very different from each other. An ICC equal to 0 means that there is no between-subject variance. In this case, in the context of a correlation analysis, the grouping of observations has no impact on the relation between the variables of interest and can be ignored in further analyses.
(c) Correlation coefficient for repeated
measurements. An alternative that can be used
when there are several measurements on the same variable for each subject is the repeated
measurements correlation coefficient (rmcorr)
proposed by Bland and Altman [11, 12], which quantifies the common within-individual linear association for paired measures assessed on two or more occasions for multiple subjects. Namely, it can be used to analyse if,for a subject, an increase in the values of the first variable is associated with an increase or decrease in values of the second variable. The determination of rmcorr between X
and Y involves defining a linear model with Y as the response variable and X and the subject as predictors by which the variation of Y is partitioned in the variation explained by X (SSX),
the variation explained by subjects (SSB), and the
residual variation (SSres). Removing the variation
due to subjects, rmcorr is defined as
having the same sign as X in the regression model. The value of rmcorr remains the same if X and Y
are interchanged. A limitation of rmcorr is that, as one can see from the definition, it assumes that the impact of X on Y is the same for all individuals (the slopes of the regression lines for all subjects are the same). More details about this statistical analysis technique can be found in [13].
(d) Linear mixed models. A more general
framework which allows the modelling of differing within-subject behaviours is represented by linear mixed models. Here the slopes of individual regression lines are allowed to vary, as
well as the intercepts. They are treated as random coefficients and we may be interested in their mean, their variance and their covariance. Namely, in our case the model can be stated as
where and denote the values of X and Y for observation i on subject j, and are subject – specific intercepts and slopes, and represents residual random error, assumed to be normally distributed, with homogeneous variance across subjects. For a detailed technical discussion on linear mixed models we refer the reader to [14] and [15].
(e) Cluster analysis. This technique relies on the
usage of the dissimilarity between data instances (e.g. consisting of values recorded for one subject) in order to identify natural groups (clusters) in the data. In the context of this paper both hierarchical agglomerative algorithms and partitional algorithms (PAM – partitioning around medoids) have been used to identify atypical behaviour (outliers) and prototypes (e.g. behaviour profiles), respectively.
Software tools
The statistical analyses were carried out in R, version 3.5.2. The computation of rmcorr was performed using the package rmcorr [16]. The linear mixed model was fit using the facilities of the package multilevel [17]. The cluster analysis is based on clust and TSclust packages [18].
3. Results and discussion
(a) Results of the analysis based on Pearson
correlation coefficient. By computing the Pearson
112 of independence is violated, making the conclusions obtained by using this coefficient unreliable. Same remark is true for the Spearman correlation coefficient. In the following, we will
analyse the association between SCC and lactose by using approaches which take into account the nested structure of data.
Table 1. Pearson Correlation Coefficient between SCC and milk characteristics
Characteristic C1 C2 C3 C4 C5 C6 C7 C8 C9
r -0.08 -0.01 0.05 -0.30 -0.14 0.06 0.02 -0.09 0.01
Milk characteristics: C1 – quantity, C2 – casein, C3 – fat level, C4 – lactose, C5 – pH, C6 – protein level, C7 – fat per protein level, C8 – non-fat solids, C9 – urea
Table 2. Intraclass Correlation Coefficient for SCC and milk characteristics
Characteristic SCC C1 C2 C3 C4 C5 C6 C7 C8 C9
ICC 0.17 0.13 0.01 0.15 0.34 0.23 0.15 0.11 0.24 0.05
Milk characteristics: C1 – quantity, C2 – casein, C3 – fat level, C4 – lactose, C5 – pH, C6 – protein level, C7 – fat per protein level, C8 – non-fat solids, C9 – urea
(b) Results of the analysis based on ICC. Table 2
shows the intra-class correlation coefficients for the investigated variables. The highest ICC was found for lactose. This is a strong argument against the validity of the Pearson correlation coefficient when analysing the relation between lactose and SCC suggesting that other techniques should be investigated.
(c) Results of the analysis based on thecorrelation
coefficient for repeated measurements. The value
of rmcorr between SCC and lactose for our data
set is -0.26, which is only slightly different from the Pearson correlation coefficient found earlier. However, this result should be treated with caution as rmcorr assumes, as mentioned before, that the impact of X on Y is the same for all individuals. When this is not the case, i.e. when we suspect that different subjects exhibit different relations between X and Y, rmcorr may no longer be appropriate. To investigate this possibility, we computed the Pearson correlation coefficient between SCC and lactose for each subject. These coefficients were found to have a large variability, ranging between 0.85 and 0.22, with a mean of -0.30. The distribution of the correlation coefficients is presented in (Figure 1.(a)). There are subjects displaying a positive association between SCC and lactose and subjects for which the association is negative, pointing to a clear difference in individual responses. This could be explained by the existence of various individual traits, such as age, breed, season, diet, environment, which have an influence on SCC
and lactose and which are not taken into account in this model.
For further emphasis of this behaviour, the two cows with the most extreme values of the Pearson correlation coefficients, -0.85 and 0.22, respectively, were considered separately. In (Figure 1.(b)) is illustrated that the relation between SCC and lactose is very different for these two subjects, the correlation coefficient of
r=-0.65 found for their joint data being representative for neither subject. For the first one (dashed line), there is a clear decrease in lactose as SCC increases, whereas for the second one (dotted line), lactose remains elevated even as SCC increases. Consequently, the determination of
rmcorr is not a suitable analysis technique in this
case.
(d) Results of the analysis based on linear mixed
models. We considered a linear mixed model with
113 a greater base lactose value does not imply a stronger relation with SCC.
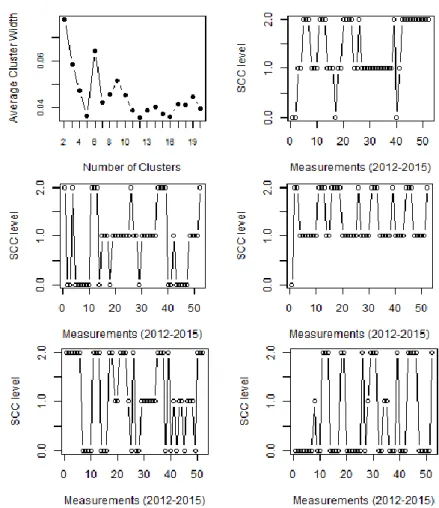
(e) Results of the cluster analysis. The aim of the
cluster analysis was to investigate the time series of events corresponding to subclinical mastitis occurrence (SCC value larger than 2x10⁵
cells/ml). Therefore, in a first approach, an additional attribute has been added to the data, based on the following encoding rule: the attribute has value 0 if SCC is smaller than 2x10⁵ cells/ml,
1 if it is larger than 2 x10⁵ cells/mL and 2 if the
value is missing.
Figure 1. (a) The distribution of individual Pearson
correlation coefficients for the 226 cows Figure 1. (b) cows (dashed line: cow 1 and dotted line: cow 2) and Scatterplot of SCC vs lactose for two
corresponding regression lines
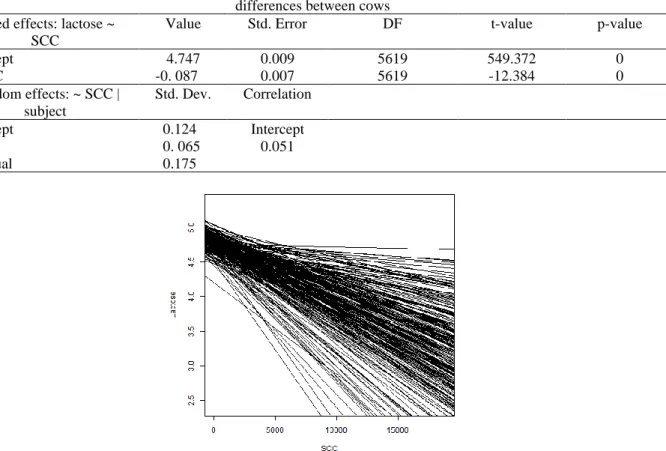
Table 3. Coefficients of the linear mixed model describing the relation between lactose and SCC, accounting for differences between cows
Fixed effects: lactose ~ SCC
Value Std. Error DF t-value p-value
Intercept 4.747 0.009 5619 549.372 0
SCC -0. 087 0.007 5619 -12.384 0
Random effects: ~ SCC | subject
Std. Dev. Correlation
Intercept 0.124 Intercept
SCC 0. 065 0.051
Residual 0.175
114
Figure 3. Individual regression lines estimated by the linear mixed model (for 10 arbitrarily selected animals)
115
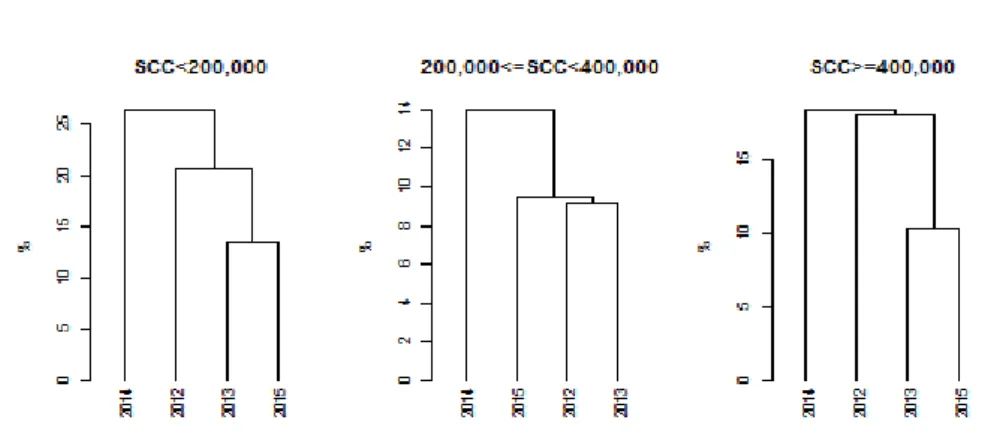
Figure 5. Results of agglomerative clustering applied to the 10-dimensional vectors containing the percentage of cases with SCC in the specified range
Only the animals for which there have been recorded values in 2012-2015 have been taken into account. In this way, data vectors containing 13 values per year have been constructed for 175 cows. Based on the dissimilarity values computed for these 52-dimensional data using the CORT measure (an adaptive dissimilarity measure for time series which quantifies both the difference on values and on the temporal correlation behaviour) provided in the TSclust R package [19], five clusters have been identified, as suggested by the intra-class variance illustrated in the first graph of (Figure 4) where a minimum is obtained for five clusters.
The five prototypes presented in the other graphs of (Figure 4) provide several evolution profiles which might be useful in identifying specific behaviours. For instance, the first and the third prototypes represent clusters where for most measurements the SCC level is either missing or larger than 2x10⁵, while the last prototype
corresponds to a cluster for which in most cases SCC is either missing or smaller than 2x10⁵.
The second approach aimed to analyse patterns of behaviour based on the percentage of cases when SCC is smaller than 2x10⁵, when it is between
2x10⁵ and 4x10⁵ and when it is larger than 4x10⁵.
The percentages have been computed using the values corresponding to 10 measurements in each year. By applying a single linkage agglomerative algorithm (based on the Euclidean distance), for 10-dimensional vectors corresponding to four years (2012-2015), the dendrograms illustrated in (Figure 5) have been obtained. Such dendrograms allow the identification of atypical cases, as is the case of values corresponding to 2014 year, which was consistently identified by clustering
algorithms as corresponding to a different behaviour. These results illustrate different types of information which can be extracted from data by applying clustering algorithms.
Studies conducted by other authors with respect to the relations between SCC and milk characteristics revealed a negative correlation between SSC and lactose. The authors of [20] found a negative correlation between SSC and milk yield and lactose. The results reported in [21] indicate that SCC was significantly correlated with a decrease in milk constituents only under conditions of average SCC in milk above 1x10⁶
cells/ml.
However, in the same study [21] correlations obtained between SCC and lactose were not significant in one farm comparing with another farm where the author found a negative correlation between SCC and total solids and also lactose contents. The lactose is a sensitive parameter in milk that reports disorders in secretory tissues and biosynthesis of this component is decreased due to infection of mammary gland [22].
In the present study, the overall results have shown that lactose and SCC were negatively correlated which confirms the statements of other authors.
4. Conclusions
116 the intensity and even the type of the relation. A high intra-class correlation coefficient indicates that appropriate measures must be taken to account for the lack of independence, and among these, the use of linear mixed models appears as most suitable. On the other hand, in the cluster analysis, if the dissimilarity measure is adequately chosen, then useful information on atypical behaviours or prototypes corresponding to clusters grouping common behaviours can be extracted from data which describe the evolution of SCC levels.
Acknowledgements
The research was carried out in the framework of the project “Bioeconomic approach to antimicrobial agents - use and resistance” financed by UEFISCDI by contract no. 7PCCDI / 2018, cod PN-III-P1-1.2-PCCDI-2017-0361.
References
1. Halasa, T., Huijps, K., Osteras, O., Hogeveen, H., Economic effects of bovine mastitis and mastitis management: A review, Vet Q, 2007, 29, 18–31 2. Malek dos Reis C. B., Barreiro, J. R., Mestieri, L., Porcionato, M. A., dos Santos M. V., Effect of somatic cell count and mastitis pathogens on milk composition in Gyr cows, BMC Vet Res, 2013, 9:67, 1-7
3. Cha, E., Bar, D., Hertl, J. A., Tauer, L. W., Bennett, G., González, R. N., Schukken, Y. H., Welcome, F. L., Gröhn, Y. T., The cost and management of different types of clinical mastitis in dairy cows estimated by dynamic programming, J Dairy Sci, 2011, 94, 9, 4476-4487
4. Bar, D., Tauer, L. W., Bennett, G., Gonzalez, R. N., Hertl, J. A., Schukken, Y. H., Schulte, H. F., Welcome, F. L., Grohn, Y. T., The Cost of Generic Clinical Mastitis in Dairy Cows as Estimated by Using Dynamic Programming, J Dairy Sci, 2008, 91, 6, 2205-2214
5. Adkins, P. R. F., Middleton, J. R., Methods for Diagnosing Mastitis, Veterinary Clinics of North America: Food Animal Practice, 2018, 34, 3, 479–491 6. Schukken, Y. H., Wilson, D. J., Welcome, F., Garrison-Tinofsky, L., Gonzales, R. N., Monitoring udder health and milk quality using somatic cell counts, Vet Res, 2003, 34, 579–596
7. Alhussien, M. N, Dang, A. K., Milk somatic cells, factors influencing their release, future prospects, and
practical utility in dairy animals: An overview, Vet World, 2018, 11, 5, 562-577
8. Sharma, N., Singh, N. K., Bhadwal, M. S., Relationship of Somatic Cell Count and Mastitis: An Overview, Asian-Aust. J. Anim. Sci, 2011, 24, 3, 429-438
9. International Dairy Federation, Recommendations for presenting of mastitis related data, IDF Bulletin 321, 1997, Brussels, Belgium
10. Ballou, L. U., Pasquini, M., Bremel, R. D., Everson, T., Sommer D., Factors affecting herd milk composition and milk plasmin at four levels of somatic cell counts, J Dairy Sci, 1995, 78, 2186–2195
11. Bland, J. M., Altman, D. G., Calculating correlation coefficients with repeated observations: part 1 - Correlation within subjects, BMJ, 1995, 310, 446 12. Bland, J. M., Altman, D. G., Calculating correlation coefficients with repeated observations: part 2 - Correlation between subjects, BMJ, 1995, 310, 633 13. Bakdash, J. Z., Marusich, L. R., Repeated Measures Correlation, Frontiers in Psychology, 2017, 8, Article 456, 1-13
14. Pinheiro, J. C., Bates, D. M., Mixed-Effects Models in S and S-PLUS, Springer, 2000
15. Raudenbush, S. W., Bryk, A. S., Hierarchical linear models, Applications and data analysis methods (2nd Ed.), Sage Publications, 2002
16. Bakdash, J. Z., Marusich, L. R., rmcorr: Repeated Measures Correlation, R package version 0.3.0, 2018, https://CRAN.R-project.org/package=rmcorr
17. Bliese, P., multilevel: Multilevel Functions, R package version 2.6, 2016, https://CRAN.R-project.org/package=multilevel
18. Flynt, A., Dean, N., A Survey of Popular R Packages for Cluster Analysis, Journal of Educational and Behavioral Statistics, 2016, 41, 2, 205-225
19. Mori, U., Mendiburu, A., Lozano J. A., Distance Measures for Time Series in R: the TSdist Package, The R Journal, 2016, 8, 2, 451-459
20. Cinar, M., Serbester, U., Ceyhan, A., Gorgulu, M., Effect of Somatic Cell Count on Milk Yield and Composition of First and Second Lactation Dairy Cows, Italian Journal of Animal Science, 2015, 14:1, 3646, 105-108
21. Fernandes A. M., Oliveira C. A. F., Tavolaro P., Relationship between somatic cell counts and composition of milk from individual Holstein cows. Arq. Inst. Biol. Sao Paulo, 2004, 71:163-166