Ancillary Trade Statistics
Ancillary Trade Statistics Division compiles and publishes regularly the Inland Trade Statistics inter alia ‘Inter-State Movements of Goods by Rail, River and Air’; ‘Statistics of the Inland Coasting Trade of India’; ‘Statistics of Foreign & Coastal Cargo movements of India’; ‘Statistics on India’s Customs and Excise Revenue Collections’ according to the tariff heads; ‘Selected Statistics of Foreign Trade of India’ and ‘Assessment Report on India’s Foreign Trade by Air’ every year.
Inter-State Movements/Flows of Goods by Rail, River and Air
The Division collects and compiles annual inland trade data received from different Railway Zones, CIWTC Kolkata, domestic airlines, etc. and brings out one of the oldest publications of DGCIS, the ‘Inter-state movements/flows of goods by Rail, River and Air’. In this publication, inter-state movements/flows of goods relating to 70 selected commodities are presented for the year. To present the inter-state movements/flows of goods more precisely, States and UTs have been divided into 37 different trade blocks, covering major portion of merchandise consigned by rail, sea ports, etc. To give emphasis to the coastal trade and movements of goods through water along with rail and air, each of the maritime states with ports is divided into two blocks each.
The Rail-borne trade statistics is represented in two different forms. The first is a 37 × 37 matrix representation of movements of goods between the trade blocks. Here individual commodity-wise matrix with quantity moved between the trade blocks is presented. Thus there are 70 such matrices, each for one commodity group. The second is the data presentation of state-wise/trade block wise inward and outward consignments of 70 commodity groups moved by rail.
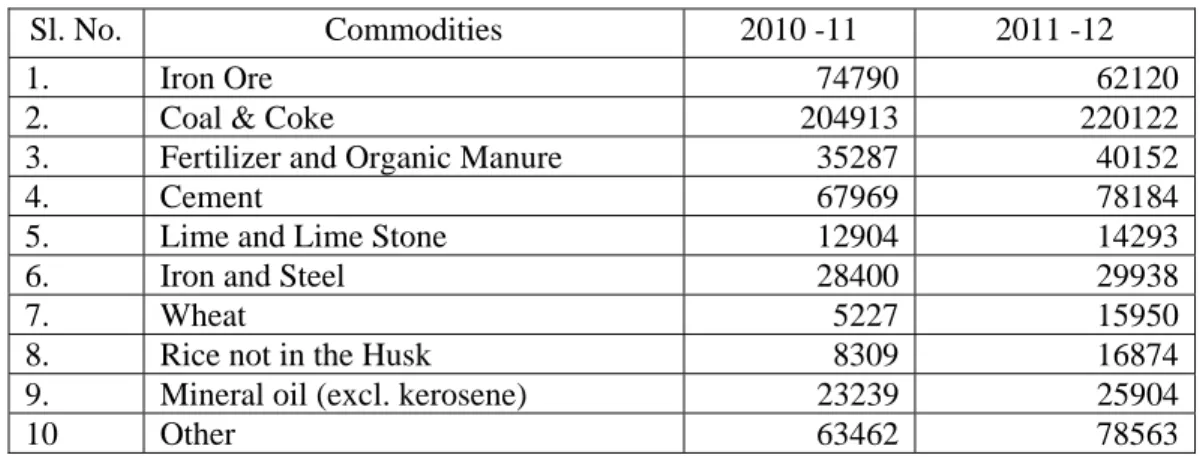
The publication also provides information on quantum of cargo lifted from one Airport to another within the country by the domestic Airlines, namely Air India, Jet Airways, Jet Lite, Kingfishers Airlines, Go Airlines, Blue Dart airlines and Indigo airlines. Interstate River-borne trade statistics is also presented for the commodities/commodity groups moved between the Trade Blocks connected by important river-ways. The latest publication on the subject relates to the period 2011-12. The total movement of 70 selected commodities by Rail stood at 5821 lakh tons during the year 2011-12 as compared to 5246 lakh Tons in the previous year, thus resulting in a noticeable increase of 10.96 % in 2011-12. Out of total movements of 5821 lakh Tons in 2011-12, the movements of three major commodities namely “Coal & Coke”, “Iron Ore” and “Cement” together were 3604 lakh Tons. The percentage shares of these commodity groups in total movements of goods by Rail were 37.81% for Coal and Coke, 13.43% for Cement and 10.67% for Iron Ore. Other important commodities transported in bulk through Rails were, Fertilizer & Organic manure (6.9%), Iron & Steel (5.14%), Mineral oil (excl. kerosene) (4.45%), Lime and Lime Stone(2.46%), Rice not in the Husk(2.90%), Wheat(2.74%) etc. Table 5.1 below provides the quantum of important commodities moved by Railways during 2010-11 & 2011-12.
Table 5.1: Quantum (in ‘000 ton) of commodities moved by Rail during 2010-11 & 2011-12 Sl. No. Commodities 2010 -11 2011 -12
1. Iron Ore 74790 62120 2. Coal & Coke 204913 220122 3. Fertilizer and Organic Manure 35287 40152 4. Cement 67969 78184 5. Lime and Lime Stone 12904 14293 6. Iron and Steel 28400 29938 7. Wheat 5227 15950 8. Rice not in the Husk 8309 16874 9. Mineral oil (excl. kerosene) 23239 25904 10 Other 63462 78563 Statistics of the Inland Coasting Trade Consignments of India
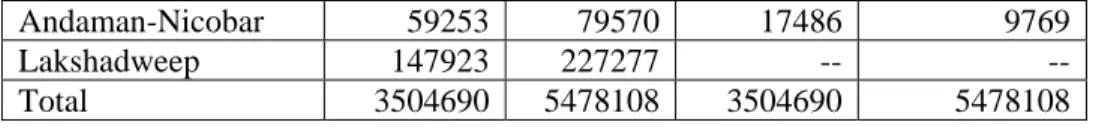
An annual publication named ‘Statistics of the Inland Coasting Trade Consignments of India’ is brought out based on the data on flow of goods (trade consignment of commodities) from one sea port to another sea port within the country. It is exclusive of foreign trade with other countries. The data is received from the Ports in the form of Import Coastal Trade Returns. The classification followed for recording coastal trade consists of around 450 major groups of items. For the purpose of compilation of Statistics of Inland Coasting Trade, the total Coastal area has been divided into 12 maritime blocks namely (1) Andaman and Nicobar Islands (2) Andhra Pradesh (3) Goa (4) Gujarat (5) Karnataka (6) Kerala (7) Lakshadweep, Minicoy and Amandine Islands (8) Maharashtra (9) Orissa (10) Pondicherry (11) Tamil Nadu and (12) West Bengal corresponding to 12 maritime States of India. The information on Inland Coasting Trade is given in three ways – (i) the inter-block movements of Inland Coasting Trade in terms of value (ii) the total quantities and values by commodities and (iii) by individual maritime blocks for inward, outward and internal trade by commodities and of origin or destination. At present 2010-11 data series have been released. During the year 2010-11 the total value of Inland Coastal Trade of India stood at Rs. 54781 crores as compared to Rs. 35047 crores during the year 2009-10 showing a highly positive growth of 56%. The Inter-state (Maritime) Movements of the Inland Coasting Trade consignments of India during 2009-10 and 2010-11 are shown in Table 5.2.
Table 5.2: Statement showing Inter-state (Maritime) movements of the Inland Coasting Trade consignments (in terms of value) of India
Value in Rs. lakhs
State Inward Outward 2009-10 2010-11 2009-10 2010-11 West Bengal 11662 1220930 215700 335368 Andhra Pradesh 1246271 1959790 155326 496354 Tamil Nadu 253968 588531 76992 243787 Kerala 174313 43662 222461 442575 Karnataka 733089 651538 243338 279694 Goa 79059 -- 20257 5116 Maharashtra 249217 240907 1029839 2114828 Gujarat -- 9540 1381407 1197646 Orissa 549935 456363 141448 342042 Pondicherry -- -- 436 10929
Andaman-Nicobar 59253 79570 17486 9769 Lakshadweep 147923 227277 -- --
Total 3504690 5478108 3504690 5478108
Statistics of Foreign and Coastal Cargo Movements of India
The annual publication ‘Statistics of Foreign and Coastal Cargo Movements of India’ is based on the compilation of data on shipping in foreign and coastal trade of India relating to the entry and clearance of ships with cargo or in ballast at different sea ports and customs zones and the number and tonnage of vessels built and registered at different ports in India during a financial year. The primary sources of the data on cargo movements as well as shipping are the authorities at the customs zone in India namely Kolkata, Chennai, Cochin, Ahmedabad, Mumbai and Goa. In case of foreign coastal cargo, the data is compiled on the basis of returns received from the customs authorities of 12 maritime blocks.
The information on cargo movements and shipping in Foreign and Coastal Trade of India, relating to the entry and clearance of ships nationality-wise with cargo or in ballast at different ports and custom zones and the number and tonnage of vessels built and registered at different ports in India during 2009-10 are presented in 12 tables. During the year 2009-10, 7914 vessels (including the cases of repeated voyages) entered with cargoes with NRT as 96027555 Ton and 3958 vessels cleared with cargoes with NRT as 35419635 Ton. Table 5.3 shows the cargo movements in foreign trade of India during 2009-10.
Table 5.3: Cargo movements in foreign trade of India during 2009-10
Custom Zones Foreign Trade
Entered with cargo Cleared with cargo
No. NRT No. NRT
Ahmedabad 1508 16518476 450 3179126
Chennai 2404 29028370 2102 19513643
Cochin 97 642910 77 526618
Goa Not reported
Kolkata 706 6463477 741 7475997
Mumbai 3199 43374322 588 4724251
Total 7914 96027555 3958 35419635
Selected Statistics of the Foreign Trade of India
The information contained in the annual publication called “Selected Statistics of the Foreign Trade of India” relates to certain important aspects of the foreign trade of India such as (i) data on India’s Foreign Trade in treasure including currency notes, (ii) India’s Foreign Trade in merchandise and Treasure according to Customs Zones, (iii) data on export (principal commodity-wise) through Foreign Post Offices (FPO), (iv) data on leftover stock in bonded warehouses at the closing of the financial year – Custom Zone-wise, (v) the Unit value indices of Foreign Trade of India, etc.
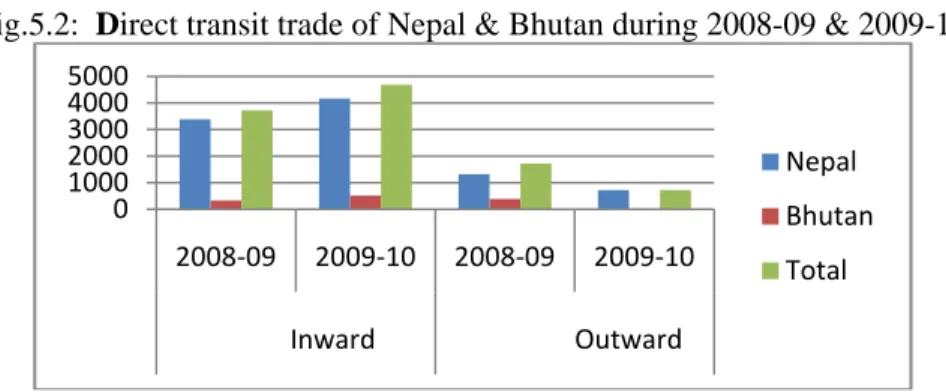
The direct transit trade of neighboring land-locked countries namely Nepal and Bhutan, passing through India is also included in this publication and is presented by the country of consignment/destination in case of imports/exports.
The Inward Direct Transit Trade of Nepal and Bhutan in 2009-10 together stood at around Rs 4687 crores as against Rs. 3726 crores recorded in 2008-09 showing increase of about 26% in 2009-10. The Outward Transit Trade during the year 2009-10 stood at around Rs. 721 crores as against Rs.1716 crores in 2008-09 recording a noticeable fall of 58% in 202008-09-10. The Balance of Transit Trade for the year 202008-09-10 is negative and stands at Rs. 3966 crores.
Fig.5.2: Direct transit trade of Nepal & Bhutan during 2008-09 & 2009-10
Table 5.4: Statement showing direct transit trade of neighbouring countries passing through India during 2008-09 & 2009-10 (value in Rs. crores)
Assessment Report in respect of India’s Foreign Trade by Air
Assessment Report is an analytical report on airport-wise export/import performance showing the trends in the share of Air-borne Trade etc. In this report, an analysis is made to highlight the changing pattern of airborne export trade in relation to import trade by air through the construction of an index termed as export performance index. Besides, an account of the relative importance of the airports in India’s international trade is also presented in this report. Further, principal commodity wise exports and imports through different airports and vice-versa are also given separately in the report. Table 5.5 shows values and percentage shares of Foreign Trade by air of major airports during 2009-10.
Table 5.5: Share of major Airports in Foreign Trade of India during 2009-2010
Value in Rs. crores Port Export Import Total Trade
value % share value % share value % share Sahar(S.Cruz) 9467928 55.24 8453481 28.52 17921409 38.31 I.G.I (Palam) 3510883 20.48 5203263 17.55 8714146 18.63 Meenambakam (St.Th.Mt) 1187329 6.93 5043447 17.02 6230776 13.32 Bangalore 1186819 6.92 3111409 10.50 4298228 9.19 Dum-Dum 409442 2.39 1724629 5.82 2134071 4.56 Cochin Airport 100089 0.58 45959 0.16 146048 0.32 Ahmedabad 184262 1.08 3574819 12.06 3759081 8.04 Hyderabad 846995 4.94 2135475 7.20 2982470 6.36 Other Airports 246507 1.44 348207 1.17 594714 1.27 TOTAL 17140254 100 29640689 100 46780943 100 0 1000 2000 3000 4000 5000 2008‐09 2009‐10 2008‐09 2009‐10 Inward Outward Nepal Bhutan Total Inward Outward Countries 2008-09 2009-10 2008-09 2009-10 Nepal 3392 4169 1327 717 Bhutan 334 518 389 4 Total 3726 4687 1716 721
Fig.5.3: S Statistics The annu Union” in by sea, air salt cess ( the month the office from offic Data Man Net reven F Share of Majo of the custom al publication ncludes data o r & land, (ii) (iii) Customs hly returns re e of the Coal ce of the Salt nagement, Cen nue collection Table ig.5.4: Net C or Airports in ms & excise n entitled “St on (i) Custom Union Excis revenue coll eceived from Controller, K t Commission ntral Excise & s from Custo 5.6: Net Cust Customs and E dur Year N 2007-08 2008-09 2009-10 2010-11 2011-12 n Air-Borne F revenue coll tatistics of the ms Revenue C se Revenue co ections from 102 Customs Kolkata; rubb ner, Jaipur. D & Customs, N oms and Exci
toms and Exc of the India Excise Reven ring 2007-08 Net Customs oreign Trade ections of the e Customs an Collections du ollections from exports detai s; 101 Centra ber cess from DGCIS collec New Delhi. T se over the pe cise Revenue an Union duri nue collection to 2011-12 s Revenue N 104145 100072 84288 136817 149876 of India durin e Indian unio nd Excise Rev uties (Import, m Central Ex ils by sea, air al Excise Com m the Rubber cts the revenu Table 5.6 prov eriods 2007-0 collections (v ing 2007- 08 t s (Rs. in crore Net Excise R 1 1 1 1 1 ng 2009-2010 on: venue Collec Export, Cess xcise, coal ces
r & land. The mmissionerat Board, Kotty ue data from vides the com 08 to 2011-12 value in Rs. cr
to 2011-12
es) of the Ind Revenue 130168 113360 109735 143027 149364 0 tions of the I s and other re ss, rubber ces e data are bas tes; coal cess yam; and salt
the Directora mparative figu 2. rores) dian Union Indian ceipt) ss and sed on from t cess ate of ures of
Index numbers of foreign trade of India
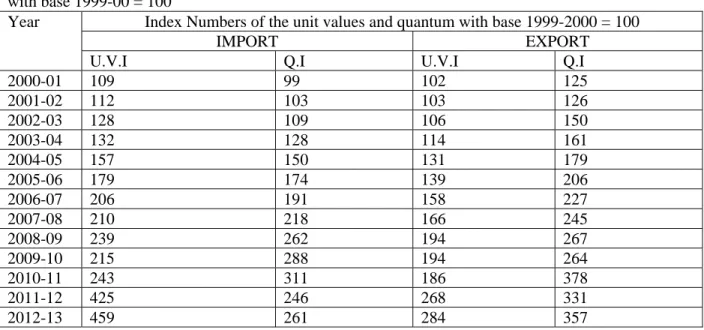
New series of index numbers based on 1999-2000 base year have been published for the years 2000-01 to 2012-13 at bilateral country level, Economic Region level and at Broad Economic Category version 3 (BEC3) level. New series of Monthly/Quarterly index numbers are published for the same levels from April 2008. The indices with base 1999-2000 are as follows.
Table 5.7: Index Numbers of the unit values and quantum of Exports and Imports from 2000-01 onwards with base 1999-00 = 100
Year Index Numbers of the unit values and quantum with base 1999-2000 = 100
IMPORT EXPORT U.V.I Q.I U.V.I Q.I
2000-01 109 99 102 125 2001-02 112 103 103 126 2002-03 128 109 106 150 2003-04 132 128 114 161 2004-05 157 150 131 179 2005-06 179 174 139 206 2006-07 206 191 158 227 2007-08 210 218 166 245 2008-09 239 262 194 267 2009-10 215 288 194 264 2010-11 243 311 186 378 2011-12 425 246 268 331 2012-13 459 261 284 357