Future global mortality from changes in air
pollution attributable to climate change
Article
Accepted Version
Silva, R. A., West, J. J., Lamarque, J.F., Shindell, D. T.,
Collins, W. J., Faluvegi, G., Folberth, G. A., Horowitz, L. W.,
Nagashima, T., Naik, V., Rumbold, S. T., Sudo, K., Takemura,
T., Bergman, D., CameronSmith, P., Doherty, R. M., Josse,
B., MacKenzie, I. A., Stevenson, D. S. and Zeng, G. (2017)
Future global mortality from changes in air pollution
attributable to climate change. Nature Climate Change, 7 (9).
pp. 647651. ISSN 1758678X doi:
https://doi.org/10.1038/nclimate3354 Available at
http://centaur.reading.ac.uk/71591/
It is advisable to refer to the publisher’s version if you intend to cite from the work. See Guidance on citing .
To link to this article DOI: http://dx.doi.org/10.1038/nclimate3354
Publisher: Nature Publishing Group
www.reading.ac.uk/centaur
CentAUR
FUTURE GLOBAL MORTALITY FROM CHANGES IN AIR POLLUTION
1
ATTRIBUTABLE TO CLIMATE CHANGE
2
Raquel A. Silva1,2, J. Jason West1,*, Jean-François Lamarque3, Drew T. Shindell4,
3
William J. Collins5, Greg Faluvegi6, Gerd A. Folberth7, Larry W. Horowitz8, Tatsuya
4
Nagashima9, Vaishali Naik10, Steven T. Rumbold11, Kengo Sudo12, Toshihiko
5
Takemura13, Daniel Bergmann14, Philip Cameron-Smith14, Ruth M. Doherty15,
6
Beatrice Josse16, Ian A. MacKenzie15, David S. Stevenson15, and Guang Zeng17
7 8
1
Environmental Sciences and Engineering, University of North Carolina, Chapel Hill,
9
North Carolina
10
2
Now: Oak Ridge Institute for Science and Education at US Environmental Protection
11
Agency, Research Triangle Park, North Carolina
12
3
NCAR Earth System Laboratory, National Center for Atmospheric Research, Boulder,
13
Colorado
14
4
Nicholas School of the Environment, Duke University, Durham, North Carolina
15
5
Department of Meteorology, University of Reading, Reading, United Kingdom
16
6
NASA Goddard Institute for Space Studies and Columbia Earth Institute, New York,
17
New York
18
7
Met Office Hadley Centre for Climate Prediction, Exeter, United Kingdom
19
8
NOAA Geophysical Fluid Dynamics Laboratory, Princeton, New Jersey
20
9
National Institute for Environmental Studies, Tsukuba, Japan
21
10
UCAR/NOAA Geophysical Fluid Dynamics Laboratory, Princeton, New Jersey
22
11
National Centre for Atmospheric Science, University of Reading, Reading, United
23
Kingdom
24
12
Earth and Environmental Science, Graduate School of Environmental Studies,
25
Nagoya University, Nagoya, Japan
26
13
Research Institute for Applied Mechanics, Kyushu University, Fukuoka, Japan
27
14
Lawrence Livermore National Laboratory, Livermore, California
28
15
School of GeoSciences, University of Edinburgh, Edinburgh, United Kingdom
29
16
GAME/CNRM, Meteo-France, CNRS—Centre National de Recherches
30
Meteorologiques, Toulouse, France
31
17
National Institute of Water and Atmospheric Research, Wellington, New Zealand
32 33 34
Correspondence should be addressed to: J. J. West ([email protected]) 35
36
37
38
Ground-level ozone and fine particulate matter (PM2.5)are associated with premature human
40
mortality1-4; their future concentrations depend on changes in emissions, which dominate the 41
near-term5, and on climate change6,7. Previous global studies of the air quality-related health 42
effects of future climate change8,9 used single atmospheric models. However, in related studies, 43
mortality results differ among models10-12. Here we use an ensemble of global chemistry-climate 44
models13 to show that premature mortality from changes in air pollution attributable to climate 45
change, under the high greenhouse gas scenario RCP8.514, is likely positive. We estimate 3,340 46
(-30,300 to 47,100) ozone-related deaths in 2030, relative to 2000 climate, and 43,600 (-195,000 47
to 237,000) in 2100 (14% of the increase in global ozone-related mortality). For PM2.5, we
48
estimate 55,600 (-34,300 to 164,000) deaths in 2030 and 215,000 (-76,100 to 595,000) in 2100 49
(countering by 16% the global decrease in PM2.5-related mortality). Premature mortality
50
attributable to climate change is estimated to be positive in all regions except Africa, and is 51
greatest in India and East Asia. Most individual models yield increased mortality from climate 52
change, but some yield decreases, suggesting caution in interpreting results from a single model. 53
Climate change mitigation will likely reduce air pollution-related mortality. 54
Climate change can affect air quality through several pathways, including changes in the 55
ventilation and dilution of air pollutants, photochemical reaction rates, removal processes, 56
stratosphere−troposphere exchange of ozone, wildfires, and natural biogenic and lightning 57
emissions6,7. Overall, changes in these processes are expected to increase ozone in polluted 58
regions during the warm season, especially in urban areas and during pollution episodes, but 59
decrease ozone in remote regions due to greater water vapour concentrations leading to greater 60
ozone destruction. These effects are exacerbated by the greater decomposition of reservoir 61
species such as PAN7. PM2.5 will also be affected by climate change, but impacts vary in sign
among models and show regional variation related to differences in precipitation, wildfires, 63
biogenic emissions, PM2.5 composition, and other factors.
64
Previous studies have examined the impact of future climate change on human health via air 65
quality globally8-9,15, in the US10, 16-20,and in Europe21. However, only two studies have
66
previously used an ensemble of models to assess air pollution-related mortality attributable to 67
climate change: one for the US10, and our previous global work with the same ensemble used 68
here, but evaluating the effects of historical climate change prior to 200011. Both studies found a 69
large spread of mortality outcomes depending on the atmospheric model used. Silva et al. 11 70
found that the multi-model average suggested a small detrimental effect of climate change on 71
global present-day air pollution-related mortality, but individual models yielded estimates of 72
opposing sign. 73
The Atmospheric Chemistry and Climate Model Intercomparison Project (ACCMIP) ensemble 74
(Supplementary Table 1) simulated air quality in 2000, and in 2030, 2050 and 2100 for the four 75
global Representative Concentration Pathway scenarios (RCPs)22. We previously estimated 76
future air pollution premature mortality under all four RCP scenarios, estimating the net effect of 77
both emissions changes and climate change12. Under RCP8.5, ozone concentrations increase in
78
most locations in 2100 relative to 2000, due to increases in methane emissions and the effect of 79
climate change7,23, but PM2.5 decreases in 2100 due to a projected decrease in particulate and
80
precursor emissions24. These changes in pollutant concentrations lead to 316,000 (95% C.I.: -81
187,000 to 1.38 million) ozone-related excess deaths yr-1 and -1.31 (-2.04 to -0.17) million 82
PM2.5-related (avoided) deaths yr-1 in 210012. Here we present results from additional ACCMIP
83
simulations that were designed to isolate the influences of future climate change under RCP8.5, 84
temperatures, sea ice cover, and greenhouse gas concentrations for radiation) together with air 86
pollutant emissions from 2000. The effects of climate change are then isolated by a difference 87
with historical 2000 simulations. Premature mortality attributable to RCP8.5 climate change is 88
estimated following the methods of Silva et al.12, including projected population and baseline 89
mortality rates (see Methods), such that mortality estimates here can be compared directly with 90
overall changes in air pollution-related mortality in RCP8.5. 91
We estimate that global ozone mortality attributable to RCP8.5 climate change will be 3,340 (-92
30,300 to 47,100) deaths yr-1 in 2030 and 43,600 (-195,000 to 237,000) deaths yr-1 in 2100 93
(Figures 1a and 2a). In 2100, ozone mortality increases in most regions, especially in highly 94
populated and highly polluted areas, with marked spatial differences within regions that include 95
both positive and negative mortality changes (Figure 3a, Supplementary Table 2, Supplementary 96
Figures 1 and 2a). The effect on ozone mortality in 2100 is greatest in East Asia (45,600 deaths 97
yr-1, 41 deaths yr-1 per million people), India (16,000 deaths yr-1, 8 deaths yr-1 per million people) 98
and North America (9,830 deaths yr-1, 13 deaths yr-1 per million people), but some areas within 99
these and other regions show decreases in mortality. East Asia has high mortality effects per 100
person in part because of its higher projected mortality rate from respiratory diseases. Climate 101
change contributes 14% of the overall increase in ozone mortality estimated for RCP8.5 in 2100 102
relative to 200012. However, three of 8 models in 2030 and three of 9 in 2100 show global 103
decreases in ozone mortality due to climate change. For each model, the uncertainty range does 104
not include zero; only the spread of models causes the overall uncertainty to span zero. 105
Uncertainty in modeled ozone concentrations contributes over 97% to the overall uncertainty in 106
both 2030 and 2100, with the remainder from uncertainties in relative risk (RR). Results from a 107
32% and 67% lower mortality estimates in 2030 and 2100, respectively, largely because the 109
projected baseline mortality rates of chronic respiratory diseases increase through 2100. The 110
models agree that ozone will increase due to climate change in some polluted regions, notably 111
the northeast US as found in other studies6 and decrease in the tropics over the oceans 112
(Supplementary Figures 3 and 4a). These changes are consistent with those analysed by Schnell 113
et al.25 for 2100, using four of these same models, and were attributed to a greater efficiency of 114
precursor emissions to generate surface ozone in polluted regions, along with reductions in the 115
export of precursors to downwind regions. 116
The impact of climate change on PM2.5 mortality is estimated to result in 55,600 (-34,300 to
117
164,000) deaths yr-1 in 2030 and 215,000 (-76,100 to 595,000) deaths yr-1 in 2100 (Figures 1b 118
and 2b). Mean estimates of PM2.5 mortality increase in 2100 in all regions except Africa (-25,200
119
deaths yr-1) (Figure 3b, Supplementary Table 3, Supplementary Figure 2b). The greatest 120
increases in mortality in 2100 occur in India (80,200 deaths yr-1, 40 deaths yr-1 per million 121
people), Middle East (50,400 deaths yr-1, 45 deaths yr-1 per million people) and East Asia 122
(47,200 deaths yr-1, 43 deaths yr-1 per million people), although the Former Soviet Union shows 123
greater mortality per million people in 2100 (11,800 deaths yr-1, 57 deaths yr-1 per million
124
people). Similar to ozone mortality, there are substantial spatial differences within each region, 125
including both increases and decreases in mortality. For PM2.5, a large decrease in mortality is
126
projected in RCP8.5 relative to 2000 (when accounting for changes in both emissions and 127
climate)12, but climate change alone increases mortality, partially counteracting the decrease 128
associated with declining emissions in RCP8.5. Without climate change, the decrease in PM2.5
-129
related mortality would be roughly 16% greater in 2100 relative to 2000. Propagating 130
(2030) and 11-46% (2100) for the different models, but the spread of model results increases 132
overall CVs to 123% in 2030 and 106% in 2100. In both years, one model (GISS-E2-R) yields a 133
decrease in global mortality from climate change while the other three (2030) or four (2100) 134
show an increase. Uncertainty in modeled PM2.5 concentrations in 2000 makes a similar
135
contribution to the overall uncertainty (50% in 2030 and 52% in 2100) compared with 136
uncertainty in modeled PM2.5 concentrations in future years (50% in 2030, 48% in 2100).
137
Uncertainty in RR makes a negligible contribution in both periods (<1%), as the multi-model 138
mean is small and different models disagree on the sign of the influence. Considering present-139
day population and baseline mortality rates (Table 1), we estimate 23% and 33% lower mortality 140
in 2030 and 2100, respectively, mostly associated with the increase in projected baseline 141
mortality rates through 2100. 142
PM2.5-related mortality was estimated above for the sum of PM2.5 species reported by five
143
models, using a common formula (see Methods), to increase the number of models considered 144
and to increase consistency among PM2.5 estimates. Additionally, we present a sensitivity
145
analysis considering the PM2.5 concentrations reported by four models using their own PM2.5
146
formulas, for which multi-model average mortality results are modestly higher: 15% greater in 147
2030 and 12% in 2100 (Supplementary Figure 5). The degree of agreement between the two 148
estimates varies among the four models, and for one model (GISS-E2-R) the two sources of 149
PM2.5 estimates yield impacts of different sign in 2030.
150
There is considerable agreement among models regarding the increase in PM2.5 concentrations in
151
many locations in 2100, including most polluted regions, due to RCP8.5 climate change 152
(Supplementary Figure 4b). Allen et al.26 analysed four of these same models in 2100 and found 153
that global average surface PM2.5 concentrations increased due to climate change, reflecting
increases in nearly all relevant species for each model. They attributed this increase in PM2.5
155
mainly to a decrease in wet deposition associated with less large-scale precipitation over land. 156
Our multi-model mean estimates of global population-weighted changes for PM2.5 and individual
157
species (Supplementary Table 4; Supplementary Figure 6) are similar to those of Allen et al.26. 158
Unlike Allen et al.26, however, GISS-E2-R shows a net decrease in global population-weighted 159
concentrations of total PM2.5 and of each PM2.5 species except sea salt, in 2100, likely due to
160
projected concentration decreases over densely-populated eastern China. Models also differ 161
strongly in the sign and magnitude of changes in dust, particularly over North Africa and the 162
Middle East; HadGEM2 projects increases in PM2.5 for all species except dust, but a strong
163
decrease in dust over the Middle East and South Asia. In Africa, the decrease in PM2.5 near the
164
equator is likely caused by increased precipitation, whereas PM2.5 increases are associated with
165
precipitation decreases in Southern Africa26. Differences in PM2.5 (and ozone) responses to
166
climate change among models likely result from differences in large-scale meteorological 167
changes, and different treatments of atmospheric chemistry and feedback processes among the 168
models (such as the response of dust to climate change). 169
In the US, our multi-model mean mortality estimates for the impact of RCP8.5 climate change 170
for ozone (1,130 deaths yr-1 in 2030; 8,810 deaths yr-1 in 2100) compare well with those of Fann 171
et al.20, who report 420 to 1900 ozone-related deaths yr-1 for RCP8.5 climate change in 2030, 172
despite differences in concentration-response functions and population and baseline mortality 173
projections. These results for ozone and those for PM2.5 (6,900 deaths yr-1 in 2030; 19,400 deaths
174
yr-1in 2100) are also consistent with the increases in mortality and spatial heterogeneity
175
attributed to climate change in 2050 by Bell et al.16 for ozone and Tagaris et al.17 for ozone and 176
PM2.5, although these studies used different climate change scenarios besides other
methodological differences. Across models, our estimates for ozone mortality in the US vary 178
between -435 and 4,750 deaths yr-1 in 2030 and between -1,820 and 27,012 deaths yr-1 in 2100. 179
This spread of model results, with a few models suggesting avoided mortality due to climate 180
change, is similar to that of Post et al.10 (-600 to 2,500 deaths yr-1 in 2050) using SRES scenarios 181
of GHG emissions. Similarly, results show spatial heterogeneity within several regions (Figure 182
2) that is similar to Post et al.10 for the US and Orru et al.21 for Europe. 183
The spread of results among models highlights the uncertainty in the effect of climate change on 184
air quality. Further improvements in chemistry climate models are needed to better model the 185
interaction and feedbacks between climate and air quality, including the sensitivity of biogenic 186
emissions to climate change, the effects of meteorological changes on air quality (e.g., aerosol-187
cloud interactions, secondary aerosol formation, wet deposition, and gas-aerosol partitioning), 188
and the impact of climate change on wildfires. Stratosphere-troposphere exchange of ozone is 189
also important, as is the impact of land use changes on regional climate and air pollution. Our 190
results are specific to climate change as projected under RCP8.5 and would differ for other 191
scenarios. We estimate the effect of climate change as the difference between simulations with 192
future climate and year 2000 climate, both with year 2000 emissions, although global emissions 193
of PM2.5 and its main precursors decrease under RCP8.5. Had we instead modelled future
194
emissions with present vs. future climate, we would likely have attributed smaller changes in air 195
pollution and mortality to climate change, given the projected emission reductions. Whereas the 196
net effect of missing and uncertain processes does not clearly indicate an under- or overestimate 197
for the effect of climate change on air quality, we likely underestimate the magnitude of the 198
health impact by omitting mortality for people under 25, and morbidity effects. We also neglect 199
Although a few studies have suggested stronger relationships between ozone27 and PM2.528 and
201
health at higher temperatures, there is insufficient evidence to include those effects here. 202
Despite these uncertainties, this study is the first to use a multi-model ensemble to show that 203
global air pollution-related mortality attributable to climate change is likely positive. The spread 204
of results among models within the ensemble, including differences in the sign of global and 205
regional mortality estimates, suggests that results from studies using a single model and a small 206
number of model years should be interpreted cautiously. Actions to mitigate climate change, 207
such as reductions in long-lived GHG emissions, will likely benefit human health by reducing 208
the effect of climate change on air quality in many locations. These health benefits are likely to 209
be smaller than those from reducing co-emitted air pollutants29, but both types of health benefits 210
via changes in air quality would add to reductions in many other influences of climate change on 211
human health30. 212
213
Additional information
214
Supplementary information is available in the online version of the paper. 215
References
216
1. Jerrett, M. et al. Long-Term Ozone Exposure and Mortality. N. Engl. J. Med.360, 1085– 217
1095 (2009). 218
2. Krewski, D. et al. Extended Follow-Up and Spatial Analysis of the American Cancer
219
Society Study Linking Particulate Air Pollution and Mortality. Respir. Rep. Heal. Eff.
220
Inst.140, 5–114 (2009). 221
3. Lepeule, J., Laden, F., Dockery, D. & Schwartz, J. Chronic Exposure to Fine Particles 222
and Mortality: An Extended Follow-up of the Harvard Six Cities Study from 1974 to 223
4. Burnett, R. T. et al. An Integrated Risk Function for Estimating the Global Burden of
225
Disease Attributable to Ambient Fine Particulate Matter Exposure. Environ. Health
226
Perspect.122, 397–403 (2014). 227
5. Kirtman, B. et al. Near-term Climate Change: Projections and Predictability. In: Climate
228
Change 2013: The Physical Science Basis (Chapter 11). Contribution of Working Group
229
I to the Fifth Assessment Report of the Intergovernmental Panel on Climate Change 230
[Stocker, T.F.et al. (eds.)]. Cambridge University Press, Cambridge, United Kingdom
231
and New York, NY, USA (2013). 232
6. Fiore, A. M., Naik, V. & Leibensperger, E. M. Air Quality and Climate Connections. J
233
Air Waste Manage. Assoc.65, 645–685 (2015). 234
7. von Schneidemesser, E. et al. Chemistry and the Linkages between Air Quality and
235
Climate Change. Chem. Rev. 150430065937004 (2015).
236
doi:10.1021/acs.chemrev.5b00089 237
8. West, J. J., Szopa, S. & Hauglustaine, D. A. Human mortality effects of future 238
concentrations of tropospheric ozone. C. R. Geosci.339, 775-83, 2007. 239
9. Selin, N. E. et al. Global health and economic impacts of future ozone pollution. Environ.
240
Res. Lett.4, 044014 (2009). 241
10. Post, E. S. et al. Variation in Estimated Ozone-Related Health Impacts of Climate
242
Change due to Modeling Choices and Assumptions. Environ. Health Perspect.120, 243
1559–1564 (2012). 244
11. Silva, R. A. et al. Global premature mortality due to anthropogenic outdoor air pollution
245
and the contribution of past climate change. Environ. Res. Lett.8, 034005 (2013). 246
12. Silva, R. A. et al. The effect of future ambient air pollution on human premature
247
mortality to 2100 using output from the ACCMIP model ensemble. Atmos. Chem. Phys.
248
16, 9847-9862 (2016). 249
13. Lamarque, J. F. et al. The Atmospheric Chemistry and Climate Model Intercomparison
250
Project (ACCMIP): Overview and description of models, simulations and climate 251
diagnostics. Geosci. Model Dev.6, 179–206 (2013). 252
14. Stevenson, D. S. et al. Tropospheric ozone changes, radiative forcing and attribution to
253
emissions in the Atmospheric Chemistry and Climate Model Intercomparison Project 254
(ACCMIP). Atmos. Chem. Phys.13, 3063–3085 (2013). 255
15. Fang, Y., Mauzerall, D. L., Liu, J., Fiore, A. M. & Horowitz, L. W. Impacts of 21st 256
century climate change on global air pollution-related premature mortality. Clim. Change
257
121(2), 239–253 (2013) 258
16. Bell, M. L. et al. Climate change, ambient ozone, and health in 50 US cities. Clim.
259
Change82, 61–76 (2007). 260
17. Tagaris, E. et al. Potential Impact of Climate Change on Air Pollution-Related Human
261
Health Effects. Environ. Sci. Technol.43, 4979–4988 (2009). 262
18. Chang, H. H., Zhou, J. & Fuentes, M. Impact of Climate Change on Ambient Ozone 263
Level and Mortality in Southeastern United States. Int. J. Environ. Res. Public Health7, 264
2866–2880 (2010). 265
19. Sheffield, P. E., Knowlton, K., Carr, J. L. & Kinney, P. L. Modeling of Regional Climate 266
Change Effects on Ground-Level Ozone and Childhood Asthma. Am. J. Prev. Med.41, 267
20. Fann, N. et al. The geographic distribution and economic value of climate change-related
269
ozone health impacts in the United States in 2030. J. Air Waste Manage. Assoc.65, 570– 270
580 (2015). 271
21. Orru, H. et al. Impact of climate change on ozone-related mortality and morbidity in
272
Europe. Eur. Respir. J.41, 285–294 (2013). 273
22. van Vuuren, D. P. et al. The representative concentration pathways: an overview. Clim.
274
Change109, 5–31 (2011). 275
23. Young, P. J. et al. Pre-industrial to end 21st century projections of tropospheric ozone
276
from the Atmospheric Chemistry and Climate Model Intercomparison Project 277
(ACCMIP). Atmos. Chem. Phys.13, 2063–2090 (2013). 278
24. Shindell, D. T. et al. Radiative forcing in the ACCMIP historical and future climate
279
simulations. Atmos. Chem. Phys.13, 2939–2974 (2013). 280
25. Schnell, J. L. et al. Effect of climate change on surface ozone over North America,
281
Europe, and East Asia. Geophys. Res. Lett., 43, 3509–3518 (2016). 282
26. Allen, R.J., Landuyt, W. & Rumbold, T. An increase in aerosol burden and radiative 283
effects in a warmer world. Nat. Clim. Change 6, 269-274 (2016). 284
27. Wilson, A., Rappold, A. G., Neas, L. M. & Reich, B. J. Modeling the effect of 285
temperature on ozone-related mortality. Ann. Appl. Stat.8, 1728–1749 (2014). 286
28. Ren, C., Williams, G. M. & Tong, S. Does Particulate Matter Modify the Association 287
between Temperature and Cardiorespiratory Diseases?. Environ. Health Perspect.114, 288
1690–1696 (2006). 289
29. West, J. J. et al. Co-benefits of Global Greenhouse Gas Mitigation for Future Air Quality
290
and Human Health. Nat. Clim. Change3, 885–889 (2013). 291
30. Smith, K.R. et al. Human health: impacts, adaptation, and co-benefits. In: Climate
292
Change 2014: Impacts, Adaptation, and Vulnerability. Part A: Global and Sectoral
293
Aspects. Contribution of Working Group II to the Fifth Assessment Report of the
294
Intergovernmental Panel on Climate Change [Field, C.B. et al. (eds.)], pp. 709-754
295 (2014). 296 297 298 Acknowledgements 299
This research was funded by NIEHS grant #1 R21 ES022600-01, a fellowship from the 300
Portuguese Foundation for Science and Technology, and by a Dissertation Completion 301
Fellowship from The Graduate School (UNC – Chapel Hill). We thank Karin Yeatts (Gillings 302
School of Global Public Health, UNC – Chapel Hill), Colin Mathers (WHO), Peter Speyer 303
(IHME), and Amanda Henley (Davis Library Research & Instructional Services, UNC – Chapel 304
Hill). The work of DB and PC was funded by the U.S. Dept. of Energy (BER), performed under 305
resources of NERSC under contract No. DE-AC02-05CH11231. RD, IM and DS acknowledge 307
ARCHER supercomputing resources and funding under the UK Natural Environment Research 308
Council grant: NE/I008063/1. GZ acknowledges the NZ eScience Infrastructure which is funded 309
jointly by NeSI’s collaborator institutions and through the MBIE’s Research Infrastructure 310
programme. GAF has received funding from BEIS under the Hadley Centre Climate Programme 311
contract (GA01101) and from the European Union’s Horizon 2020 research and innovation 312
programme under grant agreement No 641816 (CRESCENDO). DTS and GF acknowledge the 313
NASA High-End Computing Program through the NASA Center for Climate Simulation at 314
Goddard Space Flight Center for computational resources. 315
316
Author contributions: JJW, JFL, DTS and RAS conceived the study. All other co-authors 317
conducted the model simulations. RAS processed model output and estimated human mortality. 318
RAS and JJW analyzed results. RAS and JJW prepared the manuscript and all co-authors 319
commented on it. 320
Competing Financial Interests: All authors declare that they do not have any competing 321
financial interests. 322
323
Figure Legends: 325
Figure 1 – Impact of RCP8.5 climate change on global mortality for individual models and the 326
multi-model average. Estimates are for 2030 and 2100 for (a) ozone respiratory mortality (9 327
models) and (b) PM2.5 IHD+STROKE+COPD+LC mortality (5 models). PM2.5 is calculated as 328
a sum of species. Uncertainty for each model is the 95% CI taking into account uncertainty in 329
RR. Uncertainty for the multi-model average is the 95% CI including uncertainty in RR and 330
across models. 331
332
Figure 2 – Geographical impact of climate change on mortality. Estimates are for 2030 and 2100 333
for (a) ozone respiratory mortality and (b) PM2.5 IHD+STROKE+COPD+LC mortality, 334
showing the multi-model average in each 0.5°x0.5° grid cell. PM2.5 is calculated as a sum of 335
species. 336
337
Figure 3 – Projected mortality for ten world regions. Estimates are for 2030 and 2100 for (a) 338
ozone respiratory mortality and (b) PM2.5 IHD+STROKE+COPD+LC mortality, showing the 339
model regional average. PM2.5 is calculated as a sum of species. Uncertainty for the multi-340
model regional average is the 95% CI including uncertainty in RR and across models. World 341
343
344
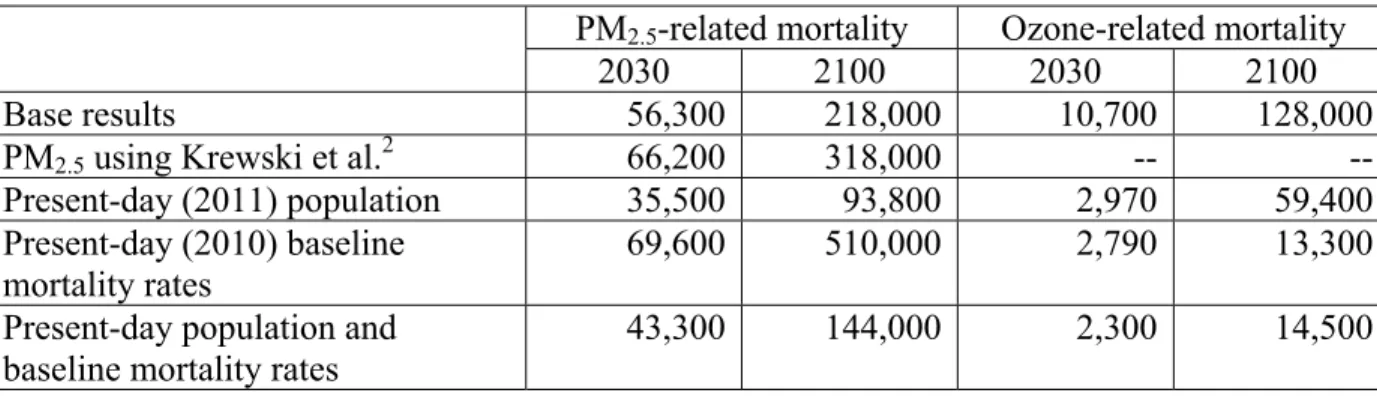
Table 1 – Sensitivity analysis for changes in global air pollution-related mortality attributable to 345
climate change. Estimates are for multi-model averages (deaths yr-1) for the deterministic 346
results. 347
348
PM2.5-related mortality Ozone-related mortality
2030 2100 2030 2100
Base results 56,300 218,000 10,700 128,000
PM2.5 using Krewski et al.2 66,200 318,000 --
--Present-day (2011) population 35,500 93,800 2,970 59,400
Present-day (2010) baseline
mortality rates 69,600 510,000 2,790 13,300
Present-day population and baseline mortality rates
43,300 144,000 2,300 14,500
349
350
351
Methods
353
The Atmospheric Chemistry and Climate Model Intercomparison Project (ACCMIP)13 included 354
contributions from 14 modelling groups, of which 9 completed simulations that are used here 355
(Supplementary Table 1). ACCMIP models incorporate chemistry-climate interactions, including 356
mechanisms by which climate change affects ozone and PM2.5, although models do not all
357
include the same interactions, and do not always agree on their net effects7. Of these nine, three 358
models are not truly coupled chemistry-climate models: MOCAGE is a chemical transport model 359
driven by external meteorology, and UM-CAM and STOC-HadAM3 do not model the feedback 360
of chemistry on climate13. As a result, these models do not fully capture the effects of changes in 361
air pollutant concentrations on processes that affect meteorology, such as through radiative 362
transfer and clouds. Prescribed anthropogenic and biomass burning emissions were very similar 363
for the different models, but they used different natural emissions (e.g. biogenic volatile organic 364
compounds, ocean emissions, soil and lightning NOx)14, 23. Modelled 2000 concentrations show
365
good agreement with observations for ozone23 and PM2.524, although models tend to overestimate
366
ozone in the Northern Hemisphere and underestimate it in the Southern Hemisphere, and to 367
underestimate PM2.5, particularly in East Asia.
368
We isolate the effect of climate change on air quality as the difference in concentrations between 369
ACCMIP simulations using year 2000 emissions together with future year climate, imposed by 370
prescribing RCP8.531 sea surface temperatures, sea ice cover, and GHGs (for radiation) for 2030 371
and 2100 (referred to as “Em2000Cl2030” and “Em2000Cl2100”), and simulations with 2000 372
emissions and climate (“acchist2000”)13. We analyse results from the nine models reporting
373
ozone from the Em2000Cl2030/2100 simulations, and the five reporting PM2.5 (Supplementary
374
grid cell, after regridding output from the native horizontal resolutions of each model (1.9°x1.2° 376
to 5°x5°) to a common 0.5°x0.5° resolution. To be consistent with the epidemiological studies 377
considered1,4, we use the seasonal average of daily 1-hr maximum ozone concentrations for the 378
six consecutive months with highest concentrations in each grid cell, and annual average PM2.5
379
concentration. 380
Seven of the nine models with Em2000Cl2030/2100 simulations reported both hourly and 381
monthly ozone concentrations, while two reported only monthly values. We calculate the ratio 382
of the 6-month average of daily 1-hr maximum concentrations to the annual average 383
concentrations, for each grid cell and each year, for those models that reported both hourly and 384
monthly concentrations; then, we apply that ratio to the annual average ozone concentrations for 385
the other two models, following Silva et al.11,12.
386
We calculate PM2.5 concentration using the sum of PM2.5 species mass mixing ratios reported by
387
five models and a common formula: 388
PM2.5 = BC + OA + SO4 + SOA + NH4 + 0.25*SS + 0.1*Dust, 389
where BC – Black Carbon, OA – (Primary) Organic Aerosol corrected to include species other 390
than carbon, NH4 – NH4 in ammonium sulfate, SOA – Secondary Organic Aerosol, and SS –
391
Sea Salt, as had been done previously by Fiore et al.33 and Silva et al.11,12. The factors 0.25 and
392
0.1 are intended to approximate the fractions of sea salt and dust that are in the PM2.5 size range.
393
Nitrate was reported by three models, but we chose to omit nitrate from our PM2.5 formula to
394
avoid imposing changes inconsistent with the effect of climate change for other models, 395
following Silva et al.11, although nitrate was included in estimates of total PM2.5 by Silva et al.12.
396
Four of these models also reported their own estimate of PM2.5 (Supplementary Table 1).
The impact of climate change on global population-weighted differences (Em2000Cl2030/2100 398
minus acchist2000) in PM2.5 and ozone concentrations for the different models are shown in
399
Supplementary Tables 4 and 5, respectively, while regional multi-model average differences are 400
shown in Supplementary Figures 7 and 8. 401
We estimate premature mortality by calculating the fraction of cause-specific mortality 402
attributable to long-term changes in pollutant concentrations, using methods that are identical to 403
those of Silva et al.12, so that mortality attributable to climate change can be compared simply 404
with changes in mortality under the RCP scenarios. We use relative risks (RRs) from Jerrett et
405
al.1 for ozone and respiratory diseasesand Burnett et al.4 for PM2.5 and cardiopulmonary diseases
406
and lung cancer. Then, we apply that attributable fraction in each grid cell to future adult 407
population (age 25 and older) and baseline mortality rates based on projections from the 408
International Futures (IFs) integrated modelling system32. Using country-level projections per 409
age group, we mapped and gridded to the 0.5°x0.5° grid assuming that the present-day spatial 410
distribution of total population within each country is unchanged in the future, as well as the 411
present-day ratio of baseline mortality for the specific causes included in the epidemiological 412
studies and for three disease groups projected in IFs (chronic respiratory diseases, cardiovascular 413
diseases and malignant neoplasms). We select population projections from IFs instead of those 414
underlying RCP8.5 to ensure consistency between projections of population and baseline 415
mortality, since the latter are not available for RCP8.5, and for consistency with Silva et al.12. IFs
416
projections of future total population are lower than those of RCP8.5 (-5% in 2030 and -27% in 417
2100) (Supplementary Figure 9). Had we used projections of population underlying RCP8.5, we 418
would have likely estimated greater changes in premature mortality relative to 2000. IFs 419
changes, showing a steep rise in chronic respiratory diseases (roughly tripling globally by 2100), 421
particularly in East Asia and India, some regional increases in cardiovascular diseases (e.g. 422
Middle East, Africa), and global decreases in lung cancer. 423
Overall uncertainty in mortality estimates includes uncertainty from the RRs and from air 424
pollutant concentrations. First, we conduct 1000 Monte Carlo (MC) simulations separately for 425
each model-year to propagate uncertainty from the RRs to mortality estimates. For ozone, we use 426
the 95% Confidence Intervals (CIs) for RR reported by Jerrett et al.1 and assume a normal
427
distribution, while for PM2.5 we use the parameter values of Burnett et al.4 for 1000 MC
428
simulations. Then, we calculate the average and 95% CI for the pooled results of the 1000 MC 429
simulations for each model to quantify the spread of model results. We do not include 430
uncertainties associated with population and baseline mortality rates, since these are not reported. 431
As ACCMIP models used the same anthropogenic and biomass burning emissions, we do not 432
consider uncertainty in emissions inventories, however we acknowledge that this is an important 433
source of uncertainty, especially in particular regions34-37. Our mortality estimates are affected by 434
our choices of and underlying assumptions regarding concentration-response functions, 435
population, and baseline mortality rates. Although a number of factors, such as vulnerability of 436
the exposed population and PM2.5 composition, vary spatially and possibly temporally, we
437
assume that the RRs estimated for the present day apply on a global scale and in future time 438
periods. Also, our assumption that the spatial distribution of population within each country is 439
constant in the future likely understates the effects of rural-to-urban migration, which is currently 440
underway and expected to continue. However, the effects of climate change on air pollutant 441
coarse grid resolution of global models would not resolve air pollutant concentrations well in 443
urban areas. 444
445
Data Availability 446
Data used in this project are archived here: 447
Air pollutant concentrations: Atmospheric Chemistry & Climate Model Intercomparison Project 448
(ACCMIP) datasets - http://catalogue.ceda.ac.uk/uuid/b46c58786d3e5a3f985043166aeb862d . 449
Data retrieved from 08/2012 to 12/2013. 450
Present-day population: Oak Ridge National Laboratory (ONRL) - LandScan 2011 Global 451
Population Dataset, http://spruce.lib.unc.edu.libproxy.lib.unc.edu/content/gis/LandScan/ . Data 452
retrieved on 12/05/2012. 453
Present-day baseline mortality: Institute for Health Metrics and Evaluation (IHME): Global 454
Burden of Disease Study 2010 (GBD 2010) Results by Cause 1990-2010 - Country Level, 455
Seattle, United States, 2013. 456
https://cloud.ihme.washington.edu/index.php/s/d559026958b38c3f4d12029b36d783da?path=%2 457
F2010 . Data retrieved from 12/2013 to 03/2014. 458
Future population and baseline mortality: Web-Based IFs - The International Futures (IFs) 459
modeling system, version 6.54., www.ifs.du.edu . Data retrieved on 07/2012. 460
IER model: Global Burden of Disease Study 2010. Global Burden of Disease Study 2010 (GBD 461
Health Metrics and Evaluation (IHME), 2013. http://ghdx.healthdata.org/record/global-burden-463
disease-study-2010-gbd-2010-ambient-air-pollution-risk-model-1990-2010 . Data retrieved on 464
11/08/2013. 465
References 466
31. Riahi, K. et al. RCP 8.5 - A scenario of comparatively high greenhouse gas emissions.
467
Clim. Change109, 33–57 (2011). 468
32. Hughes, B. B. et al. Projections of global health outcomes from 2005 to 2060 using the
469
International Futures integrated forecasting model. Bull. World Health Organ.89, 478–486 470
(2011). 471
33. Fiore, A. M. et al. Global air quality and climate. Chem. Soc. Rev.41, 6663–6683 (2012). 472
34. Bond, T. C. et al. Historical emissions of black and organic carbon aerosol from
energy-473
related combustion, 18502000. Glob. Biogeochem. Cycles21, GB2018 (2007). 474
35. Schopp,W., Klimont, Z., Suutari, R. & Cofala, J. Uncertainty analysis of emissions 475
estimates in the RAINS integrated assessment model. Environ. Sci. Policy8, 601613 476
(2005). 477
36. Smith, S. J. et al. Anthropogenic sulfur dioxide emissions: 1850-2005. Atmos. Chem. Phys.
478
11, 11011116 (2011). 479
37. Granier, C. et al. Evolution of anthropogenic and biomass burning emissions of air
480
pollutants at global and regional scales during the 1980-2010 period, Clim. Change, 109, 481
163-190 (2011). 482
483
484
-200,000 -100,000 0 100,000 200,000 300,000 400,000 500,000 600,000 700,000 800,000
-50,000 0 50,000 100,000 150,000
200,000 2030 2100
-300,000 -200,000 -100,000 0 100,000 200,000 300,000 400,000
-60,000 -40,000 -20,000 0 20,000 40,000 60,000
80,000 2030 2100
a. Ozone mortality (deaths yr-1)
2030
8 models
2100
9 modelsdeaths yr-1 (1000 km2)-1
-1000 -100 -10 -1 -0.1 -0.01 0.01 0.1 1 10 100 1000 a. Ozone mortality
deaths yr-1 (1000 km2)-1
-150,000 -100,000 -50,000 0 50,000 100,000 150,000
-20,000 -15,000 -10,000 -5,000 0 5,000 10,000 15,000
20,000 2030 2100
-400,000 -300,000 -200,000 -100,000 0 100,000 200,000 300,000 400,000
-80,000 -60,000 -40,000 -20,000 0 20,000 40,000 60,000
80,000 2030 2100
a. Ozone mortality (deaths yr-1)