1
Assessing Forest Cover Outcomes
A two-part analysis of development outcomes in Huntersville, North Carolina
Ashley Ownbey
Master’s ProjectDepartment of City and Regional Planning
2
Abstract
This paper reports the results of a forest cover analysis for Huntersville, North Carolina. The
analysis finds Huntersville’s sphere of influence to have experienced minor forest cover losses
between 2010 and 2018 and to be one of the most well-forested in Mecklenburg County. In
addition to the forest cover analysis, this paper reports the findings of a smaller-scale, site
analysis of four residential subdivisions. These subdivisions were selected to compare
developments before and after a policy shift in Huntersville that reduced the density and
intensity of residential development outside of Huntersville’s town core. The results of the site
analysis reveal minor differences in percentages of tree canopy and shared open space for
developments of varying densities, with the denser developments having just as much or higher
percentages of tree canopy than the less dense developments. The interests of this paper exist
at the intersection of literatures on changing land patterns and land use policy monitoring and
evaluation. These literatures drive the final recommendations of the paper, which are the
adoption of evaluation procedures to examine development outcomes for residential
subdivisions and the use of inventories and open-source technology to better track and map
3
Table of Contents
Introduction
...
1
Literature & Background
...
2
Literature Review ... 2
Project Background ... 5
Data & Methodology
...
6
Results
...
9
Forest Cover ... 9
Site Analysis ... 16
Recommendations & Continued Research
...
19
Recommendations ... 20
Site Analysis ... 21
Conclusion
...
22
References
...
23
Appendix
...
26
Figures A-1 & A-2 ... 26
1
Introduction
A growing literature reports the benefits of forest and tree cover, particularly in urban areas.
Many communities are responding to environmental and climate concerns with strategies to
increase urban tree canopy and green infrastructure. For communities outside of an urban core
where considerable forest cover still remains, decisions to conserve and increase tree canopy
are likely to involve more than tree planting, green roofs, and other strategies often adopted in
established, urban areas. These communities are often making significant land use decisions
that will affect their spatial growth and their consumption of land for development. This paper
explores forest cover for these types of communities and considers the following question: how
do local land use decisions about growth affect forest cover and tree canopy?
This question is explored through a two-part analysis related to the study of forest cover in
Huntersville, North Carolina. At the time this analysis was completed, the Town of Huntersville
was in the early stages of updating its 2030 Community Plan. During initial meetings with
stakeholders, a community interest emerged in understanding tree canopy. To expand on this
interest and assist in the plan updates, I adapted the initial scope of this project to consider how
forest cover in Huntersville and surrounding communities has changed over time. I included an
additional analysis of four residential subdivisions to better understand the effects of a policy
shift on forest cover and other development outcomes.
This paper considers the background and results of my two-part analysis as follows. First, I
review literatures on changing land patterns and the impacts of policy decisions on development
outcomes. I separate these two themes into their own sections, with each section including a
general review and then a discussion of specific literature related to forest cover and tree
canopy. Following the literature review, I provide background on the Huntersville case and how
this analysis expands upon existing literature. Next, I discuss the data and methodology. This
discussion is followed by a reporting of the results of my analyses. The paper concludes with
2
Literature & Background
Literature Review
Background for this project exists at the intersection of two major themes of relevant literature.
The first is an understanding of how land pattern changes are typically measured and analyzed.
A distinction emerges between the assessment of land cover change and land use change. The
second theme is the connection of local policy changes with land pattern and development
outcomes. This theme reveals the many linkages between socio-political processes and
community outcomes, particularly those related to the environment. In this section, literature for
each theme is broadly reviewed and then considered in the context of understanding changes in
urban forest cover and urban tree canopy.
Changing Land Patterns
A prominent theme in research of changing land patterns is the study of land cover, which is
typically analyzed in the context of sprawling urban centers (Angel et al. 2010; Bhatta 2010;
USGS 1999). This focus produces a dominant methodology reliant on remote sensing and other
GIS-based techniques (Bhatta 2010). These kinds of analytical techniques are particularly
valuable to understanding and comparing larger geographic areas.
Since sprawl is a dominant focus of the literature on land patterns, many urban growth metrics
are defined in an effort to distinguish and describe sprawl. In Bhatta’s (2010) compilation of the
research on sprawl, a list of dimensions, attributes, and measures emerges. Many of the listed
measures are adaptable to understanding the general growth of a community. For instance,
urban footprint is useful for describing how a built-up area has expanded over time (Bhatta
2010, 100). Urban footprints are generally used to compare “growth in population with growth in urbanized” (Berke et al. 2006a). The Atlas of Urban Expansion, which was created by a number
of partners including the Lincoln Institute of Land Policy, is one example of how the urban
footprint can be visualized across time and in the context of population growth (“Atlas of Urban Expansion” 2016). This online resource provides a format for comparing urban form and land
pattern changes across communities.
Sprawl and urban footprint measures imply a study of developed spaces and primarily
3 used to measure and analyze changes in forest and tree cover. In a study of regional forest
cover in the Eastern United States, Drummond and Loveland (2010) rely on remotely-sensed
Landsat data and geotagged photography to assess changes in forest cover between 1973 and
2000. In a more recent study, Nowak and Greenfield (2018) use Google Earth satellite imagery
and a method of randomly selecting paired-points for study on imagery from two separate years.
The selected points were classified as trees/shrubs, grass or herbaceous cover, bare soil,
agriculture, water, and three types of impervious surfaces. Researchers in Melbourne, Australia
used a similar random sampling methodology to understand changes in urban tree canopy in six
suburbs (Kaspar et al. 2017). Although these reviewed methods are focused on analyzing a
particular type of land cover, the researchers do not consider land cover in isolation. Changes in
land use are considered in each of the three studies and are essential to providing context for
the observed changes in forest and tree cover.
Understanding the distinctions and connections between land cover and land use are necessary
for evaluating the type of data and methods used to assess changing land patterns. Land cover
describes the type of surface, such as forest, impervious, or water. Changes in land cover are
thus observable at the level of data produced by satellites. In contrast, land use is commonly
understood in the context of human activity and most often defined by a government entity. As
land use is contextually defined and locally specific, data at a more micro level that are often
produced by a government entity, such as parcel-level data, are more useful.
The more local perspective needed for the study of changes in land use is explained by the
three major interests Berke et al. (2006a) describe as influencing land use decisions. Those
interests are in summary: the market, the government, and community values (198). These
forces for change explain the often narrow scope of land use change analysis. For instance,
research with a lens of transit-oriented development often examines land use changes in the
context of a new transit line (Hurst & West 2014). The force of change (i.e. the new transit line)
is typically the motive for examining any resulting land use changes. A broader approach to
understanding changes in land use includes the use of inventories and monitoring (Berke et. al
2006a). An example of this approach is the Census of Land Use and Employment (CLUE),
which is a biannual effort by the City of Melbourne, Australia that includes an assessment of
4 Studies of micro-level changes in forest and tree cover highlight the need for an understanding
of the land use context. In a study of urban forest cover in single-family residential
neighborhoods in Los Angeles County, Lee et al. (2017) consider redevelopment and additions
to existing residential structures. These changes, which are specific to the single-family
residential land use, are found to decrease urban forest cover. Lee et al. (2017) discuss the
importance of this finding to current strategies to increase tree canopy in Los Angeles County,
which focus on planting trees and ignore how allowable residential structure changes affect tree
canopy. Kolosna & Spurlock (2018) also consider urban tree canopy changes in residential
neighborhoods. Their research exists within an environmental justice perspective and considers
disparate neighborhood access to tree canopy. Kolosna & Spurlock (2018) specify that their
choice of a small-scale examination of tree cover allows for an increased understanding of how
local socio-political dynamics influence urban tree canopy. The ability to examine this type of
relationship highlights why connecting land use and land cover changes is of value for
understanding changing patterns in forest cover and tree canopy.
Impacts of Policy Decisions
Changes in land cover reflect the land use plans and development controls adopted and
implemented by governments. These plans and controls exist with the intent of influencing what
growth looks like within a jurisdiction. An understanding of how a place spatially grows requires
an analysis of the local policies that enable such growth. Despite the connection between
growth and policy, most models measuring changes in spatial patterns do not consider
governance structures (McNeil et al. 2014). Additionally, many local plans and ordinances are
rarely, if ever, evaluated to assess if goals and objectives have been achieved (Laurian et al.
2010). In the last two decades, movement toward performance-based and outcome-based
planning are shifting this trend (Berke et al. 2006b; Laurian et al. 2010). Recent research has
also proposed how incorporation of planning intentions may improve land-use modelling and
also how standardized evaluative models can reveal a plan’s success (Hersperger et al. 2018;
Gradinaru et al. 2017). These studies begin to link local policies with land cover and land use
outcomes.
Researchers have considered the effectiveness of local regulations and programs to promote
tree canopy. In a study to assess which variables correlate with greater tree canopy in Central
Indiana, Heynen and Lindsay (2003) found insignificant relationships between greater tree
5 the way these policy variables were measured likely influenced the finding of an insignificant
relationship. In another study, Hill, Dorfman, and Kramer (2009) evaluated local tree ordinances
in the Atlanta Metropolitan Statistical Area. Their research reveals that specific attributes of local
tree policy are more likely to produce positive outcomes. The most effective policies included: “a
set of tree ordinance clauses, zoning ordinances, and having high quality smart growth projects
in the community” (Hill, Dorfman & Kramer 2009, 413). These findings support continued study
of the bridge between land use and land cover and, in particular, how land use policies and
decisions affect forest cover and tree canopy outcomes.
This research project seeks to further the understanding of how local land use policy decisions
influence tree canopy and forest cover outcomes. Particularly, this paper builds on how
jurisdictional decisions about growth influence changes in forest cover and tree canopy. First,
this analysis seeks to understand forest cover change within a larger metro area in order to
assess how growing jurisdictions compare with one another. Then, the analysis shifts to a
smaller-scale that allows for a more careful assessment of the impacts of local policies. The
smaller-scale analysis deepens the understanding of how a local policy shift affects
development outcomes, particularly tree canopy and open space. The next section provides
background information about the case for this analysis and explores why this particular case
increases knowledge about the effects of growth patterns on forest cover and tree canopy.
Project Background
To explore the connections between local land use decisions and forest cover, I examine the
case of Huntersville, North Carolina. Located in Mecklenburg County less than 15 miles north of
the central core of Charlotte, Huntersville has experienced considerable growth since the early
1990s. Between the 1990 U.S. Census and the 2000 U.S. Census, Huntersville’s population
grew by 728% as the number of residents increased from 3,014 to 24,960 (U.S. Census Bureau
1990; U.S. Census Bureau 2000a). This growth has continued, with the population nearly
doubling by the 2010 U.S. Census and more recent estimates approximating just over 57,000
individuals living in Huntersville as of 2018 (U.S. Census Bureau 2010a; U.S. Census Bureau
2018a). The quick and continued growth of Huntersville makes it an ideal case for studying
changes in forest cover. Population growth produces demand for certain type of development,
6 As discussed in the literature review, a 2009 study of tree ordinances found that zoning
ordinances and policies promoting smart growth are more likely to positively influence the
amount of tree canopy in a jurisdiction (Hill, Dorfman & Kramer 2009). Assessing Huntersville’s
forest cover in the context of policy changes provides greater understanding of the social and
political forces involved in land cover changes. Once again, Huntersville is an ideal case for this
type of study. Between 2002 and 2003, the Town of Huntersville updated its community plan
and lowered the intensity of development allowed in the transitional areas outside of the higher
intensity core. This policy shift resulted in regulatory changes for residential subdivision
development, such as requirements for lot size and open space (Town of Huntersville Planning
Department 2019, Slide 60). Examining development outcomes before and after this policy shift
helps to reveal the relationship between land use decisions and forest cover.
This project has coincided with updates to Huntersville’s 2030 Community Plan. The Town of Huntersville initiated plan updates in September 2019 through a contract with Stewart – a
design, engineering, and planning firm. The Stewart team assigned to the Huntersville project is
based in Raleigh and has advised throughout the extent of this research project. In early
meetings with Huntersville stakeholders, the Stewart team identified an interest in
understanding Huntersville’s tree canopy and forest cover. This aligned with this project’s initial
focus on analyzing land pattern changes in the context of policy decisions. The focus of the
project shifted to consider forest and tree cover in Huntersville. The Stewart team used the
information gathered on changes in forest cover during public workshops held in February 2020.
Data & Methodology
The analysis of forest cover and policy changes in Huntersville proceeded in two phases. The
first phase focused on larger-scale changes in forest cover in Huntersville and other jurisdictions
in Mecklenburg County. I primarily collected land cover data through the Cropland Data Layer
(CDL) produced annually by the U.S. Department of Agriculture’s National Agricultural Statistics Services. The CDL “provides a raster, geo-referenced, crop-specific land cover map for the continental United States” that is hosted online through an interactive mapping service called
CropScape (U.S. Department of Agriculture n.d.). Although the primary purposes of the data
layer are agricultural, the layer also codes for different types of forest and developed spaces.
7 cover changes between 2002, 2010, and 2018. Due to limitations of the forest cover data from
the CDL, I ultimately excluded 2002 forest cover data from the analysis. Using geospatial tools
and techniques, I isolated different types of forest cover in the 2010 and 2018 data layers and
projected them accordingly.
A significant limitation of utilizing the CDL for this analysis is the design of the data to capture
annual land cover and not to monitor land cover changes over time. This is a more serious issue
for describing crop rotations and modeling future cropland (Lark et al. 2017). However, it should
be considered when assessing the results of this analysis. Errors in the CDL can be multiplied
by using a “bi-temporal ‘snapshot’ of change” as is done to capture forest cover change
between 2010 and 2018 (Lark et al. 2017, 227). That is, smaller or larger differences in forest
cover between 2010 and 2018 may appear due to errors in one or both of the annual
estimations. The amplification of these types of errors are somewhat limited by the community
scale of geography utilized to describe forest cover. Highly-specific points in space are not
compared thus limiting the influence of smaller-scale errors. Related to errors in the CDL is the
inference of forest cover acreage from pixels. For this analysis, I used the online CropScape
tool to generate the acreage estimations. These estimations use a statistical process that was
developed to account for the imprecise approximations generated by pixel-based data (Lark et
al. 2017, 227). Results of this analysis should be considered within the context of these data
limitations.
The second phase of my analysis moved from the larger, community-level scale to
consideration of changes at the level of development or site. While the first phase of the
analysis aims to understand changes over time, the second phase is concerned with how these
changes connect to policy and regulatory decisions, particularly land use decisions by the local
government. After consulting with Town of Huntersville planning staff, I selected four residential
development sites for this site-level analysis. I chose these sites to compare developments
approved before and after a policy shift in how Huntersville approached development outside of
the town’s core. I analyzed the sites along multiple dimensions, which are briefly described in
the below list:
Observable changes in aerial imagery (Google Earth) from a time prior to a development’s approval to the most current imagery
Tree canopy calculations using the i-Tree Canopy online tool
8 Housing analysis through an examination of data from the Mecklenburg County property
tax records
Road network analysis using relevant spatial datasets
The individual analyses of the sites are designed to demonstrate an outcome-based evaluation
of regulatory decisions. Decisions in the early 2000s to limit the density and intensity of
development in certain parts of Huntersville produce types of residential developments that
differently influence progress toward wider community goals and achieve varying outcomes
related to tree canopy and forest cover.
Most of the data and processes used in this second phase of analysis are descriptive in nature
and, therefore, the primary limitation is the quality of the data. The tree canopy calculations,
however, rely on random point sampling and should be considered more carefully. I used an
online tool called i-Tree Canopy to estimate tree canopy for each site (i-Tree n.d.). I selected
this tool in order to better capture canopy provided by street and yard trees. The i-Tree Canopy
tool randomly identifies points on Google Earth imagery. The user then identifies the point as a
tree or some other type of cover. As described by i-Tree, the accuracy of the tree canopy
assessment is dependent upon the user’s ability to correctly identify the points (i-Tree 2011).
For this analysis, only one user identified points. Ideally, multiple users would complete the
process to reduce user bias. An additional consideration for the i-Tree Canopy results is the
underlying statistics of random point sampling. To increase the accuracy of the estimates, I
sampled 500 points for each residential subdivision. This produced a standard error of
approximately +/- two percentage points in each case.
Another important consideration when interpreting the results of the site analyses is the
adaptation of procedures for analyzing the Olmsted site. The Olmsted site is still being
developed, with planned phases at different stages of completion. Initially, I used the same
procedures for the Olmsted site. This resulted in an overestimation of tree canopy and shared
open space and a failure to accurately consider the assessed home values and road network. In
order to evaluate the Olmsted site in its conceptually finished state, I overlaid and
georeferenced site plans in ArcMap and created new shapefiles for residential parcels and
roads. Then, I drew polygons of forest cover and open space. Existing forest cover was
9 The separately created files for residential lots and forest cover failed to capture many trees
preserved in the backyards of the completed Olmsted lots. In order to account for these and
future trees in residential lots, I took a sample (n=20) of currently developed lots and averaged
the percentage of forest/tree cover in the lots. I then multiplied the average (30%) by the total
number of planned residential lot acreage. From this process, the estimated forest cover in all
residential lots (current and planned) is 75 acres. I also adjusted the calculations of residential
assessed value and residential density to only consider currently completed residential
development. This adjustment operates under the assumption that similar density and housing
values will exist in future phases of the Olmsted development.
Results
Forest Cover
Growth and subsequent land cover changes are not bound to a single jurisdiction. This requires
that any examination of forest cover changes in Huntersville consider the context of land cover
changes within the larger geography. Huntersville’s location within Mecklenburg County and its proximity to Charlotte are essential to understanding the town’s population and spatial growth.
The population of Mecklenburg County increased by 32% between the 2000 and 2010
censuses (U.S. Census Bureau 2000b; U.S. Census Bureau 2010b). More recent population
estimates record continued growth in the county, which boasts a 15% growth rate between the
2010 U.S. Census and 2018 estimates (U.S. Census Bureau 2018b). Growth in Mecklenburg
County is distributed among 8 municipal jurisdictions and unincorporated areas. Map 1 shows
the dominant presence of municipalities within Mecklenburg County. As displayed in the map,
nearly the entire county is within one of the municipality’s spheres of influence and a majority of
the county is incorporated.
Among the many factors influencing the distribution of forest cover in Mecklenburg County is the
diffusion of power among the nine different local governments for regulating land use.
Locally-decided and enacted policies have and will influence the amount of forest cover retained during
periods of growth in Mecklenburg communities. Maps 2 and 3 show forest cover using 2010 and
2018 CDL data. According to CDL data, Mecklenburg County lost approximately 10,750 acres
of forest cover (10.3%) during the eight-year period. The maps show the majority of forest cover
12 Additionally, Maps 2 and 3 reveal that two municipalities contain significant amounts of forest
cover – Huntersville and Mint Hill. The northern part of Mecklenburg County also appears to
contain greater acreage of forest cover than other sections of the county.
Analysis of forest cover for the individual jurisdictions substantiate these patterns. Table 1
compares the number of acres estimated within each sphere of influence for 2010 and 2018. A
slight discrepancy in the total number of acres appears when analyzing the results presented in
the table. This is likely caused by the exclusion of Stallings and unincorporated Mecklenburg
County from the analysis along with errors in CropScape acreage estimates. The table begins to
reveal how differing development patterns may influence the amount of forest cover. As to be
expected, the city of Charlotte retains a large amount of forest cover given its spatial dominance
within the county. In comparison to the surrounding communities, the city has evolved within a
more urban development pattern, which is a likely contributor to the larger number of acres and
percentage of acres lost within the examined eight-year period. As gathered from the
examination of the forest cover maps, the spheres of influence of Huntersville and Mint Hill
contain the next largest portions of Mecklenburg’s forest cover acreage, at more than 18,000
and more than 11,000 acres respectively. These two jurisdictions are also in the top three of
forest cover as a proportion of land cover. Davidson shares the top spot with Mint Hill. Figures
A-1 and A-2 in the appendix provide a visual representation of forest cover at the jurisdictional
level.
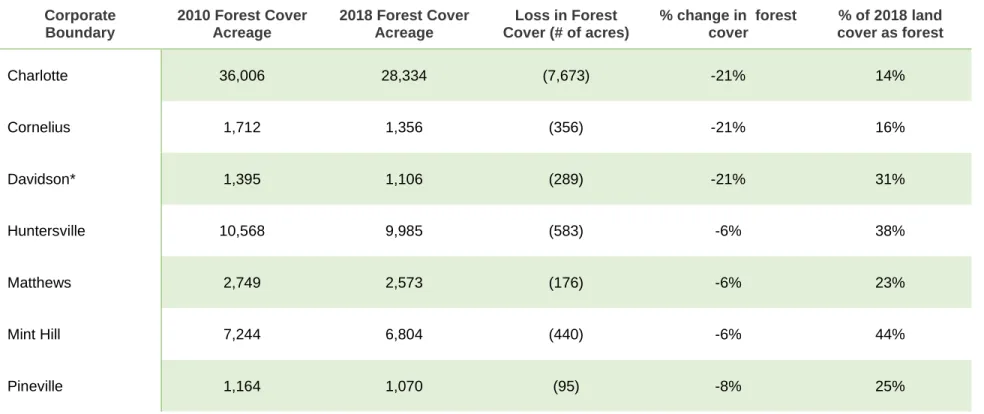
An interesting finding emerges when forest cover within the corporate boundaries is compared
to forest cover within the spheres of influence. Table 2 reports the acreage changes between
2010 and 2018 for the corporate boundaries. When compared to the data in Table 1, the two
tables reveal more rapid change within incorporated areas and some growth in forest cover in
certain spheres of influence. The percentage change in forest cover within the corporate
boundaries is higher for all jurisdictions. Notable increases appear for Davidson and Cornelius,
possibly indicating development patterns of more concentrated growth. Davidson and Cornelius,
along with Huntersville and Mint Hill, are also examples of forest cover gains within spheres of
influence. Davidson, for instance, lost an estimated 289 acres of forest cover within its corporate
boundary between 2010 and 2018. The loss for Davidson’s sphere of influence, however, is
only 102 acres. This indicates forest cover gains outside of the corporate boundaries. A notable
exception to this increase in forest cover is Charlotte, which is the only jurisdiction to experience
13
TABLE 1. 2010 & 2018 Forest Cover Acreage in Mecklenburg Spheres of Influence
Sphere of Influence 2010 Forest Cover Acreage
2018 Forest Cover Acreage
Loss in Forest Cover (# of acres)
% change in forest cover
% of 2018 land cover as forest
Charlotte 62,492 53,173 (9,319) -15% 22%
Cornelius 2,535 2,200 (335) -13% 23%
Davidson 4,398 4,295 (102) -2% 49%
Huntersville 18,563 18,228 (335) -2% 45%
Matthews 2,747 2,572 (175) -6% 23%
Mint Hill 11,556 11,216 (340) -3% 49%
14
TABLE 2. 2010 & 2018 Forest Cover Acreage in Incorporated Mecklenburg Co.
Corporate Boundary
2010 Forest Cover Acreage
2018 Forest Cover Acreage
Loss in Forest Cover (# of acres)
% change in forest cover
% of 2018 land cover as forest
Charlotte 36,006 28,334 (7,673) -21% 14%
Cornelius 1,712 1,356 (356) -21% 16%
Davidson* 1,395 1,106 (289) -21% 31%
Huntersville 10,568 9,985 (583) -6% 38%
Matthews 2,749 2,573 (176) -6% 23%
Mint Hill 7,244 6,804 (440) -6% 44%
Pineville 1,164 1,070 (95) -8% 25%
15 The comparison of these two tables begin to reveal the influence of land use and growth
policies on forest cover outcomes. Some of the differences between jurisdictional forest cover
are to be expected. Areas in central Charlotte will obviously not have the amount of forest cover
as a nature preserve in Northern Mecklenburg. A common land-use thread does exist across
the jurisdictions in Mecklenburg County that allows for comparison across jurisdictions – the
single-family, residential subdivision. Mecklenburg County property data downloaded in October
2019 describe 65% of parcels in the county as single-family. These single-family properties are
spread throughout the county and found in every jurisdiction.
Assessment of satellite imagery for residential subdivisions begins to partly explain why certain
jurisdictions are experiencing less loss of forest cover. A border shared between Huntersville
and Charlotte is a prime example. Eastfield Road separates Huntersville’s Olmsted subdivision,
which is further analyzed in the next section, from the Asbury Place subdivision in Charlotte.
Few trees are observable in the Asbury Place subdivision; while, the finished section of Olmsted
(bottom-left corner of image) includes significant areas of tree cover. Figure 1 shows the two
satellite images side-by-side.
FIGURE 1. Satellite Imagery of Olmsted & Asbury Place
16 Based on observable differences in the satellite imagery, residential density appears as the
most likely explanation for why tree cover is greater in the Olmsted subdivision. An analysis of
only these two images supports the conclusion that a trade-off exists between residential
density and tree cover. However, is this trade-off always present? The next section discusses
findings contrary to this quick conclusion that greater density means less tree cover. In the next
section, I present the results from a more detailed analysis of four residential subdivision sites in
Huntersville.
Site Analysis
A smaller-scale analysis is helpful in understanding the relationship between shifts in land use
policy and development outcomes. As previously discussed, Huntersville is an ideal case for
studying the effects of a major policy change. In response to growth in the 1990s and early
2000s, Huntersville updated its community plan in 2002-2003 to reduce the intensity of
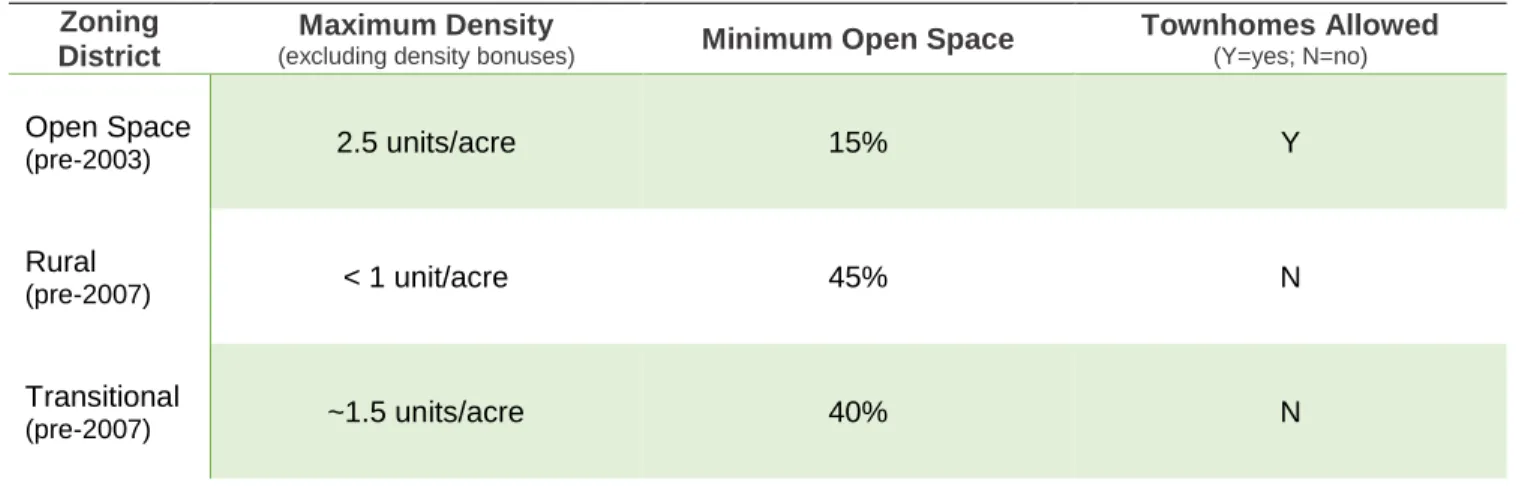
development outside of its core (Town of Huntersville Planning Department 2019, Slides 59-60).
This policy change resulted in regulations to lower the density of residential development
(units/acre) and increase the amount of required open space. Areas previously zoned as Open
Space (OPS) were amended to either the Rural District zone (R) or the Transitional District zone
(TR). Density and open space changes for these different zones are summarized in Table 3
(Town of Huntersville 2011, 26-28).
TABLE 3. Density & Open Space Regulatory Changes
Zoning District
Maximum Density
(excluding density bonuses) Minimum Open Space
Townhomes Allowed
(Y=yes; N=no)
Open Space
(pre-2003) 2.5 units/acre 15% Y
Rural
(pre-2007) < 1 unit/acre 45% N
Transitional
(pre-2007) ~1.5 units/acre 40% N
To understand the effects of these changes, I evaluated four subdivision developments. Two of
17 the decision to lower development intensity. At the times of approval, Beckett was zoned as TR
and Olmsted was within both R and TR zoning districts. Recent satellite imagery and approval
dates of the selected developments are displayed in Figure 2.
As described in the methods section, I completed multiple types of analyses to better
understand the outcomes resulting from the different policies that have guided development
regulations and land use decisions. On the next page, Table 4 provides basic information about
the subdivisions and Table 5 summarizes the results of the different types of analyses. More
detailed tables can be found in the appendix.
Beckett – approved 2006 Carrington Ridge – approved 2001
18
TABLE 4. Subdivision Summary
Subdivision Zoning District(s) Approved Residential Units
Total Subdivision Acres
Gross Residential Density
Residential Units/Developed Acre
Beckett TR 181 113 1.6 2.6
Carrington Ridge OPS 444 195 2.3 4.1
Gilead Ridge OPS 455 170 2.7 4.3
Olmsted R and TR 434 461 0.9 2.0
TABLE 5. Subdivision Site Analysis Summary
Subdivision % Tree Canopy % Open Space Assessed Value/Developed Acre
Road Length/Residence (feet)
Beckett 27% 38% $1,020,325 79
Carrington Ridge 52% 44% $1,007,608 57
Gilead Ridge 31% 40% $1,222,878 60
19 The results of the analysis reveal that the more intense developments do not lead to less tree
canopy and may actually record higher percentages of tree canopy and open space. Carrington
Ridge has a gross residential density more than two times that of Olmsted but the developments
share nearly identical percentages of tree canopy and shared open space. For Gilead Ridge
and Beckett, which are abutting developments, the more intense Gilead Ridge has a slightly
higher percentage of tree canopy and shared open space. Gilead Ridge, which is the densest
development in the study, also has the highest residential value per developed acre. Carrington
Ridge – the other dense development – has the fewest feet of road per residence; while, Olmsted – the development of lowest density – has the most feet of road per residence. This
measure is important in understanding the long-term maintenance costs associated with
residential development.
These results suggest that more intense development may be more cost-effective in the
long-run while maintaining the potential to promote tree canopy and shared open space. Higher
residential density and greater tree canopy do not always appear as trade-offs. In fact,
considering density and tree canopy together may promote mutual gains, including more
affordable housing and conservation of larger, more intentional clusters of trees. These results
point to another trade-off to consider when lowering density – the financial burden of
infrastructure. This is captured in the measure of road length per residence. In the next sections
I review the implication of these results for policy decisions in Huntersville and how this project
can be expanded with further research.
Recommendations & Continued Research
This research project focused on analyzing forest cover in the context of a local policy shift in
Huntersville, North Carolina that reduced the intensity of residential development in particular
areas. Other factors influencing development outcomes were not considered. Huntersville
planning staff identified the following factors as influencing tree canopy and open space
outcomes in the analyzed developments: changes to regulations on lot size and lot width;
natural, site-specific constraints, such as floodplains; and, changes to stormwater requirements.
It is important to consider the results of the site analysis within the context of these limitations. A
major finding of this report, however, still stands: density and tree canopy are not always
20 This finding that a trade-off does not always occur between goals for higher density and greater
tree canopy points to a larger context of local growth policies. From the start of this project, a
primary goal was to connect forest cover changes with policies used by communities to plan
and regulate growth. This initial purpose also drives the recommendations for incorporating the
project’s findings with planning efforts in Huntersville. After review of these recommendations, I
discuss how this project can be expanded through future research.
Recommendations
The results of this two-part analysis reveal that land use decisions and policies in Huntersville
have helped to slow the decrease in forest cover and also encourage considerable percentages
of tree canopy in residential subdivisions. This is most apparent in the comparison of forest
cover loss between 2010 and 2018 for communities in Mecklenburg County. Huntersville
emerges as one of the more well-forested jurisdictions in Mecklenburg, indicating other
communities may look to Huntersville as an example for conserving forest cover during
moments of considerable population growth.
Although this project reveals relatively positive forest and tree outcomes in Huntersville, the
comparative site analysis shows no real positive gains in tree canopy or open space with the
2003 shift to land use policies that were designed to reduce the density and intensity of
residential development in transitional areas of the town. If an intent of these policy changes
was to improve forest and tree cover outcomes, the regulations deserve revisiting. The analysis
of the four subdivisions in this paper shows minimal differences in tree canopy and shared open
space between higher- and lower-density subdivisions. If retaining and increasing tree canopy is
a priority for Huntersville, better connection of this priority with such regulations as lot size and
open space is needed. Additionally, other implications of lower-density residential development
exist. Most notable from this analysis is the financial burden of maintaining road networks. This
trade-off may be acceptable given Huntersville’s priorities but it requires proper attention and
planning.
Understanding these trade-offs and development outcomes requires the use of post-evaluation
tools to assess outcomes in residential subdivisions. According to a 2019 residential subdivision
dataset provided by the Town of Huntersville Planning Department, an estimated 31% of the
21 a set of development outcomes for each of these existing subdivisions would produce
considerable data to inform future amendments to growth plans and development controls.
Policies and regulations that governed the development of older subdivisions may be outdated.
However, this type of evaluation is not designed to suggest reversion to older policies but to
understand the conditions under which certain development outcomes were produced.
One way to implement this type of evaluation is through a type of scorecard that is completed
after subdivisions are fully developed. Scorecards have been used to determine how proposed
developments meet a community’s goals and priorities. For instance, the EPA has a webpage
with links to various smart growth scorecards (U.S. Environmental Protection Agency 2019).
These example scorecards demonstrate how communities might evaluate a development
project before it is approved or how a community could evaluate its existing conditions, such as
those related to walkability and bikeability. The pre-development focus of these scorecards
ignores the need for after-the-fact evaluation of how a development, and the policies and
regulations that governed the development, actually contributed to desired outcomes. The use
of actual scores may not be necessary or desirable for this type of evaluation. Completion of a
site analysis similar to the one in this paper that offers consistent summary of the information
across developments is likely sufficient.
A backdrop for this project has been community interest in understanding the existing tree
canopy in Huntersville. Given constraints, this project largely considered forest cover, which is
not tree canopy. Remotely-sensed data, such as the CDL used in this analysis, is limited in its
ability to capture single trees and small stands of trees. Collectively, street trees and yard trees
are significant contributors to tree canopy calculations. Data that include these trees will
produce more accurate representations of tree canopy. The data, however, must exist before
being interpreted. Huntersville may, then, consider conducting regular tree inventories to collect
tree data. Examples exist of local governments, such as the cities of Ithaca and Baltimore,
developing their own tree inventories (City of Ithaca, NY n.d.; Randolph 2018). Additionally,
open-source technology has been used in such cities as Philadelphia and Boston to encourage
involvement of a wider community to contribute to the data collection process for tree mapping
(OpenTreeMap n.d.). Open Tree Map is the open-source data platform used in both of these
cities. A tree inventory in Huntersville would help improve the tracking and mapping of trees and
also promote accountability measures for tree canopy goals. Publicly-available tree data could
22
Continued Research
Beyond the practical implications of this project, the analysis also points to ideas for continued
research. In particular, the second part of the analysis – the site analysis – could be extended beyond Huntersville’s jurisdiction. Comparing development outcomes in residential subdivisions
throughout Mecklenburg County, for example, would increase the understanding of how
particular land use policies influence such outcomes as tree and forest cover. The expansion of
the site analysis would also help to explain the forest cover trends observed in the first part of
the analysis. Important differences emerge when residential subdivisions from different
jurisdictions are compared. This was alluded to with the example comparison of Asbury Place
and Olmsted at the conclusion of the forest cover analysis. A broader connection of variations in
land use policies with jurisdictional differences in development outcomes is an important next
step to understanding which planning actions are most effective in producing desirable
outcomes.
Conclusion
This project adds to existing literature that seeks to understand land cover and land use
changes within the context of policy decisions. The consideration of forest cover for 2010 and
2018 reveals the challenges of comparing land cover across two points in time. Despite these
challenges, this exercise highlights the benefits of tracking land cover change as a development
outcome. Bridging research on land cover and land use changes with policy evaluation will help
to better assess how planning decisions at the local level influence broader outcomes. To
further the creation of this bridge, this research project’s use of a site analysis for specific
residential subdivisions can be expanded to compare outcomes across local jurisdictions.
Although the multitude of variables influencing outcomes would be difficult to control, a focus on
specific development regulations, such as lot size and open space requirements, is likely to
produce useful data regarding the relationships between policy and positive outcomes for tree
canopy and forest cover.
In addition to exploring the relationship between land cover change and local land use policy
decisions, this research project was designed to assist with the process of updating the Town of
23 Huntersville’s sphere of influence to be one of Mecklenburg County’s most well-forested. This
affirms the desire of Huntersville stakeholders to examine and understand changes in tree
canopy and current tree canopy conditions. Based on the results of this analysis, the report
concluded with recommendations for Huntersville that aim to: better connect tree canopy
priorities with development regulations; expand evaluation of residential subdivision outcomes;
and, consider innovations in mapping and inventorying local trees. These recommendations
center on monitoring and evaluation, emphasizing a critical point of this paper to regularly
24
References
Angel, Shlomo, Jason Parent, and Daniel L Civco. 2010. “The Fragmentation of Urban Footprints: Global Evidence of Sprawl, 1990-2000.” Lincoln Institute of Land Policy Working Paper, 1–100.
“Atlas of Urban Expansion.” 2016. http://www.atlasofurbanexpansion.org/about.
Berke, Philip, David R. Godschalk, Edward J. (Edward John) Kaiser, and Daniel A. Rodríguez. 2006a. Urban Land Use Planning. Urbana: University of Illinois Press.
Berke, Philip, Michael Backhurst, Maxine Day, Neil Ericksen, Lucie Laurian, Jan Crawford, and Jennifer Dixon. 2006b. “What Makes Plan Implementation Successful? An Evaluation of Local Plans and Implementation Practices in New Zealand.” Environment and Planning B: Urban Analytics and City Science 33 (4): 581-600. DOI:10.1068/b31166.
Bhatta, Basudeb. 2010. Analysis of Urban Growth and Sprawl from Remote Sensing Data. Berlin: Springer-Verlag.
City of Ithaca, NY. n.d. “Tree Inventory/GIS.” Accessed April 1, 2020. https:// www.cityofithaca.org/253/Tree-Inventory-GIS.
City of Melbourne. n.d. “Census of Land Use and Employment (CLUE).” Accessed September 27, 2019. https://data.melbourne.vic.gov.au/clue.
Drummond, Mark A. and Thomas R. Loveland. 2010. “Land-use Pressure and a Transition to Forest-Cover Loss in the Eastern United States.” BioScience 60 (4): 286-298.
doi:10.1525/ bio.2010.60.4.7.
Gradinaru, Simona R., Cristian Ioan Ioja, Ileana Patru-Stupariu, and Anna M. Hersperger. 2017. “Are Spatial Planning Objectives Reflected in the Evolution of Urban Landscape
Patterns? A Framework for the Evaluation of Spatial Planning Outcomes.” Sustainability (Switzerland) 9 (8). https://doi.org/10.3390/su9081279.
Hersperger, Anna M., Eduardo Oliveira, Sofia Pagliarin, Gaëtan Palka, Peter Verburg, Janine Bolliger, and Simona Grădinaru. 2018. “Urban Land-Use Change: The Role of Strategic Spatial Planning.” Global Environmental Change 51 (May): 32–42. https://doi.org/ 10.1016/j.gloenvcha.2018.05.001.
Heynen, Nikolas C. and Greg Lindsey. 2003. “Correlates of Urban Forest Canopy Cover: Implications for Local Public Works.” Public Works Management & Policy 8 (1): 33-47. DOI: 10.1177/1087724X03253604.
25 Hurst, Needham B. and Sarah E. West. 2014. “Public Transit and Urban Redevelopment: The
Effect of Light Rail Transit on Land Use in Minneapolis, Minnesota.” Regional Science and Urban Economics 46 (1): 57-72. 10.1016/j.regsciurbeco.2014.02.002.
i-Tree. n.d. i-Tree Canopy v6.1. https://canopy.itreetools.org/. Accessed March 19, 2020.
i-Tree. 2011. “i-Tree Canopy Technical Notes.” https://canopy.itreetools.org/resources/ iTree_Canopy_Methodology.pdf. Accessed March 19, 2020.
Kaspar, J., D. Kendal, R. Sore, and S.J. Livesley. 2017. “Random Point Sampling to Detect Gain and Loss in Tree Canopy Cover in Response to Urban Densification.” Urban Forestry & Urban Greening 24: 26-34. http://dx.doi.org/10.1016/j.ufug.2017.03.013.
Kolosna, Carl and Danielle Spurlock. 2019. “Uniting Geospatial Assessment of Neighborhood Urban Tree Canopy with Plan and Ordinance Evaluation for Environmental Justice.” Urban Forestry & Urban Greening 40: 215-223. https://doi.org/10.1016/j.ufug.2018. 11.010.
Lark, Tyler J., Richard M. Mueller, David M. Johnson, and Holly K. Gibbs. 2017. “Measuring Land-Use and Land-Cover Change Using the U.S. Department of Agriculture’s Cropland Data Layer: Cautions and Recommendations.” International Journal of Applied Earth Observation and Geoinformation 62: 224-235. http://dx.doi.org/10.1016/j.jag.2017.06. 007.
Laurian, Lucie, Jan Crawford, Maxine Day, Peter Kouwenhoven, Greg Mason, Neil Ericksen, and Lee Beattie. 2010. “Evaluating the outcomes of plans: theory, practice, and methodology.” Environment and Planning B: Urban Analytics and City Science 37 (4): 740–757. https://doi.org/10.1068%2Fb35051.
Lee, Su Jin, Travis Longcore, Catherine Rich, and John P. Wilson. 2017. “Increased Home Size and Hardscape Decreases Urban Forest Cover in Los Angeles County’s Single-Family Residential Neighborhoods.” Urban Forestry & Urban Greening 24: 222-235. http:// dx.doi.org/10.1016/j.ufug.2017.03.004.
McNeill, Desmond, Marcel Bursztyn, Nina Novira, Seema Purushothaman, Rene Verburg, and Saulo Rodrigues-Filho. 2014. “Taking Account of Governance: The Challenge for Land-Use Planning Models.” Land Use Policy 37: 6–13. https://doi.org/10.1016/j.landusepol. 2012.09.006.
Nowak, David J. and Eric J. Greenfield. 2018. “Declining Urban and Community Tree Cover in the United States.” Urban Forestry & Urban Greening 32: 32-55. https://doi.org/10.1016/ j.ufug.2018.03.006.
OpenTreeMap. n.d. “Find a Tree Map.” https://www.opentreemap.org/. Accessed March 19, 2020.
Randolph, Nathan. 2018. “Baltimore City’s Street Tree Data at Your Fingertips.” TreeBaltimore. Accessed April 1, 2020. http://treebaltimore.org/tree-inventory-summer2018/
26 Town of Huntersville. 2011. Huntersville 2030 Community Plan. Accessed April 1, 2020. https://
www.huntersville.org/646/Huntersville-2030-Community-Plan.
Town of Huntersville Planning Department. 2019. “2019 Huntersville 101 Planning.” https://
www.huntersville.org/DocumentCenter/View/4813/2019-Huntersville-101-Planning_reduced. Accessed March 19, 2020.
U.S. Environmental Protection Agency. 2019. “Smart Growth Scorecards.” https://www.epa.gov/ smartgrowth/smart-growth-scorecards. Accessed March 19, 2020.
U.S. Census Bureau. 1990. Total Population: Huntersville town, North Carolina. Prepared by Social Explorer. Accessed March 19, 2020.
U.S. Census Bureau. 2000a. Total Population: Huntersville town, North Carolina. Prepared by Social Explorer. Accessed March 19, 2020.
U.S. Census Bureau. 2000b. Total Population: Mecklenburg County, North Carolina. Prepared by Social Explorer. Accessed March 19, 2020.
U.S. Census Bureau. 2010a. Total Population: Huntersville town, North Carolina. Prepared by Social Explorer. Accessed March 19, 2020.
U.S. Census Bureau. 2010b. Total Population: Mecklenburg County, North Carolina. Prepared by Social Explorer. Accessed March 19, 2020.
U.S. Census Bureau. 2018a. Huntersville town, North Carolina 2018 Population Estimates. Using American FactFinder. Accessed March 19, 2020.
U.S. Census Bureau. 2018b. Mecklenburg County, North Carolina 2018 Population Estimates. Using American FactFinder. Accessed March 19, 2020.
U.S. Department of Agriculture. n.d. “CropScape – Cropland Data Layer.” Ag Data Commons. https://data.nal.usda.gov/dataset/cropscape-cropland-data-layer. Accessed March 19, 2020.
27
APPENDIX
Figure A-1. Forest Cover Distribution in Northern Mecklenburg, 2010 & 2018
Each graphic shows the corporate boundary and forest cover. Forest cover is clipped to each
jurisdiction’s sphere of influence.
2010 Cornelius 2018 Cornelius
2010 Davidson 2018 Davidson
28
Figure A-2. Forest Cover Distribution in Southern Mecklenburg, 2010 & 2018
Each graphic shows the corporate boundary and forest cover. Forest cover is clipped to each
jurisdiction’s sphere of influence.
2010 Matthews 2018 Matthews
2010 Mint Hill 2018 Mint Hill
29
Site Analysis Tables
Tree Canopy
Procedure notes: I used the i-Tree Canopy tool to random sample 500 points in the Beckett, Carrington Ridge, and Gilead Ridge subdivisions.
The process used for the Olmsted subdivision is discussed in the methods section of the paper.
Subdivision % Trees % Impervious Surfaces % Grass & Landscaped Features
Gilead Ridge 31% 36.6% 32.8%
Beckett 27% 30.8% 42.4%
Carrington Ridge 52% 29.0% 19.0%
Olmsted Estimated Acreages (without trees on residential lots)
Forest Cover 161.67 35%
Open Space (non-forest) 46.03 10%
House & Yards 252.18 55%
Total Acres (subdivision file) 461.22 100%
Olmsted Estimated Acreages (with trees on residential lots)
Forest Cover 161.67 35%
Estimated Forest Cover in Yards (Avg. 30%) 75.66 16%
House & Yards (minus estimated yard tree acres) 177.27 38%
Total Acres (subdivision file) 461.22 90%
Shared Open Space
Procedure notes: I used satellite imagery and parcel datasets to determine where shared open space is located within each subdivision and the
number of acres. All subdivisions include a club/lodge area, with all having a pool and playground area and Olmsted also having tennis courts.
Subdivision Passive O.S. Active O.S. Total O.S. % of acreage
Gilead Ridge 64.318 3.043 67.361 40%
Beckett 41.8601 0.737 42.5971 38%
Carrington Ridge 83.97 1.43 85.4 44%
30
Housing Assessment
Procedure notes: I analyzed publicly-available parcel records from Mecklenburg County to assess various factors related to housing within each
subdivision.
GILEAD RIDGE BECKETT
Total Developed Acres 103.171 Total Developed Acres 70.3269
Total Assessed Value of Developed Acres $ 126,165,500 Total Assessed Value of Developed Acres $ 71,756,300
Value/Developed Acre $ 1,222,877.55 Value/Developed Acre $ 1,020,325.08
Total Subdivision Acres 170.171 Total Subdivision Acres 112.924
Total Assessed Value of Subdivision Acres $ 126,226,700 Total Assessed Value of Subdivision Acres $ 71,756,400
Value/Subdivision Acre $ 741,763.87 Value/Subdivision Acre $ 635,439.76
Type of Unit # of Units Type of Unit # of Units
Single-Family, Detached 331 Single-Family, Detached 181
Single-Family, Attached 114 Single-Family, Attached
Total number of units 445 Total number of units 181
Housing Density for Subdivision Acres 2.7 Housing Density for Subdivision Acres 1.6
Housing Density for Developed Acres 4.3 Housing Density for Developed Acres 2.6
Minimum Housing Square Footage 1,679 Minimum Housing Square Footage 1,972 Maximum Housing Square Footage 7,114 Maximum Housing Square Footage 5,596 Average Housing Square Footage 2,735 Average Housing Square Footage 3,258
Minimum Housing Lot Acreage 0.05 Minimum Housing Lot Acreage 0.23
Maximum Housing Lot Acreage 0.5 Maximum Housing Lot Acreage 0.4
31
CARRINGTON RIDGE OLMSTED (only what is currently built)
Total Developed Acres 109.267 Total Developed Acres 84.636
Total Assessed Value of Developed Acres $ 110,098,300 Total Assessed Value of Developed Acres $ 94,176,290 Value/Developed Acre $ 1,007,607.97 Value/Developed Acre $ 1,112,721.42
Total Subdivision Acres 194.667 Total Subdivision Acres 461.222
Total Assessed Value of Subdivision Acres $ 110,248,600 Total Assessed Value of Subdivision Acres $ 142,987,090 Value/Subdivision Acre $ 566,344.58 Value/Subdivision Acre $ 310,017.93
Type of Unit # of Units Type of Unit # of Units
Single-Family, Detached 325 Single-Family, Detached 173
Single-Family, Attached 119 Single-Family, Attached
Total number of units 444 Total number of units 173
Housing Density for Subdivision Acres
2.3
Housing Density for Subdivision Acres (434
approved units) 0.9
Housing Density for Developed Acres 4.1 Housing Density for Developed Acres 2.0
Minimum Housing Square Footage 1,298 Minimum Housing Square Footage 3,216 Maximum Housing Square Footage 6,173 Maximum Housing Square Footage 9,660 Average Housing Square Footage 2,436 Average Housing Square Footage 4,478
Minimum Housing Lot Acreage 0.04 Minimum Housing Lot Acreage 0.3
Maximum Housing Lot Acreage 0.88 Maximum Housing Lot Acreage 0.824
32
Road Network
Procedure notes: I analyzed available spatial datasets to assess the road network and develop measures of sustainability for maintaining the
roads using property tax data.
GILEAD RIDGE BECKETT
Length of Internal Roads (linear feet) 26,566 Length of Internal Roads (linear feet) 14,243
# of residences 445 # of residences 181
Road length/residence (feet/residence) 60 Road length/residence (feet/residence) 79
Estimated Subdivision Tax Revenue $ 302,944.08 Estimated Subdivision Tax Revenue $ 172,215.36 Tax Revenue/Foot of Road ($/1 foot) $ 11.40 Tax Revenue/Foot of Road ($/1 foot) $ 12.09
Road Length/$1 in Tax Revenue (feet/$1) 0.09 Road Length/$1 in Tax Revenue (feet/$1) 0.08
CARRINGTON RIDGE OLMSTED
Length of Internal Roads (linear feet) 25,275 Length of Internal Roads (linear feet) 39,226
# of residences 444 # of residences 434
Road length/residence (feet/residence) 57 Road length/residence (feet/residence) 90
Estimated Subdivision Tax Revenue $ 264,596.64 Estimated Subdivision Tax Revenue $ 226,023.10 Tax Revenue/Foot of Road ($/1 foot) $ 10.47 Tax Revenue/Foot of Road ($/1 foot) $ 5.76