PROBING THE ARCHITECTURE OF COMPLEX TRAITS: FUNCTIONAL GENOMICS METHODS AND APPLICATIONS
Matthew C. Weiser
A dissertation submitted to the faculty of the University of North Carolina at Chapel Hill in partial fulfillment of the requirements for the degree of Doctor of Philosophy in the Curriculum in Bioinformatics and Computational Biology.
Chapel Hill 2015
Approved by: Terrence S. Furey
Fernando Pardo-Manuel de Villena Sayan Mukherjee
iii ABSTRACT
Matthew C. Weiser: Probing the architecture of complex traits: functional genomics methods and applications
(Under the direction of Terrence Furey)
Genome wide association studies (GWA) have had tremendous success in identifying genetic variants associated with complex traits. However, the majority of associated loci fall outside of protein coding regions, suggesting a role in regulatory function. This has highlighted a critical need for understanding the regulatory architecture of the genome. Recent advances in high-throughput sequencing technology have enabled transcriptional profiling and mapping of epigenetic features across a broad range of cell types and conditions, both in human and model organisms. As a result, an increasingly higher-resolution genome-wide annotation of regulatory elements is now available. Additionally, expression quantitative trait loci (eQTL) studies mapping the genetic basis of gene expression have identified single nucleotide polymorphisms (SNPs) whose allelic variation correlates with gene expression levels. In conjunction with epigenetic annotations, these results have greatly improved interpretability of variants implicated in complex traits. However, a more comprehensive model of epigenetic regulation in disease can only be obtained by directly assaying disease-relevant tissue in affected individuals. Moreover, traditional eQTL
methods often perform a prohibitive number of statistical tests, and are underpowered for
iv
present an analysis of the chromatin and transcriptional landscapes in colon tissue from 33 Crohn’s disease and non-IBD individuals. In ten samples, I found evidence of a molecular signature
v
ACKNOWLEDGEMENTS
First and foremost I’d like to thank my advisor Terrence Furey for guiding my research and providing constant feedback, mentorship and encouragement. Over the last five years I’ve learned a great deal from his thoughtful critiques and insightful approach to problem solving and technical troubleshooting. When I find myself stumped, I’ll often begin by asking: “How would Terry approach this?” in an effort to emulate his scientific thinking. That being said, his fantasy baseball prowess so far eludes me, and I realize I still have much to learn in that respect…
I’d also like to thank my committee members Fernando Pardo-Manuel de Villena, Sayan Mukherjee, Ian Davis, and Wei Sun, for their helpful advice and guidance of this project. In
vi
Yeast genotype and gene expression data discussed in chapter 2 were generously provided by Dr. Rachel Brem. Personal correspondence with Dr. Steve Haase and Dr. David Aylor provided essential context for the interpretation of eQTL results presented in chapter 2. Financial support for this dissertation was provided by NIH grants 5T32GM067553-09 and R01ES024983, as well as the University Cancer Research Fund (UCRF) from UNC-Chapel Hill, and NIH Grants U01-CA157703 and R01-CA166447.
Special thanks go out to the members of the Furey Lab, past and present, for providing new perspectives, helpful advice, and snippets of code, particularly: Jeremy Simon, Bryan Quach, Raulie Raulerson, Nur Shahir, Martin Buchkovich, and Karl Eklund, and Jeremy Wang. Finally, I’d like to thank all the friends and family who have been supportive every step of the way (as well as my dog, Marlo, who makes coming home from work every day feel like a party). In particular, mom and Gail for their constant support, advice, and love; Leah and Glenn for always making room for me on trips to visit; Amari, AJ, and Mia for keeping me up to date on all the cool stuff that old people like me don’t know about, like Call of Duty and which Octonaut is best. And last but not least, Kat- your love, encouragement, emojis, and willingness to indulge my degenerate, late-night Taco Bell excursions have kept a smile on my face. Without you I’d still be hopelessly rummaging around in the
vii
TABLE OF CONTENTS
LIST OF FIGURES . . . ix
LIST OF TABLES . . . xi
LIST OF ABBREVIATIONS . . . xii
I. INTRODUCTION . . . 1
Genome-wide characterization of regulatory elements . . . 1
Genome-wide association studies in complex traits . . . 3
Gene expression as a quantitative trait: the genetic basis of transcription . . . 4
II. NOVEL DISTAL eQTL ANALYSIS DEMONSTRATES EFFECT OF POPULATION ARCHITECTURE ON DETECTING AND INTERPRETING ASSOCIATIONS . . . 7
Introduction . . . 8
Materials and Methods . . . 11
Results . . . 18
Discussion . . . 26
III. INTEGRATIVE ANALYSIS OF CHROMATIN AND TRANSCRIPTIONAL LANDSCAPE IN CROHN’S DISEASE COLON TISSUE REVEALS METAPLASTIC CELL POULATIONS AND HIGHLIGHTS FUNCTIONAL REGULATORY REGIONS IMPLICATED IN DISEASE . . . 62
Introduction . . . 63
Materials and Methods . . . 65
Results . . . 69
Discussion . . . 77
viii
ix
LIST OF FIGURES
Figure 2.1 Schematic of the NetLIFT method . . . 30 Figure 2.2 Simulated gene module topologies . . . 31 Figure 2.3 Illustration of eQTL detection methods . . . 33 Figure 2.4 Partial correlation structure from network detection step,
for representative 100 gene, 50 gene, and 10 gene modules . . . 34 Figure 2.5 Number of detecteddistal associations,
by module topology/method . . . 35 Figure 2.6 Local and distal eQTL linkages in yeast . . . 36 Figure 2.7 Pairwise overlap of target gene sets enriched
for ribosomal annotation . . . 37 Figure 2.8 eQTL effects for LYS2 local regulatory variant
and downstream genes . . . 38 Figure 2.9 Distal eQTL associations in pre-Collaborative Cross mice . . . 39 Figure 2.10 PCA analysis for pre-CC mice . . . 40 Figure 2.11 Expression variability by founder strain, for locally-regulated
genes with at least 5 distal targets . . . 41 Figure 2.12 Expression variability for PWK-driven trans-acting factors
and target genes, in pre-Collaborative Cross mice . . . 42 Figure 2.13 Local and distal eQTL linkages in human
lymphoblastoid cell lines . . . 43 Figure 3.1 Gene expression signatures in colon tissue reveal
molecular subtypes corresponding to colon- and
ileum-specific transcription . . . 81 Figure 3.2 Principal components analysis of
genome-wide FAIRE-seq signal . . . 82
Figure 3.3 Molecular profiles defined by FAIRE-seq correspond
to tissue classifications defined by RNA . . . 83 Figure 3.4 Absolute distance to nearest TSS, for differential regulatory
x
Figure 3.5 Differential gene expression between CD, non-IBD
individuals, in Colon-Like subset . . . 85 Figure 3.6 H3K4me3 signal at TSS of genes upregulated in CD . . . 86 Figure 3.7 Differential chromatin accessibility analysis for CD, non-IBD
highlights disease-specific pathways
and regulatory mechanisms . . . 87 Figure 3.8 Genome Wide Association (GWA) SNP overlap with FAIRE-seq
open chromatin regions in colon tissue . . . 89 Figure 3.9 Overlap of genome wide association (GWA) SNPs for CD,
xi
LIST OF TABLES
Table 2.1 Sensitivity and specificity of partial correlation
detection, for simulated gene expression modules . . . 44 Table 2.2 Number of detected local eQTL effects, by method . . . 45 Table 2.3 Hotspot detection rate for gene modules with eQTL at hub
gene, in ten simulated data sets . . . 46 Table 2.4 Distribution of eQTL effects for local, distal eQTL, in 112
haploid yeast segregants using NetLIFT method . . . 47 Table 2.5 GO annotation enrichment for candidate regulators in yeast . . . 48 Table 2.6 Comprehensive list of putative regulators identified in yeast . . . 49 Table 2.7 Distal regulatory loci and candidate regulators
identified in yeast . . . 58 Table 2.8 GO enrichments for distal genes linking to PWK-driver
eQTL in pre-Collaborative Cross mice . . . 60 Table 2.9 GO term enrichment for putative trans-acting
factors in human LBCs . . . 61 Table 3.1 Data availability, clinical phenotype, and molecular subtype
designations for patient cohort . . . 91 Table 3.2 Top 20 GO analysis results for genes differentially expressed
between Ileum-Like and Colon-Like patient subsets . . . 93 Table 3.3 Top 20 GO terms for genes upregulated in CD samples . . . 94 Table 3.4 Top 20 GO terms for genes upregulated in non-IBD samples . . . 95 Table 3.5 Differential regulatory regions (DRRs)
xii
LIST OF ABBREVIATIONS
AvA: all (SNPs) versus all (genes) association testing method BH: Benjamini-Hochberg (false discovery rate correction) bp: base pair
BY: Benjamini-Yekutieli (false discovery rate correction) CC: Collaborative Cross
CD: Crohn’s disease
ChIP: chromatin immunoprecipitation CL: colon-like
DE: differential expression/differentially expressed DNA: deoxyribonucleic acid
DNase: deoxyribonuclease
DRR: Differential regulatory region ENCODE: encyclopedia of DNA elements eQTL: expression quantitative trait loci
FAIRE: formaldehyde-assisted isolation of regulatory elements FDR: false discovery rate
FWER: familywise error rate
GENEVAR: gene expression variation GI: gastrointestinal
GO: gene ontology
GREAT: genomic regions enrichment of annotations GTEx: genotype-tissue expression
xiii HTSF: high-throughput sequencing facility
IBD: inflammatory bowel disease ICA: Independent Components Analysis IL: ileum-like
kb: kilobase
LCL: lymhoblastoid cell line LD: linkage disequilibrium lncRNA: long non-coding RNA LP: lamina propria
LPMC: lamina propria mononuclear cells MAF: minor allele frequency
Mb: megabase
MHT: multiple hypothesis testing
modENCODE: model organism encyclopedia of DNA elements NetLIFT: network-based, large-scale identification of distal-eQTL PCA: principal components analysis
QC: quality control RNA: ribonucleic acid
SNP: single nucleotide polymorphism TAF: trans-acting factor
TES: transcription end site TSS: transcription start site
1 CHAPTER I Introduction
The publication of the human genome sequence in 2001 [1] ushered in a new era in the biomedical sciences, paving the way for a comprehensive understanding of phenotype,
development, disease, and evolution. However, initial results from the study immediately suggested that gene regulation and interaction played a more complex role in shaping complex traits than previously imagined. Surprisingly, the Human Genome Project estimated the number of protein coding genes at only 30,000-40,000 [1], a figure that has since been further reduced to ~21,000 [2], but was nevertheless already far fewer than pre-human-genome estimates of 60,000 or more [3,4]. Furthermore, only ~1% of the 3.2 billion nucleotides in the human genome was found to code for proteins [1]. In conjunction with results from genome wide association (GWA) studies, which have found that most trait-associated variation occurs in non-coding regions, this has highlighted an urgent need to identify all regulatory elements in both the human and model organism genomes, and understand their cell- and condition-specific role in shaping phenotype.
GENOME-WIDE CHARACTERIZATION OF REGULATORY ELEMENTS
2
was undertaken, with the aim of leveraging the power of high-throughput sequencing capabilities to annotate all functional elements of the human genome [5]. A similar project to study the regulatory architecture of model organisms Drosophila melanogaster and Caenorhabditis elegans was coordinated by the model Organism Encyclopedia Of DNA Elements (modENCODE) consortium in 2007 [6]. More recently, the Epigenome Roadmap Project [7] has created a compendium of “reference epigenomes” in adult, embryonic, healthy and diseased individuals. Currently, the ENCODE project has produced 1,640 data sets in 147 different human cell types [5], while
modENCODE has generated 237 and 700 genome-wide data sets for D. melanogaster and C. elegans, respectively [8,9]. The Epigenome Roadmap Project has surveyed the epigenomes of 127 tissues and cell types [7], with a primary focus on five core histone modifications. Collectively, integrative analyses from these consortia have provided major insights into genome architecture, gene-gene regulatory relationships, chromatin and transcriptional landscapes, and evolutionary conservation, painting a rich, molecular portrait of how a genome functions.
3
specific candidate regulators, and neighboring target gene sets were found to be enriched for cell-type specific function [12], providing an epigenetic framework for defining cell-cell-type identity. These preliminary integrative -omics analyses have given key insights into genetic and epigenetic
regulation of transcription, and have provided a model for using high-throughput data to screen for functional elements that play a role in the architecture of complex traits, particularly for those whose misregulation may contribute to disease.
GENOME WIDE ASSOCIATION STUDIES IN COMPLEX TRAITS
In contrast to the inter-omics analyses of ENCODE and the Epigenome Roadmap, genome wide association (GWA) studies have taken a functionally-agnostic approach to associate genetic variants with complex traits [13]. In these studies, thousands to millions of common single nucleotide polymorphisms (SNPs) are tested for statistical association with a binary (ex: disease versus no disease) or quantitative (ex: height) phenotype. SNPs that meet a genome-wide level of significance are thought to represent loci with direct association to the trait of interest, and may be prioritized for further functional studies. Since the first GWA study on age-related macular
degeneration was conducted in 2005 [14], thousands more have followed; as of November 2013, the NHGRI GWA catalog contained a total of 11,912 genome-wide significant, trait-associated SNPs, obtained from a total of 1,751 curated publications [15].
Despite the success and widespread adoption of the GWA approach, very few trait-linked loci have been found within coding regions of genes [15], suggesting that the mechanism of
association for many GWA loci is exerted via a regulatory influence on a nearby gene or genes. Thus fine-mapping and follow-up analyses are necessary for pinpointing the causal variants that
4
interest, such as those from ENCODE, can therefore be of crucial importance in selecting which LD buddy SNPs to prioritize for time-consuming and expensive follow-up studies [16,17].
In order to attain sufficient power to detect meager effect sizes of common variants, GWA studies often perform analysis using thousands to hundreds of thousands of individuals. Still, for almost all traits studied, the combined effects of associated loci explain only a small fraction of trait heritability. Although some debate exists regarding the accuracy of heritability and effect size estimates [18], there are two predominant (and non-mutually exclusive) hypotheses for this
“missing-heritability.” The first contends that rare variants with minor allele frequencies (MAF) less than 0.01 account for a significant proportion of trait variance; the second claims that many
common variants, all with small effect sizes, together account for the unexplained variance. Though it is not currently known to what extent these two hypotheses contribute to the missing heritability, an approach emphasizing functional effects of common variants with small effect sizes has been suggested as a potential way forward in the post GWA era [18], and may produce meaningful interpretations of genetic disease-association as increases in sample size provide diminishing returns in statistical power.
GENE EXPRESSION AS A QUANTITATIVE TRAIT: THE GENETIC BASIS OF TRANSCRIPTION
Borrowing from both the functional and agnostic models of association testing, expression quantitative trait loci (eQTL) analyses treat gene expression levels as a quantitative trait, and seek to identify genetic variants associated with transcription. Much as GWA studies perform association tests between genetic variants and a phenotype of interest, eQTL studies assay genotype and transcription across the same individuals, and systematically test for linkage between genetic markers and expression levels of thousands to tens of thousands of genes [19,20]. Significant associations provide an important information-bridge, providing a greater understanding of
5
The first eQTL study was conducted using a cross of laboratory and wild-derived yeast strains [21]; since then, numerous other studies have been conducted in model organisms, including Arabidopsis thaliana [22], C. elegans [23], rat [24], and mouse [25]. Human eQTL databases such as GENe Expression VARiation (GENEVAR) [26] provide a data-integration and visualization platform for accessing results from multiple human eQTL studies conducted in
adipose tissue, lymhoblastoid cell lines (LCL), T cells, skin, and fibroblasts [27–30]. Additionally, the Genotype-Tissue Expression (GTEx) project has recently concluded a pilot analysis [31] of a project involving 43 tissues and 175 individuals, and aims to scale up tissue collection to 900 donors in the coming years [32].
Results from the GTEx pilot analysis have shown significant enrichment for autoimmune-related GWA SNPs among eQTL identified in whole blood cell types, but not in tissues unautoimmune-related to disease, suggesting that eQTL results can be useful not only in highlighting functional relevance of GWA SNPs, but also in identifying relevant tissues for disease action [31]. Meanwhile, other studies have used eQTLs in LCLs to prioritize otherwise unknown candidate genes for GWA results in both childhood asthma [33] and Crohn’s disease [34].
Although results from eQTL analyses and functional genomics studies have been invaluable in understanding how human genome relates to complex traits, many hurdles remain. In human eQTL studies, performing association tests for all pairs of SNPs and genes in involves billions of tests, leading to challenges in both computational burden and reduced power due to severe
6
gene (presumably close to the eQTL SNP) that then alters the transcription rate of a distally-located target. Better methods for reducing the eQTL search space and identifying distal effects will
improve functional annotation of the genome and increase our understanding of the genetic architecture of complex traits and disease.
Additionally, GWA studies have highlighted disease-associated loci, but do not directly provide information regarding tissue of interest or mechanism of effect. While the results from functional genomics studies can be of great use in identifying candidate genes interpreting disease-associated genetic variants, existing data is primarily limited to normal cell lines and tissues. A more comprehensive understanding of disease mechanism can be better obtained by assaying disease-relevant tissue in affected and unaffected individuals. Disease-associated regulatory elements, genes, and pairwise associations identified with this approach will enhance our understanding of molecular basis of disease, and when interpreted in conjunction with existing association studies and functional annotations, may provide novel candidate targets for treatment and/or predict therapeutic response.
In chapter II, I present a novel method for eQTL detection, Network-based, Large-scale Identification oF disTal-eQTL (NetLIFT), which reduced testing burden and outperformed the power of distal eQTL detection compared to existing methods [35]. I applied this method to gene expression and genotype data for yeast, mouse, and human, identifying thousands of novel distal eQTL, and showed a consistent enrichment of distal effects within metabolic pathways. In chapter III, I discuss unpublished work in which an integrative -omics approach in Crohn’s disease
identified regulatory regions and genes implicated in disease, highlighting functional regulatory relationships and candidate drivers. In chapter IV I discuss how these results improve the
7 CHAPTER II
Novel distal eQTL analysis demonstrates effect of population architecture on detecting and interpreting associations1
OVERVIEW
Mapping expression quantitative trait loci (eQTL) has identified genetic variants associated with transcription rates, and has provided insight for genotype-phenotype associations obtained from genome-wide association studies (GWAS). Traditional eQTL mapping methods present significant challenges for multiple testing burden, resulting in a limited ability to detect eQTL that reside distal to the affected gene. To overcome this, we developed a novel eQTL testing approach, NetLIFT, which performseQTL testing based on the pairwise conditional dependencies between genes’ expression levels. When applied to existing data from yeast segregants, NetLIFT replicated most previously-identified distal eQTL, and identified 46% more genes with distal effects compared tolocal effects. In liver data from mouse lines derived through the Collaborative Cross project, NetLIFT detected 5,744 genes with local eQTL while 3,322 genes had distal eQTL. This analysis revealed founder of origin effects for a subset of local eQTL that may contribute to previously described phenotypic differences in metabolic traits. In human lymphoblastoid cell lines, NetLIFT was able to detect 1,274 transcripts with distal eQTL that had not been reported in previous studies, while 2,483 transcripts with local eQTL were identified. In all species, we found no
enrichment for transcription factors facilitating eQTL associations; instead, we find that most trans
8
acting factors were annotated for metabolic function, suggesting that genetic variation may
indirectly regulate multi-gene pathways by targeting key components of feedback processes within regulatory networks. Furthermore, the unique genetic history of each population appears to influence the detection of genes with local and distal eQTL.
INTRODUCTION
Gene expression is highly heritable, indicating a strong genetic component [36,37]. Expression quantitative trait loci (eQTL) mapping strives to uncover the underlying genetic architecture of transcriptional regulation. An important concept in dissecting complex regulatory processes is to identify both local and distal variants that are associated with gene expression. Local eQTL are largely thought to regulate proximal genes by affecting the activity of regulatory elements that directly influence transcription rates, such as through alterations in genomic sequence that affect binding affinities of regulatory factors. In contrast, distal eQTL map to genomic locations far from the affected gene, possibly on different chromosomes, and likely act initially on the expression or function of some nearby, intermediate gene that then affects the associated target gene in trans. Notably, in genetically diverse populations such as humans, the reported effect sizes and
significance levels for distalassociations are weaker than for local eQTL [21,22,38]. This is likely attributable to the greater noise inherent in indirect effects that occur within the context of a protein-protein interaction network.
9
differences in regulatory architecture or statistical power. Indeed, in several recent eQTL analyses using human data, distal eQTL mapping was either not performed or not reported [45,46], likely due to the inability to detect any distal eQTL whatsoever. Additionally, inferring the direction of effect of distal associations that result from protein interactions is difficult when dealing with gene expression data that is often noisy and highly correlated.
To detect distal eQTL with greater power, some recently-developed methods assume an underlying regulatory architecture in which the local regulation of an intermediate gene leads to widespread expression variation in a large set of target genes [47–50]. Modules of target genes are defined by factor analysis or gene-gene correlation statistics, and association testing is performed between genotypes and summary statistics of each module. In this setting, strong associations are thought to represent master regulators that exert broad, but potentially weak, effects in the regulatory network. These approaches reduce the multiple testing burden, as thousands of genes are replaced by a few dozen modules; however, there remain several drawbacks. First, if the regulatory activity of a trans-acting factor (TAF) affects only a handful of target genes, the initial clustering approach may not identify the small gene module. Secondly, the intermediate genes regulating the expression of gene modules are often not identified. Finally, expression for individual genes belonging to a module do not always correlate with the eQTL associated with the module, raising doubts about the validity of the results [47].
Others have developed methods focused on addressing interpretability and directionality of associations using randomization of genetic variables [51] and causal model selection tests [52] as a foundation for statistical inference. In these methods, conditional dependence between
10
correlations derived from gene expression data to restrict distal association testing, thereby reducing the multiple testing burden and highlighting candidate regulatory genes. In this framework, statistically significant local associations are first identified, and then local eQTL variants are tested for distal associations only for genes whose expression values show evidence of direct effects. We show that NetLIFT identifies individual SNP-gene distal associations with greater power than traditional pairwise eQTL testing, scales well to large data sets, and provides
interpretability regarding the mechanism of association by highlighting potential trans-acting factors. In simulation studies, NetLIFT better identified distal eQTL, especially those with small numbers of target genes, when compared with a traditional all-SNPs-vs-all-genes approach, a module-based approach (Independent Components Analysis, adapted from [50]), and a method designed to identify causal associations using randomization of genotype data [51]. Applying NetLIFT to a data set consisting of 112 yeast segregants [53], we recapitulated previously reported distal associations and putative regulators, while discovering several additional eQTL with
11
MATERIALS AND METHODS Description of the NetLIFT Model
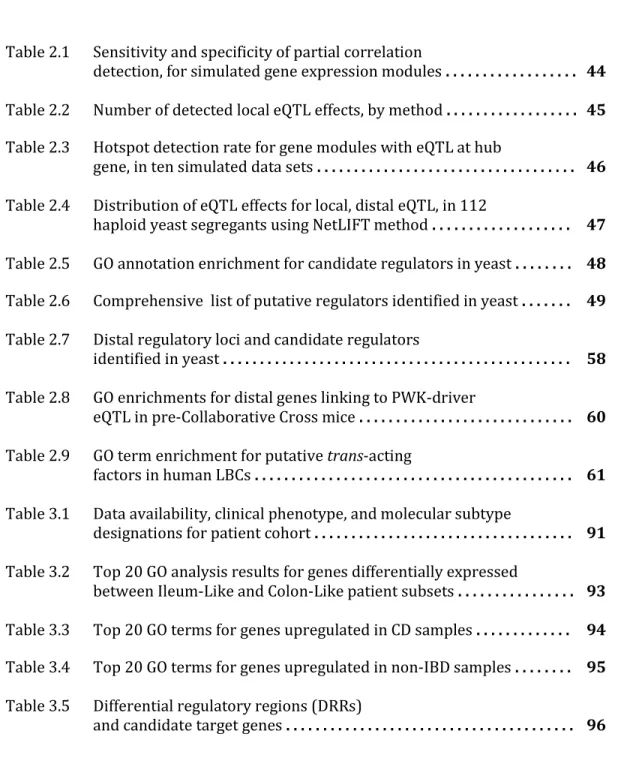
The analysis workflow for the NetLIFT model is outlined in Figure 2.1, and was designed to parallel our understanding of the mechanism of trans regulatory effects. That is, if SNP si, affects the transcription of gene gj in trans, we expect that si first directly affects the transcription level of an
intermediate gene gi, and that the transcription rate of gi directly or indirectly affects the transcription rate of gj. There are three main steps to the NetLIFT algorithm:
Step 1: Identify local eQTL:
Local association tests are performed for all variants that lie within an a priori defined window of each gene (Figure 2.1a). Allele counts are regressed on the genes expression values, using a univariate, additive linear model. Since some genes contain many more variants than others, we control the false positive rate in local testing by retaining only associations that meet a Bonferroni-corrected significance cutoff of 0.05. Significant associations represent variants that may have a direct effect on the transcription rate of nearby genes, likely by altering activity of cis regulatory elements.
Step 2: Estimate pairwise partial correlations for all genes:
Pairwise partial correlations are estimated for all gene pairs (Figure 2.1b) to identify genes with expression level dependencies. The distribution of connections for gene networks has been shown to follow a power-law distribution [54–57] with an overall small numbers of edges.
Therefore, we estimate the partial correlation matrix G using a method that enforces sparsity on the entries of G via L1 regularization, and which has been shown to accurately identify network hubs [58,59].
12
(∑ ‖ ∑ √
‖
) ∑
where gi and gj are the expression vectors for genesi andj, ρij denotes the partial correlation
between genes i and j, and σii and σjj are the ith and jth diagonal entries of the inverse covariance matrix. The L1 penalty λ controls the sparsity of the network, and was optimized by minimizing the BIC criterion outlined in [58].
For p genes, the resulting p x p matrix G consists of entries Gi,j that represent the correlation between expression vectors gi and gj, conditioned on the expression of all other genes’ expression:
, , ,
.corr g g g k i j
Gij i j k
G can be interpreted as an undirected network, where each node represents a gene, and an edge is drawn between two nodes if and only if the corresponding entry in the matrix G is nonzero.
Step 3: Distal eQTL testing:
Distal eQTLs are called by integrating the results from these two steps (Figure 2.1c). For each variant si that shows significant association to a local gene gi, we test si for association with
distal genes gj that are nearby gi in the partial correlation network defined by G. Since the edges of
G only account for direct relationships between two genes, we exploit the network structure to search for second-degree (downstream) regulatory effects as well. Specifically, we require two conditions for si to be tested for a distal effect on gj:
i) si must be strongly associated with expression of the putative trans-acting factor (TAF), gi; and
ii) genes gi and gj must be separated in the partial correlation network by no more than
13
significance level (we selected p < 0.2 for this cutoff in all analyses presented here). Although longer-range interaction effects could be considered by testing genes at increased distances within the network, doing so would exponentially increase the number of tests performed at each distance cutoff. We sought to balance this tradeoff by limiting the edge distance to two.
If a locally-affected gene contains many significantly associated variants, only the variant with the strongest local association is tested with distal genes. Furthermore, we impose
directionality in the ambiguous case where two directly connected genes both have local eQTL, by only recording the direction with the strongest distal association. We note that since G is a
symmetric matrix representing an undirected network of correlated genes, we make no assumption regarding the direction of potential gene-gene effects, and therefore no assumption about how variant-to-gene effects may propagate through the network. Instead, we use the network structure only to select which variant-gene pairs to test for associations. Although significant associations do not provide conclusive evidence of trans associations, we expect that many of the distal eQTL will be acting in trans, potentially through the putative TAF identified by our method.
We note that the correlation-based network structure used to guide the distal association tests will likely lead to correlations among test statistics. The Benjamini-Yekutieli (BY) FDR correction holds rigorously under general dependence of test statistics [60]; however, this correction is generally considered to be overly-conservative. Instead, we use the standard
Benjamini-Hochberg FDR [61], which in simulation studies was shown to perform comparably with the BY correction in the case of general dependency, and in particular for two sided t statistics [62].
ICA Method
14
hidden variables (“independent components”) by factoring the gene expression data matrix, X, into a product of two matrices: X~SA. Each column of matrix S corresponds to an independent
component or factor, and the i-th element of a column is the “activation” level of the i-th gene in that factor. These factors are meant to model some latent or underlying biological process. The k-th row of matrix A reflects the amount of activation of the k-th independent component across all
individuals, Aij is activation on the j-th individual for component i. Rows of A serve as the response vector when testing SNPs in a linear model. We used the fastICA function implemented in the R programming language to factor the expression data. This algorithm minimizes the statistical dependencies between the columns of S, so that each column of S defines groups of co-expressed genes. Since the method requires an a priori-defined number of components to use in factorization, we set this parameter to 14; the number of modules in each simulated expression data set. To assign individual genes to components, we used the fdrtool function, which models a column’s scores as a mixture of null and alternative distributions. Each entry of the column is assigned an FDR corresponding to the likelihood of belonging to the null. For each component (column of S), a corresponding component-set was defined for genes with FDR < 0.05.
Association tests were performed by regressing allele counts on rows of A, which represent the activation of each component across individuals. SNP-component associations with Benjamini-Hochberg corrected FDR < 0.05 were considered significant. For each association between a true local eQTL and a component, we defined the number of true positives to be the number of component-set genes which were downstream of the locally-affected driver gene. False positives were defined as any other gene assigned to that component-set.
Trigger Method
15
the causality equivalence theorem to identify the direction of effect. Briefly, let: si bet the genetic
variant to be tested for association, and let gibe a nearby gene. Trigger first tests for association
between si and gi (graphically: si → gi) using a standard likelihood ratio test. This gives Pr(si → gi). If
the probability of a local association exceeds a defined threshold, the variant is then considered for distal association testing. A similar likelihood test is used for defining the probability of linkage between si and gj, for all other genes gj, under the condition that si → gi, (denoted Pr(si → gj | si → gi)).
Finally, we test whether si and gj, are independent, given the expression of gi: Pr(si⊥gj | gi | si → gi
and si → gj). The causality equivalence theorem can be used to show that:
Pr(si → gi → gj) = Pr(si → gi) × Pr(si → gj| si → gi) × Pr(si⊥gj | gi | si → gi and si → gj),
so multiplying the probability estimates yields an estimate for direct effect of si on gj. We use the R
package “trigger” for implementation of this algorithm.
Data Simulation Procedure
A total of ten gene expression data sets were simulated, each with 500 genes and 250 samples. For each set of 500 genes, a network gene structure consisting of 14 disconnected gene modules of varying numbers of genes was imposed. Sizes of gene modules in each data set were as follows: 100 (x2), 50 (x2), 10 (x10), leaving 100 genes that were independent of any module. Module topologies are depicted in Figure 2.2. For each module, the hub gene’s expression values for 250 samples were simulated first, by drawing from a standard normal distribution. Each successive downstream gene’s expression was modeled as a linear combination of the upstream gene plus random error, using an effect size of ±1, and a random error drawn from a standard normal distribution, represented as follows:
where gds and gus represent expression of the downstream and upstream genes, respectively, and
16
a gene with degree greater than 20) were chosen to have effect sizes of 1, while all other effect sizes were assigned randomly as -1 or 1 with probability 0.3 and 0.7, respectively.
Next, for each gene, the total number of SNPs for that gene was drawn from a gamma(4,0.2) distribution and rounded to the next highest integer. Minor allele frequencies for each SNP were drawn from a uniform(0.05, 0.5) distribution; from these, diploid genotype frequencies encoded 0, 1, 2 were derived under the assumption of Hardy-Weinberg equilibrium.
For each module, a single gene, not necessarily the hub gene, was chosen to have a local eQTL effect. Since the network topology is undirected, local eQTL effects on non-hub driver genes may lead to spurious distal associations in the analysis. In order to investigate the sensitivity and specificity of the method under these potentially confounding circumstances, we assigned local eQTL effects to hub genes in some modules, and to genes downstream of the hub in others. Furthermore, thirty percent of the 100 independent genes were assigned at random to have local eQTL effects. If a gene was not chosen to have an eQTL, genotypes were assigned randomly to the 250 samples. For genes chosen to have an eQTL, the direction of effect was chosen to be positive or negative with probability 0.7 and 0.3, respectively. Genotype labels were assigned using a genetic algorithm that sought to maximize the effect size under the condition that the significance of association lie within a certain range (here, between 5e-05 and 1e-08). In cases where the eQTL was assigned to the hub gene, all genes in the module were considered as distal targets; however, to model cases where confounding associations may occur between the eQTL SNP and genes
“upstream” of the locally-affected gene, we also assigned eQTL effects to non-hub genes.
17
defined true distal associations as those genes downstream of the locally-associated gene in the expression topology. Working code and a representative simulated data set is available for download at: http://fureylab.web.unc.edu/software/netlift/.
Yeast Data
Gene expression and genotype data, described previously [53] were obtained from R. Brem. 112 yeast segregants were mated from parent strains BY4716 and RM11-1a and grown in culture. Strains were genotyped at 2,957 markers and expression measurements were assayed for 6,216 ORFs. Genes with no available annotation information were removed, leaving a total of 5,647 genes for analysis.
Mouse Liver Data
Gene expression data was previously assayed on the Affymetrix Mouse Gene 1.0 ST array, and was obtained from GEO (accession number GSE22297) [63]. Expression values were
normalized using the “rma-sketch” option in the Affymetrix Power Tools package. Probes
containing SNPs were masked in the normalization procedure. Probesets that were expressed at a level above 6 on a log2 normalized scale in at least 87.5% of mice were retained, leaving a total of 9,377 probesets for further analysis. Genotypes for 181,752 markers from the “A” test array for the Mouse Diversity Array were obtained from D. Aylor.
Human Lymphoblastoid Cell Line Data
Gene expression data and HapMap phase 2 and 3 genotypes were obtained from
http://eqtl.uchicago.edu. Normalization and processing were performed as described previously
18
analysis, based on median expression level of the pre-quantile normalized data across all 69 individuals, leaving 9,810 transcripts that were retained for analysis.
RESULTS Simulation Analysis
To assess the sensitivity and specificity of NetLIFT for identifying distal eQTLs, we applied the method to ten simulated data sets consisting of paired expression and genotype data (see Methods).
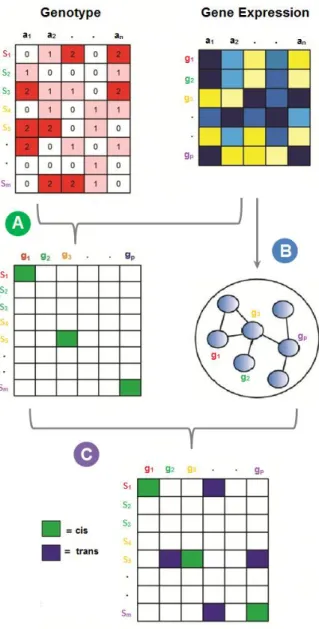
For comparison, we also tested three previously described eQTL detection methods: Independent Component Analysis (ICA), Trigger, and an All-vs-All pairwise testing approach (AvA) (Figure 2.3). The ICA method is primarily suited to identify eQTL that drive the expression of large numbers of distal genes; however, we note that the number of desired components must be defined according to some empirical criteria, and no specific intermediate gene is pinpointed as the trans -acting factor responsible for large scale variations. Therefore, this method does not identifylocal eQTLs.
We first compared the network structures inferred by NetLIFT’s partial correlation analysis to the true simulated regulatory architecture. We found that NetLIFT estimates the gene-gene partial correlation structure with high sensitivity, but note that as module connectivity increases, specificity decreases (Table 2.1, Figure 2.4). However, since the network structure is used primarily to determine which SNP-gene tests to perform, the main effect of false network edges is a slight increase in testing burden. As a result, we were willing to tolerate a reduction in network accuracy so long as the sensitivity remained high.
19
positive for both methods. Additionally, we observed a large number of false positive local eQTL for Trigger, likely due to a lenient default thresholding criterion in the local eQTL testing step. Since we are particularly interested in this method’s ability to detect distal eQTL, and since distal eQTL identification is conditional on local linkages for this method, we chose to retain the permissive threshold and focus primarily on results for distal associations.
Intra-module distal eQTL were predicted using each method simultaneously considering all genes and SNPs from all simulated modules. For each module, the true set of distal effects was defined as all SNP-gene associations between the module eQTL and genes downstream of the locally-affected gene. Thus, for modules where the eQTL acted on the hub gene, all combinations of the local eQTL SNP with non-hub genes were considered “true positives.” For modules with eQTL acting on non-hub genes, the true positives were defined as the eQTL-gene pairs in which the associated genes were downstream of the locally-affected, driver gene. False positives were defined as eQTL-gene associations where the associated gene was not downstream of the locally-affected gene. Figure 2.5 details the performance of each of the four methods.
20
false positives (p = 4.92e-96), again suggesting that the false positive count is strongly dependent on the FDR threshold chosen.
The AvA approach performed poorly, as most true associations were lost after correcting for multiple hypothesis testing. ICA performed well in large module settings, but poorly for small modules, suggesting that this approach is underpowered for detecting small co-regulated gene modules under the influence of a common variant. Trigger performed better than an AvA approach, though in general identified fewer than 12% of true distal associations. NetLIFT was the only method to consistently identify distal effects in all network topologies.
We next evaluated NetLIFT’s performance in detecting “hotspot” eQTL loci, where a hotspot is defined as a locus that is associated with more transcripts than is expected by chance. To derive a FWER for each locus, we used the procedure described in [64], which permutes genotypes among samples but preserves the correlation structure present in the gene expression data. Performing association testing with the permuted genotype data sets yields a distribution of the expected maximum number of linkages under the null hypothesis of no eQTL associations. When restricting to a FWER of 0.05, NetLIFT identified the eQTL for all hub-based gene modules as hotspots in 10/10 simulated data sets, while the AvA approach identified these eQTL as hotspots only 20-60% of the time, and with many fewer linkages (Table 2.3).
21 Analysis of 112 yeast segregants
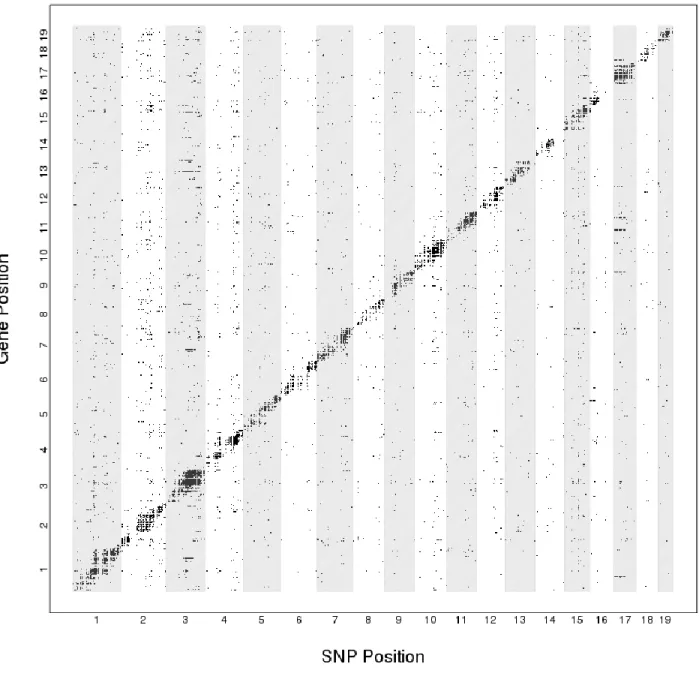
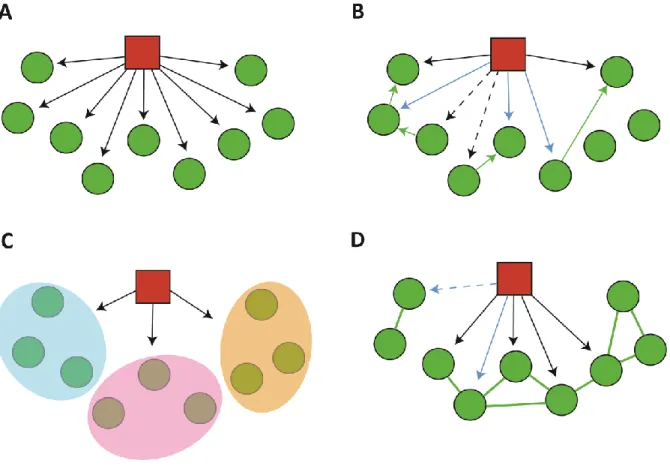
We applied NetLIFT to previously analyzed paired genotype/gene expression data for 112 haploid yeast segregants [53]. After filtering for genes with available annotation, 5,647 genes and 2,956 variants were retained for analysis. Variants within 10kb of the gene’s transcribed region were considered “local,” and all other linkages were denoted as distal eQTL. At an FDR of 0.05, we identified a total of 1,124 (19.9%) and 1,642 (29.1%) genes with local and distal eQTL effects, respectively (Figure 2.6). Local and distal effects were observed to have a similar effect size and level of significance (Table 2.4). The large effect sizes for distal eQTL are in line with previously reported results, and are likely attributable to the extreme diversity between the two strains of yeast.
A GO analysis using all 143 genes identified as intermediate trans-acting factors (TAFs) for at least 10 downstream targets revealed enrichments for a wide range of functions, with top hits reserved for metabolic function and transport (Table 2.5). This corroborates previous findings where putative regulators located near hotspots were not found to be enriched for transcription factors; instead, evidence suggests that many trans regulators exert widespread transcriptional effects by mediating levels of key metabolites or regulating post-translational processes [44,65]. A comprehensive list of all putative regulators is provided in Table 2.6.
For most previously identified hotspots, NetLIFT correctly identified biologically validated regulators (Table 2.7). Several predicted novel regulators with more than 15 target genes were also found, many involved in metabolic and biosynthetic processes. In some cases, we provide
22
results implicated AMN1 and MAK5 as trans-acting factors for subsets of the target genes; however, patterns of linkage to distinct regions within this locus suggest that additional regulators lie on chromosome 2 [21]. In addition to AMN1, NetLIFT implicated at least seven new candidate regulators on chromosome 2– TBS1, ARA1, YSW1, TOS1, UMP1, NPL4, and YBR197C– that were strongly linked with local eQTL (p < 1.0e-05) and were associated with highly overlapping sets of distally-associated genes (Figure 2.7). Notably, we fail to identify MAK5, as this putative regulator was shown to contain a loss of function mutation which has no effect on transcription [21]. By definition,distal effects arising from amino acid substitutions affecting protein function of the trans-acting factor will be undetectable using NetLIFT, as we specifically seek to identify distal effects that arise from local, cis-regulatory effects.
Given the strong enrichment for ribosome function among target genes linking to the chromosome 2 loci, we hypothesized that causal variants would significantly affect growth rates via widespread differential transcription originating from direct up-/down- local regulation of the candidate TAF. To investigate this, we used segregants’ gene expression profiles to predict relative growth rate, using previously described methods [66]. We then tested each of the candidate regulators’ distal eQTLs for association with the growth rate phenotype. After correction for multiple testing, we found that nearly all of the underlying variants attained significance at FDR < 0.05. We propose that differential expression of the putative regulators influences growth rate by perturbing common, growth-related pathways in trans.
We found numerous loci linking to small sets of target genes that are functionally related, as might be expected from the simulation results. TEC1, a transcription factor that targets
23
variant with strongest local effect on TEC1) in an all versus all test, only 4 (16%) showed direct evidence of TEC1 binding and regulation, suggesting that NetLIFT is better able to identify biologically relevant associations.
We identify several putative regulators that are metabolic enzymes and whose target gene sets are enriched for metabolic and biosynthesis annotations. For example, a locus on chromosome 2 that acts as a local eQTL for LYS2 was distally associated with 167 target genes enriched for the GO term “lysine biosynthetic process via aminoadipic acid” (p=1.27e-07). LYS2 catalyzes the
reduction of alpha-aminoadipate to alpha-aminoadipate semialdehyde (αAASA), the fifth step in the lysine biosynthesis pathway. Downstream of this reaction, glutamate-forming saccharopne
dehydrogenase, which consists of the structural determinant LYS9 and the regulatory product LYS14, converts αAASA to saccharopine. LYS9 loss of function increases intracellular levels of αAASA, which induces the regulatory activity of Lys14p and results in the up-regulation of several genes in the pathway, including LYS1, LYS9, LYS2, LYS4, LYS20, and LYS21 [68]. In a previous experiment, a mutant strain with loss of function for both LYS2 and LYS9 was shown to have decreased intracellular αAASA and lower levels of transcriptional activation of pathway genes, relative to the LYS9 single mutant [69,70]. We hypothesize that strains harboring the genomic variant associated with decreased transcription of LYS2 will have a similar reduction of
24 Analysis of 156 partially inbred mouse lines
To test how well NetLIFT scales to larger data sets, and for organisms with more complex mechanisms of gene regulation, we analyzed paired genotype and liver gene expression data from 156 partially inbred mice originating from eight founder mice (A/J, C57BL/6J, 129S1/SvImJ,
NOD/LtJ, NZO/HlLtJ, CAST/EiJ, PWK/PhJ, and WSB/EiJ), part of the Collaborative Cross (CC) project [71,72] (Figure 2.9). Founder strains of the CC were chosen to provide a high level of genetic
diversity, and represent three subspecies of origin: Mus mus domesticus, Mus mus castaneus, and Mus mus musculus. Wild-derived WSB/EiJ and classical inbred strains A/J, C57BL/6J, 129S1/SvImJ, NOD/LtJ, NZO/HlLtJ have a genetic background comprised mostly of the Mus mus domesticus subspecies, while the wild-derived CAST/EiJ and PWK/PhJ founder strains are primarily
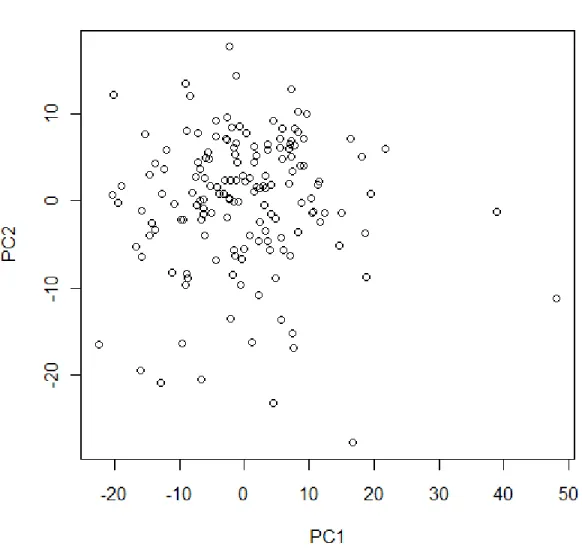
representative of the Mus mus castaneus and Mus mus musculus subspecies, respectively [71,72]. We filtered for probe sets expressed above background levels and retained 9,377 genes for analysis. PCA analysis revealed no batch effects in the data (Figure 2.10). Genotypes for the same mice were available for 171,761 markers. In a previous analysis, a total of 6,182 eQTL were
discovered for 5,733 genes at a 5% genome-wide threshold; 75% of eQTL were within 10cM of the affected gene [63].
For eQTL testing, we defined local effects as those where variants were within 1Mb of the affected gene, based on the marker-to-gene distances for linkages reported previously for these data [63]. We detected a total of 5,744 genes (61%) with a local eQTL, and 3,322 (35%) with at least one distal eQTL (FDR < 0.05). Of the genes with a distal eQTL, 1,102 (12%) were linked to one SNP, 574 (6%) were linked to two SNPs, 400 (4%) were linked to three SNPs, and 1,246 (13%) were linked to four or more SNPs.
25
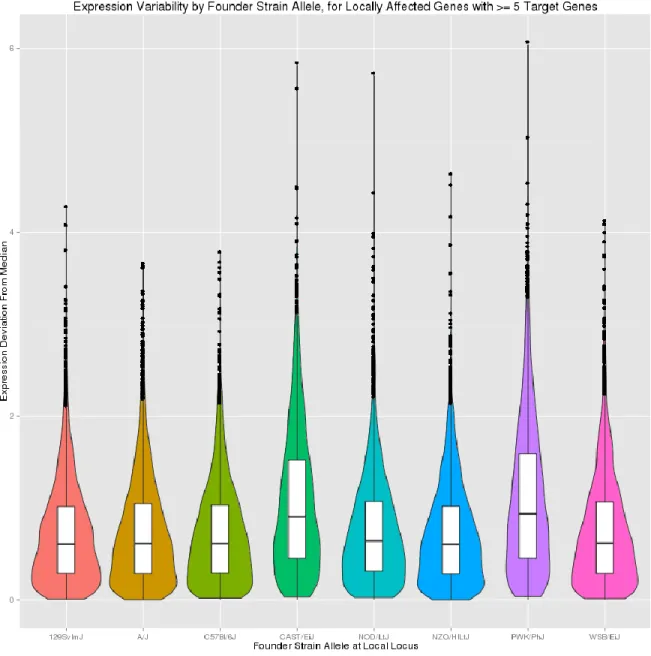
background showed more extreme expression variation than genes inherited from the other founder strains (Figure 2.11). Mice from the CC have been shown to be phenotypically diverse for various immune related phenotypes [73,74], body weight [75], and behavior [75], with variance for some traits exceeding that observed in the founder strains [75]. One plausible reason for this is that epistatic interactions between alleles inherited from distinct subspecies (castaneus, domesticus, and musculus) may severely mis-regulate gene expression and homeostasis. To investigate whether allele inheritance from different subspecies of origin led to more extreme expression for particular combinations of locally-acting eQTL alleles and target genes, we mapped both eQTL SNPs and target genes to their subspecies of origin. Since alleles inherited from PWK mice appeared to be driving extreme expression variation in locally-affected genes, we reduced the locally-affected set of genes to a subset of 61 genes for which the Mus musculus musculus-derived PWK allele explained at least half of the overall genetic effect on expression (Figure 2.12a). We observed that for these SNPs, expression ofdistally-linked genes showed differential variation based on the combinatorial genetic backgrounds of the locally-associated variant and target gene (Figure 2.12b).
These transcriptomic differences may in turn affect phenotype. Body weight for wild-derived founder strains (CAST/EiJ, PWK/PhJ, WSB/EiJ) used in the Collaborative Cross is lower than in classical laboratory strains [63]. A GO analysis performed for the 142 distal genes linking to the PWK-driven eQTL revealed annotation for various terms related to metabolism and lipid processes (Table 2.8). This enrichment suggests a possible role for the candidate trans acting factors in regulating weight, via a broad but subtle effect on gene expression.
Analysis of 69 human individuals
26
Ensembl transcripts in the top quartile based on median expression level for further analysis. Genotype data for the same individuals, consisting of 9.5 million SNPs, were obtained from HapMap phase 2 and 3, release 27.
Using a local regulatory window of 200kb, similar to the original analysis [45], we identified 2,483 transcripts (25.3%) with a local eQTL effect (FDR < 0.10). Of the 929 transcripts previously identified as having local associations at the same FDR, we replicated 538. The remainder not found consisted of transcripts that we removed from the data set due to low median expression level, with the exception of 3 transcripts that were not identified in our analysis. In addition, we identified 1,945 novel local associations, likely attributable to greater power resulting from testing only the most highly expressed quartile of transcripts.
NetLIFT identified 1,274 transcripts (13.0%) with at least one distal eQTL (FDR < 0.10, Figure 2.13). None were reported in the previous analysis [45]. A traditional all SNPs-vs-all genes testing approach on this filtered set of genes and variants yielded only 5 significant distal
associations at this FDR, indicating that our method is better powered for detecting these
associations. A GO analysis for the 64 candidate regulators that were linked to at least 3 transcripts (FDR < 0.1) again suggested enrichment for metabolic and biosynthetic processes (Table 2.9).
DISCUSSION
27
interaction evidence has been incorporated in the GWAS setting to identify epistatic effects on phenotype [78], suggesting that correlation based testing may increase power to detect associated variants. We described here a novel method, NetLIFT, that addresses the problems of
computational burden and power in traditional eQTL testing, by reducing the search space and using conditional dependencies between genes’ expression to prioritize variant-gene testing. The reduced multiple testing correction penalty under our algorithm allows detection of weaker eQTL effects that are missed by currently available methods. Furthermore, our results provide immediate interpretability of the mechanism of association, by highlighting potential regulatory genes that mediate discovered distal effects. We note that in the current implementation of our code, runtime and memory usage increases nonlinearly as the number of genes increases, and that the major bottleneck in runtime is the estimation of the partial correlation matrix. Therefore, when the number of genes exceeds 10,000, users may wish to filter gene expression data sets by most highly expressed or most variable genes.
Importantly, we showed through simulations that NetLIFT can identify instances where distal eQTL only affect a small number of genes, not just the large hub genes found by other methods. Additionally, candidate regulators that are putatively affected in cis by the causal variant can be identified, highlighting potential mechanisms of association. We note that since our method seeks to identify distal effects that arise via alterations in the expression level of trans-acting factors located nearby the eQTL, we are unable to detect associations mediated by a loss-of-function coding variant in the trans-acting factor.
28
provide clues as molecular underpinnings of downstream phenotypes such as reduced mouse size in the wild-type derived PWK mice. Lastly, in a set of 69 human individuals, NetLIFT was able to find over 1,200 gene transcripts with significant distal eQTL due to its increased power, whereas previously only 5 had been identified.
Intuitively, one might think that the best candidates for asserting regulatory influence on distal genes would be transcription factors that directly participate in controlling gene
transcription rates. In accordance with previous results, though, we found no enrichment for transcription factor annotation among genes implicated by our method as trans-acting factors; instead, we find that many of these genes play a role in metabolic and biosynthesis pathways. This suggests that more commonly, the regulation of key genes in these pathways play a role in
feedforward or feedback processes that then affect transcription rates of downstream target genes within the same pathway. These indirect effects are more subtle than the direct effects associated with local eQTL, but they can have significant effects on phenotypes, such as growth rates (seen in yeast) and size (seen in mouse).
29
30
32
Figure 2.2. Simulated gene module topologies. Each module’s expression effects were simulated by first generating the hub gene’s expression; each successive downstream gene’s expression values were simulated using the upstream gene’s expression as a baseline
33
Figure 2.3. Illustration of eQTL detection methods. SNP is depicted as a red node; genes
34
Figure 2.5. Number of detected distal associations, by module topology/method. Topology of each network module is depicted in header. Black nodes depict genes with an assignedlocal eQTL effect, and red nodes represent “true” distally-associated genes. Total number of “true”distal associations given in parentheses. Each cell value reports the mean and standard deviation of TP / FP, over the ten simulated data sets. Cells are colored according to fraction of true positives discovered. Rightmost column (bottom row) reports the number of false positivedistal associations where the locally-regulated gene and target gene belonged to disjoint modules.
36
37
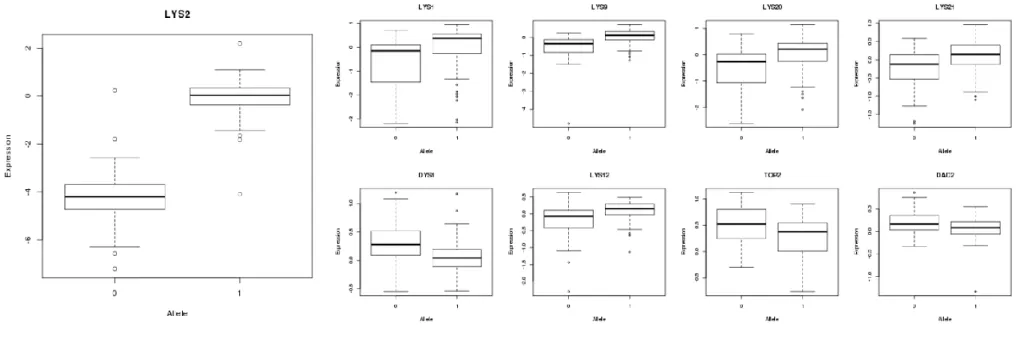
Figure 2.8. eQTL effects for LYS2 local regulatory variant and downstream genes. The allele associated with lower LYS2 expression (“0”) is associated with lower expression of known Lys14p targets LYS2, LYS1, LYS9, LYS20, and LYS21. The same allele also associates with higher expression of three non-LYS genes containing Lys14p binding motifs (DYS1, TOP2, DAD2), and the Lys14p motif-containing LYS12.
39
40
41
42
Figure 2.12. Expression variability for PWK-driven trans-acting factors and target genes, in pre-Collaborative Cross mice. Top: Distribution of absolute expression deviation from median, for putative trans-acting factors with a PWK-driven local eQTL, grouped by founder strain genetic background at the eQTL locus. Only putative trans-acting factors that were linked to at least 5 target genes on a different chromosome were considered. Bottom: Expression distribution for target genes of PWK-driven eQTL loci, stratified by subspecies of origin allele
43
44
Module Topology Mean(FracTP)±
sd(FracTP) Mean(FracFP)± sd(FracFP)
0.94±0.018 0.092±0.0047
0.79±0.015 0.16± 0.010
1±0 0.13± 0.025
1±0 0.14±0.022
1±0 0.17±0.036
1±0 0.22± 0.075
45
Method True Positive False Negative False Positive
NetLIFT 442 (100%) 0 20
AllvsAll 442 (100%) 0 20
Trigger 442 (100%) 0 1653
46
Method Module Num Associations
Needed to Attain FWER 0.05
Mean Number of Associations
Across Ten Simulations
Hotspot Detected
NetLIFT 3 66.4 10/10 (100%)
AllvsAll 1 1.6 4/10 (40%)
NetLIFT 3 39.3 10/10 (100%)
AllvsAll 1 0.9 6/10 (60%)
NetLIFT 3 9.0 10/10 (100%)
AllvsAll 1 0.2 2/10 (20%)
47 Numbe
r (%) FDR Distribution R2 Distribution Effect Size Distribution (β) Local 1124
(19.9% )
Distal 1642 (29.1%
)
48
Table 2.5. GO annotation enrichment for candidate regulators in yeast. GO analysis was performed for genes with >= 10 distal associations; top 20 enrichment terms reported in right column.
Pvalue Term
2.00E-06 asparagine catabolic process
5.89E-06 cellular response to nitrogen starvation 5.89E-06 cellular response to nitrogen levels 4.66E-05 asparagine metabolic process
4.90E-05 glutamine family amino acid catabolic process 0.000172 aspartate family amino acid catabolic process 0.001328 cellular response to nutrient levels
0.001784 response to nutrient levels
0.001784 cellular response to extracellular stimulus 0.001784 cellular response to external stimulus 0.002359 response to external stimulus
0.002359 response to extracellular stimulus 0.003704 cellular amino acid catabolic process
0.003936 developmental process involved in reproduction 0.004111 cellular response to starvation
0.005043 response to starvation
0.005191 amino acid transmembrane transport
0.005905 carbon catabolite regulation of transcription from RNA polymerase II promoter 0.005931 copper ion transport
49
TAF Chr Start Pos End Pos SNP Pos Growth FDR
50
AMN1 2 556543 558192 555596 0.0036 8.51E-31 307 ICS2 2 553537 554304 555787 NA 0.005304 317 TOS1 2 563198 564565 565216 0.0036 1.71E-08 291 EXO5 2 565718 567475 565216 NA 1.27E-06 10 SSE2 2 573910 575991 565216 NA 0.013449 29 SEC66 2 578359 578979 569414 NA 0.014054 289 UMP1 2 581721 582167 584351 0.0036 2.05E-06 268 NPL4 2 576339 578081 584351 0.0036 2.58E-06 268 GDT1 2 602629 603471 592989 NA 6.47E-05 273 PCH2 2 600548 602355 603790 NA 2.33E-05 291 RPL21A 2 606265 607135 603790 NA 0.013744 50 RPS9B 2 604503 605503 603790 NA 0.000455 1 YBR197C 2 615198 615851 616262 0.006255 7.18E-15 237 COS111 2 629163 631937 620056 NA 0.002184 230 SDS24 2 651410 652993 658746 NA 1.45E-05 13 GPX2 2 707523 708011 697894 0.012127 0.002294 205 GLK1 3 50838 52340 43867 NA 0.00023 1 ATG22 3 54941 56527 64311 NA 0.004837 42 FRM2 3 74704 75285 75021 NA 5.98E-06 106 HIS4 3 65934 68333 76127 NA 1.26E-05 104 NFS1 3 92777 94270 90412 NA 1.92E-20 31 LEU2 3 91324 92418 92127 NA 3.42E-71 113 ILV6 3 104619 105548 105042 NA 5.51E-05 93 RPS14A 3 177496 178216 175799 NA 0.016242 49 MATALPHA1 3 200438 200965 201166 NA 3.66E-48 40 MATALPHA2 3 199542 200174 201166 NA 2.85E-34 28 RSC6 3 214990 216441 210748 NA 5.46E-09 22 AHC2 3 258880 259266 258303 NA 8.80E-11 2 BRE4 4 38868 42245 46292 NA 1.40E-57 4
HO 4 46272 48032 46292 NA 3.46E-54 6
51
52
53
54
55
56
57
GLR1 16 375499 376950 368296 NA 6.30E-18 2 YPL067C 16 425248 425844 428612 NA 0.002836 3 SUR1 16 451906 453054 462646 NA 5.58E-07 34 SWI1 16 521011 524955 523450 NA 4.34E-19 40 IRC15 16 518732 520231 523450 NA 0.024603 7 SNF8 16 553624 554325 555416 NA 8.56E-23 2 YOP1 16 623524 624199 618581 NA 2.13E-08 3 AQY1 16 921856 922773 927500 NA 0.000119 3 ARR3 16 939918 941132 932535 NA 9.47E-12 4 OPT2 16 924300 926933 932535 NA 0.000184 6 ARR2 16 939275 939667 932535 NA 2.05E-05 1
58
Method eQTL Position TAF Previously Predicted Regulators
#
Targets GO Annotation Enrichment GO pVal Growth Rate FDR - Association
*** chrII:376668 TAT1 TRM7[79] 265 cytoplasmic
translation 9.63E-37 NA
*** chrII:555596 AMN1 AMN1[44,79],
MAK5[44] 307 biogenesis ribosome 2.90E-12 0.0036
*** chrII:697894 GPX2 None[44,79] 205 ncRNA
processing 1.53E-17 0.012
*** chrIII:92127 LEU2 LEU2[44,79–81] 113 organic acid
biosynthetic process
4.05E-25 NA
*** chrIII:105042 ILV6 ILV6[80,81] 93 organic acid
biosynthetic process
2.45E-22 NA
*** chrIII:201116 MATALPHA1 MATALPHA1[44,7
9,80,82] 40 response to pheromone 1.78E-08 NA
*** chrV:117056 URA3 URA3[44,79–81] 28 'de novo' UMP
biosynthetic process
8.66E-09 NA
*** chrVIII:111682 GPA1 GPA1[44,65,79,80
,82] 29 conjugation 1.14E-15 NA
*** chrXII:659357 HAP1 HAP1[44,65,79,80
,82] 29 steroid metabolic process 3.80E-09 NA
*** chrXII:1067121 YLR464W YRF1-4[79],
YRF1-5[79],YLR464[79]
15 telomere
maintenance via recombination
1.81E-05 NA
*** chrXIV:371953 NAM9 MKT1[80],
SAL1[80] 25 mitochondrial translation 1.55E-21 NA
*** chrXV:174364 PHM7 PHM7[80,81],
IRA2[65,82] 107 cellular ketone metabolic process
8.89E-08 NA
*** chrXV:382531 CRS5 CAT5[44,79] 11 cellular
respiration 3.77E-05 NA
** chrI:11638 SEO1 NA 17 monocarboxylic
acid metabolic process
1.11E-06 NA
** chrII:376872 NRG2 NA 32 asparagine
catabolic process 1.85E-06 NA
** chrII:401568 TEC1 NA 16 pseudohyphal
growth 1.03E-03 NA
** chrII:477206 LYS2 NA 167 lysine
biosynthetic process via aminoadipic acid
1.27E-07 NA
** chrIV:96259 HEM3 NA 21 cytokinesis
5.47E-04 NA
** chrIV:1149761 FCF1 NA 18 endonucleolytic
cleavage involved in rRNA processing
4.02E-04 NA
** chrV:420595 LCP5 NA 102 ncRNA metabolic
process 1.90E-13 NA
** chrV:504714 YER160C NA 19 DNA integration
6.65E-24 NA
** chrVII:402871 PRM8 NA 23 cellular zinc ion
homeostasis 5.72E-06 NA
** chrVII:916675 ZPR1 NA 27 ribosome

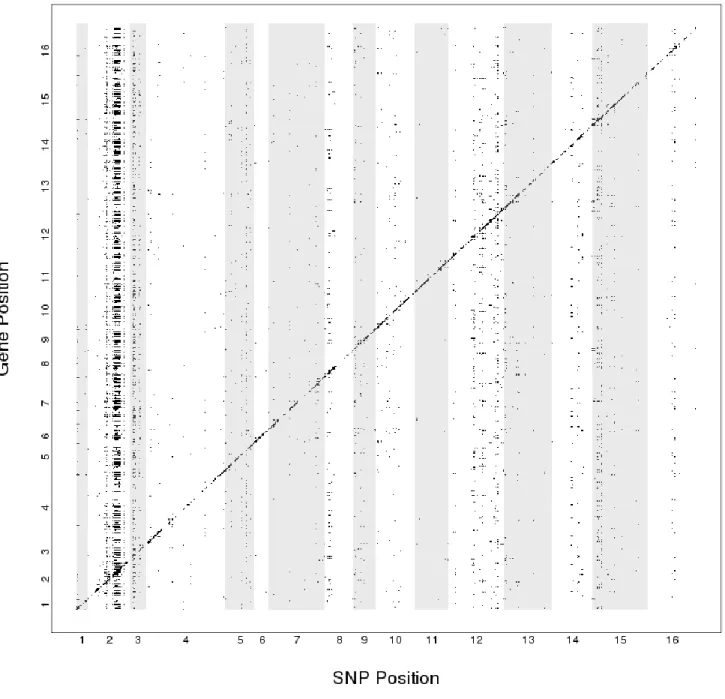
![Figure 2.7. Pairwise overlap of target gene sets enriched for ribosomal annotation. Cell [i,j]](https://thumb-us.123doks.com/thumbv2/123dok_us/8259131.2188162/50.918.115.799.161.804/figure-pairwise-overlap-target-enriched-ribosomal-annotation-cell.webp)