SUPPLEMENT SERIES
Astron. Astrophys. Suppl. Ser.142, 225–238 (2000)
A deep echelle survey and new analysis of diffuse interstellar
bands
?,??
S. ´O. Tuairisg1,2,3, J. Cami4, B.H. Foing2, P. Sonnentrucker2, and P. Ehrenfreund1
1 Leiden Observatory, P.O. Box 9513, 2300 RA Leiden, The Netherlands 2
Solar System Division, ESA Space Science Department, ESTEC/SO, 2200 AG Noordwijk, The Netherlands
3
Department of Physics, National University of Ireland Galway, Ireland
4 Astronomical Institute “Anton Pannekoek”, University of Amsterdam, Kruislaan 403, 1098 SJ Amsterdam, The Netherlands
Received October 30, 1998; accepted November 10, 1999
Abstract. We report a deep survey of diffuse interstellar bands (DIBs) between 3906 ˚A and 6812 ˚A under consistent observing conditions toward three very reddened and five unreddened stars. BD+63◦1964’s line-of-sight was shown to present exceptional DIB enhancement in number as well as in strength. The early spectral type of the star and the use of spectra of an unreddened comparison star of the same spectral type allowed to limit stellar line residuals. Using careful reduction and analysis methods we discov-ered 60 new DIBs which are confirmed in the reddened targets HD 183143 and BD+40◦ 4220. We detected 25 possible DIBs which still await further confirmation, but we did not detect or confirm 28 previously reported DIBs. The present survey with 226 confirmed DIBs, measured in three targets allows a detailed and homogeneous statistical analysis on the distribution of DIB widths and intensities.
Key words: ISM: general — ISM: molecules
1. Introduction
Superimposed on the extinction curve are a huge number of absorption lines, the diffuse interstellar bands (DIBs). The identification of the DIB carriers remains an im-portant problem in astronomy. The current number of
∼200 DIBs is still increasing, suggesting that more than 400 DIBs down to the confusion limit could be detected in the interstellar medium. The development of DIB research in recent years indicates that most DIB carriers could
Send offprint requests to: P. Ehrenfreund
? Based on observations at Observatoire Haute Provence with the spectrograph ELODIE.
??
Figures 6 to 40 are only available in electronic form at http://www.edpsciences.org
be large carbon-bearing molecules which reside ubiqui-tously in the interstellar gas (see Herbig 1995 for a review, Salama et al. 1996). The first detection of substructures in the profile of several DIBs indicated the molecular nature of some DIB carriers (Sarre et al. 1995; Ehrenfreund & Foing 1996). Foing & Ehrenfreund (1994, 1997) observed two DIBs at 9577 and 9632 ˚A as first evidence for C60+,
the largest molecule ever detected in space. A survey of DIB correlations over 4000 ˚A showed that most of the DIB carriers are undergoing photo-ionization and that all measured DIBs do originate from different carriers (Cami et al. 1997).
Recently many laboratories, theoreticians and observa-tional astronomers showed combined efforts to solve the long-standing mystery of the DIBs and to identify their carriers. The spectra of PAH and fullerene cations, mea-sured in a Neon matrix, carbon chains meamea-sured in the gas phase and theoretical calculations of the non-linear H2
-DIB model have all shown some coincidences with some diffuse bands (see Salama et al. 1996; Foing & Ehrenfreund 1997; Freivogel et al. 1994; Sorokin et al. 1996; Ubachs et al. 1997; Tulej et al. 1998).
Another approach to identify the DIB carriers is to study the complete DIB spectrum in different interstellar and circumstellar regions and to relate the line-of-sight conditions directly to the formation/evolution and de-struction properties of DIB carrier molecules. Additional observations of spectral molecular features such as CH, CH+, CN (as well as atomic lines CaI, CaII, NaI) reveal
regions. Their central wavelength is extremely con-stant. The band strength of the strongest DIBs (such as the 5780 and 5797 ˚A DIBs, which are measured towards more than 200 sources) does not change by more than a factor ∼2. The relative DIB strength,
W/E(B−V), seems to reflect an interplay between
ionization and recombination/destruction of the DIB carrier molecules. Even the high resolution profile of the 6613 ˚A DIB, which shows a characteristic triple peak, displays only slight changes in different environments.
A new reference target for DIB studies was recently detected, which shows the strongest DIBs ever measured and allows to define the DIBs in several categories which respond in totally different ways to the local environment (Ehrenfreund et al. 1997). We discuss the optical survey towards the star BD+63◦ 1964 which led to the detec-tion of 60 new DIBs. We present the complete DIB spec-trum between 3906 and 6812 ˚A of BD+63◦1964 and two other heavily reddened reference targets, HD 183143 and BD+40◦ 4220, and discuss the statistics of the confirmed DIBs.
2. Previous DIB surveys
In recent years the number of known DIBs has experi-enced considerable growth. This rapid increase is due to the improvement of CCDs and higher resolution instru-ments in the optical range. Herbig (1975) announced a to-tal of 39 identified diffuse interstellar bands between 4400 and 6850 ˚A. In high signal to noise scans of reddened stars Herbig (1988) reported the discovery of 29 new lines be-tween 6767 and 6862 ˚A. In a later publication Herbig & Leka (1991) added 22 more DIBs to an ever-growing list. Most of these surveys concentrated on the star HD 183143. It was clear at this point that the main barriers in reveal-ing more DIBs was instrumental. To date, the largest DIB survey was reported by Jenniskens & D´esert (1994). This survey included all the previously identified DIBs, and yet higher resolution than before resulted in the identification of more DIBs. The survey, from 3800 ˚A to 8680 ˚A, revealed a total of 229 DIBs. This list included 153 certain DIBs as well as 76 probable and questionable DIBs. The survey covered a wider wavelength range than the present one of BD+63◦ 1964, but some regions of the spectrum were omitted in their data. A subsequent smaller survey, but using a resolution of 60 000 concentrated on several differ-ent wavelength regions (Krelowski et al. 1995). These were mostly∼80 ˚A windows centred at 5790 ˚A, 5915 ˚A, 6010 ˚A, 6250 ˚A, 6400 ˚A and 6665 ˚A. This survey resulted in the tentative identification of 42 weak DIBs. These DIBs were labeled either as certain or as doubtful DIBs.
The total number of diffuse interstellar bands iden-tified in the wavelength range 3800 ˚A to 6815 ˚A until now is 184, 103 of these being classified as “certain” by
Jenniskens & D´esert (1994). What makes this present sur-vey of these three reference targets both unique and nec-essary is: (i) the enhancement of narrow DIBs in BD+63◦ 1964, mentioned below, enabling us to confirm many of the weaker DIBs already reported, as well as to discover many new DIBs. (ii) Never before has there been a survey of diffuse interstellar bands from 3980 ˚A to 6820 ˚A in one echelle spectrum. To cover a wide wavelength range it was necessary for previous surveys to take a number of differ-ent exposures of the same stars over a period of several months. This created numerous complications such as dif-ferent seeing and telluric conditions, and calibration drifts, which do not arise in our data. We have analysed a consis-tent, deep exposure over the desired wavelength range of the star BD+63◦1964 which shows, to date, the strongest DIBs ever measured. (iii) We measured a number of unred-dened targets to optimize instrumental, telluric and stellar line corrections. (iv) The detected DIB candidates have been checked for confirmation in deep spectra of two very reddened targets, HD 183143 and BD+40◦ 4220, which have very different spectral types and rotation.
3. Observations and data reduction
3.1. ELODIE spectrograph performances
Observations were obtained on July 24th and November 8th, 1995 at the Observatoire de Haute Provence (OHP). We used the 1.93 m telescope, equipped with the spectro-graph ELODIE, which is a fiber-fed echelle spectrospectro-graph, covering the wavelength range from 3906 to 6811 ˚A with a resolution of ∼ 42 000 (Baranne et al. 1996). The fi-bres are POLYMICRO fifi-bres with a diameter of 100µm. The grating used is a 408×102 mm echelle grating with 31 grooves/mm and aθ= 76◦blaze angle. The dispersion crossing is done with two optical components, a 40◦ flint prism and a 8.63◦crown grism with 150 grooves/mm. The combination results in a constant interorder spacing over the 67 spectral orders. The detector is a back-illuminated Tk1024 CCD with 24 µm pixels, cooled to 183 K. At a readout of 100µs/pixel the typical readout noise is 8.5 e−. The CCD has a linear response up to 100 000 e−.
The preliminary reduction of the ELODIE data was performed on-line at the observatory. The normal CCD re-duction procedure was carried out, incorporating the cor-rection of bad-pixels and cosmic rays, and the subtraction of the bias and dark current. No systematic post-reduction deglitching was applied except for very obvious spikes.
3.2. The program stars and optimal reduction
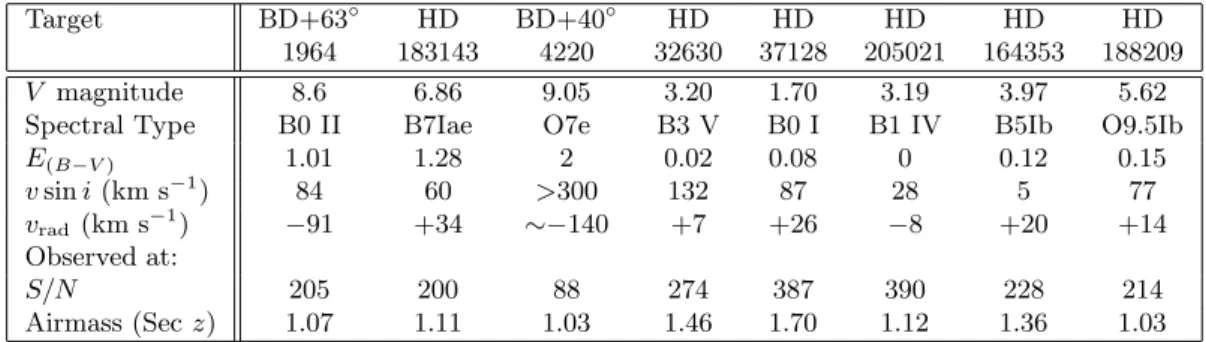
Table 1.Physical and observational parameters for the program stars used in the DIB survey. The radial and rotational velocities were determined from the spectra
Target BD+63◦ HD BD+40◦ HD HD HD HD HD
1964 183143 4220 32630 37128 205021 164353 188209
V magnitude 8.6 6.86 9.05 3.20 1.70 3.19 3.97 5.62
Spectral Type B0 II B7Iae O7e B3 V B0 I B1 IV B5Ib O9.5Ib E(B−V) 1.01 1.28 2 0.02 0.08 0 0.12 0.15
vsini(km s−1) 84 60 >300 132 87 28 5 77
vrad(km s−1) −91 +34 ∼−140 +7 +26 −8 +20 +14
Observed at:
S/N 205 200 88 274 387 390 228 214 Airmass (Secz) 1.07 1.11 1.03 1.46 1.70 1.12 1.36 1.03
with its comparable rotation and spectral type to BD+63◦ 1964 was used as the main stellar standard. HD 205021, a slow rotator, further enabled us to control the identifica-tion of stellar lines in BD+63◦1964. HD 32630 was used as a telluric standard.
BD+63◦ 1964, is a B0 II star and has therefore rel-atively few stellar lines. Nevertheless the spectrum has, especially towards the blue, some prominent stellar lines which hamper the detection and measurement of possi-ble new DIBs. Few stellar lines appear above 4800 ˚A where most of the diffuse interstellar bands are concen-trated. To distinguish DIBs from stellar lines the spec-trum of BD+63◦1964 was divided by the stellar standard HD 37128, which is a very good match in spectral type and rotational velocity. The resulting spectrum is charac-terised mostly by interstellar features, with a few residual stellar lines.
Telluric contamination limits the detection and mea-surement of DIBs and affects a significant fraction of our total wavelength range. The contamination is due to oxy-gen lines, mostly around the diffuse band at 6284 ˚A and water lines above 5800 ˚A. Although the oxygen column density remains stable throughout the observations, the H2O column density can vary slightly between exposures.
For telluric correction the bright star HD 32630 was cho-sen. To remove the atmospheric contamination the rela-tion below is used:
ITC=
I
I
z zt
t
I and It are the object spectrum and the telluric
stan-dard spectrum respectively.zzt is the ratio of the respective airmasses. The inaccuracy in airmass estimations usually requires some iterations to obtain the true ratio. In re-moving stellar lines from regions contaminated by telluric absorption, both BD+63◦ 1964 and HD 37128 were first divided by HD 32630.
The heavily reddened star BD+40◦ 4220 (E(B−V)=2)
and HD 183143 (E(B−V)=1.28), up to now the reference
star for studies of DIB behaviour, were used to add confir-mation to the newly detected DIBs in this present survey. HD 183143, a B7 star, has been used in previous DIB surveys (Herbig 1975; Jenniskens & D´esert 1994; Herbig
4000 5000 6000 0.8
0.85 0.9 0.95 1
Fig. 1.A synthetic spectrum of all 226 DIBs confirmed towards BD+63◦1964 between 3906 ˚A and 6812 ˚A
1995). BD+40◦4220 is a hot star (spectral type O7) with a fast rotation which is ideal for detecting weak DIBs, es-pecially in the visible and infrared. HD 164353 was used to identify stellar lines and remove telluric contamination in HD 183143, and HD 188209 was used as BD+40◦4220’s telluric standard. Due to slight reddening in the standards HD 164535 and HD 188209, the large DIBs at 6284 ˚A and 6283 ˚A in these stars incurred an additional error of∼10%. See Fig. 40 for samples of corrected and uncorrected tel-luric contamination in the target stars.
4. DIB measurement methods
5000 6000 -0.5
0 0.5 1 1.5
Fig. 2. A plot of Log10(F W HM) against wavelength for the
DIBs measured toward BD+63◦1964. A dominant population of DIB widths lies between 0.6 and 1.4 ˚A, more abundant to-wards the red and clustered around some ranges. A second population of medium-broad DIBs is apparent withF W HM between 1.4 and 3.2 ˚A. It also illustrates the clustering of some DIBs around “magic” wavelengths, at 550, 580 and 630 nm
1 10
0 10 20 30
Fig. 3.Histogram of Full Widths of DIBs in BD+63◦1964. This plot illustrates the three populations of DIBs discussed in the text: narrow DIBs, medium broad DIBs and broad DIBs
5000 6000 -2
-1 0
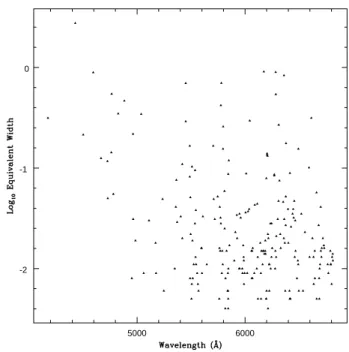
Fig. 4. A plot of Log10(EW) against wavelength for the DIBs
measured toward BD+63◦ 1964. This plot illustrates the in-creased number of DIBs detected for a given equivalent width towards the red, and the clustering of DIBs around 550, 580, and 630 nm
0.01 0.1 1
0 10 20
Analysis Facility) software package. Equivalent widths were obtained by integration of the pixel intensities within the region:
W =X
i
1− Ii
Ci
whereIiis the intensity at pixeliandCi is the continuum
level at pixeli. The central wavelength was estimated by calculating:
λc=
P
iλi(Ii−Ci)
3 2
P
i(Ii−Ci)
3 2
where λi is the wavelength of pixel i. Alternatively a
Gaussian profile can be fitted to the feature, resulting in the additional estimation of the full width at half max-imum. Accurately defining the continuum level, which is especially important in measuring medium-broad to broad DIBs, involves fitting a polynomial to the continuum and dividing it out of the spectrum.
Error estimates, using a model based on the Poisson statistics of the data, were also obtained using the IRAF package. An error estimate model is fit to the data using as input a constantσestimated from the statistics of the spectrum. A number of simulations are created in which random Gaussian noise is added to the noise-free spec-trum using the pixel sigmas from the noise model. The model fitting is done for each simulation and the absolute deviation of each fitted parameter to the noise-free model parameter is recorded. The error estimate for each pa-rameter is then calculated as that deviation, inside which contains 68.3% (1σ) of the parameter estimates.
The wavelengths of absorption bands of certain known molecular, atomic and ionic species (Ca II, Ca I, CH and CH+) residing in the line of sight towards BD+63◦ 1964
were measured and the shift in wavelength between those lines and their values recorded in the laboratory was cal-culated. The sodium lines at 5890 ˚A and 5895 ˚A were satu-rated and so were not included in these calculations. Under ideal conditions the velocity shift would be identical for all lines. However the presence of at least two main clouds of similar column densities and of different velocities (the ve-locity difference between two substructures in the molec-ular absorption line was measured to be ∼8 km s−1) in
the line of sight of BD+63◦ 1964 and the resulting two-component structure of the interstellar lines limited the estimation of the correct wavelength to an accuracy of
∼0.05 ˚A. The average central wavelengths of the interstel-lar lines were measured and an average of the velocity shift of 19.5±0.5 km s−1was obtained based upon these
mea-surements. The DIBs’ measured wavelengths were then shifted by this amount to provide reliable laboratory wave-lengths.
5. Selection criteria for new DIBs
Despite the high quality of BD+63◦ 1964’s spectrum, the presence of weak spurious absorption features, including
uncorrected or poorly corrected bad pixels and cosmic rays, atmospheric residuals left after the telluric correction and mismatches in stellar abundances between BD+63◦ 1964 and HD 37128, results in the need for strong and consistent criteria for the positive identification of new DIBs. We checked that new DIBs could not be ascribed to such spurious features.
5.1. The standard stars and synthetic stellar spectrum
Although standard stars HD 37128 and HD 205021 were used to identify and eliminate stellar lines from our tar-get spectrum, we have additionally produced a synthetic spectrum using the TLUSTY and SYNSPEC software (a stellar atmospheres model and emergent line synthesis package) to confirm the DIB identification.
The synthetic stellar spectrum together with the spec-tra of the standard stars HD 205021 and HD 37128 allowed the identification of stellar lines to very good accuracy in the star BD+63◦ 1964. Some residual absorption in the divided spectrum which coincided exactly in wavelength with strong or moderate stellar lines together with a band width comparable to the rotational velocity of BD+63◦ 1964 were ascribed to slight mismatches in stellar abun-dances between HD 37128 and BD+63◦ 1964 and thus were not due to bona fide DIBs in the line-of-sight.
5.2. The presence of new DIBs in other reference targets
The most important test of new DIBs are their occurence in other well known reddened stars. The large number of DIBs detected toward BD+63◦ 1964 may be exceptional and some DIBs might possibly only be observed in such hot and heavily reddened targets. Nevertheless the consid-erable strength of several DIBs suggested they might be visible in other stars. As previously mentioned HD 183143 and BD+40◦ 4220 were chosen as our DIB reference tar-gets. The latter was selected due to its very reddened line-of-sight, and HD 183143 is a well known DIB source and a main target of the DIB survey by Jenniskens & D´esert (1994) and Herbig (1995). HD 183143 (spectral type B7 I) suffers from some stellar line contamination and BD+40◦ 4220 (spectral type O7) has a faint visible magnitude of 9.05. For BD+40◦4220 we could therefore obtain a spec-trum with a signal-to-noise ratio of only 88 inV but rising to 170 in the red.
6. Results
6.1. Spectral displays and table
Figures 6 to 39 display the ELODIE echelle spectral or-ders of BD+63◦1964, BD+40◦4220 and HD 183143 over the wavelength range 3906−6812 ˚A. BD+63◦1964’s asso-ciated standard stars, HD 205021 and HD 37128, are also shown for the identification of stellar lines. BD+63◦1964’s telluric standard, HD 32630, is shown in a separate box. Also plotted is the spectrum of BD+63◦1964 corrected for stellar lines (divided by HD 37128). A synthetic spectrum of all DIBs seen in this survey of BD+63◦ 1964 is also included to easily identify confirmed DIBs. When neces-sary, a telluric correction was applied. This is indicated in the figure caption. Table 4 lists all the diffuse interstellar bands positively identified toward BD+63◦1964.
6.2. New DIBs
The 60 new DIBs discovered in BD+63◦ 1964 do not seem to adhere to any general pattern. They are spread throughout the spectrum, although occasionally clusters of new DIBs arise, and a slight bias can be seen towards the red end of the spectrum. The wavelength range be-tween 6140 ˚A and 6200 ˚A is an example of a region with many new weak DIBs blended with the very broad 6173 ˚A DIB. The vast majority of the new DIBs are weak, nar-row features, although some medium-broad DIBs are also reported. This is probably because the ELODIE spectro-graph is not suited for the detection of very broad DIBs due to each order’s relatively narrow wavelength coverage and the difficulty in merging adjacent orders. Few new DIBs are seen at shorter wavelengths. There are three rea-sons that could account for this:
– The spectrograph is not as sensitive at shorter wave-lengths, where the reddened target is fainter. The noise level is much higher, especially at the beginning of each order;
– The blue range is also dominated by stellar lines, which does not ease a DIB search in that region;
– There are fewer DIBs at a given equivalent width in this wavelength region. DIBs are undoubtedly concen-trated towards the red end of the spectrum (this is discussed further in Sect. 7).
6.3. Undetected DIBs mentioned in previous surveys
Some DIBs previously identified in other surveys were not included in the list of DIBs identified in BD+63◦ 1964’s spectrum. Some appeared to be completely absent, or not rising above the noise level of the spectrum. Others were so weak that, taking into account flat-fielding deviations and other spurious absorptions, the absolute confirmation
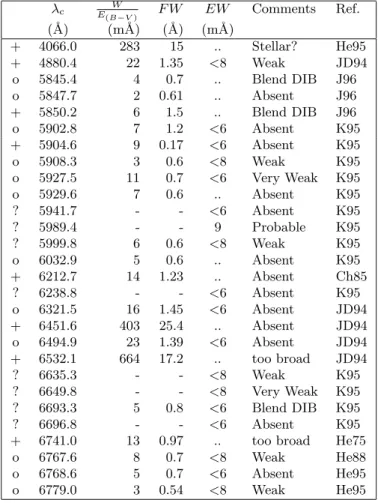
Table 2. Previously reported Diffuse Interstellar Bands that could not be detected or reliably measured in BD+63◦ 1964 and which are not included in the present survey of DIBs. “+” and “o” denotes the classification of certain and probable DIBs according to Jenniskens & D´esert (1994).“?” denotes Krelowski’s “doubtful” DIBs. The second column lists the DIB central wavelength quoted by the references given. The next two Col. contain data on these DIBs quoted from measurements by Jenniskens at http://www-space.arc.nasa.gov/∼leonid/DIBcatalog.html. The fourth column (EW) shows upper limits as measured in our spec-trum of BD+63◦1964 to be compared with Col. 2. See Table 4 for Reference codes
λc E W
(B−V) F W EW Comments Ref. (˚A) (m˚A) (˚A) (m˚A)
+ 4066.0 283 15 .. Stellar? He95
+ 4880.4 22 1.35 <8 Weak JD94
o 5845.4 4 0.7 .. Blend DIB J96
o 5847.7 2 0.61 .. Absent J96
+ 5850.2 6 1.5 .. Blend DIB J96
o 5902.8 7 1.2 <6 Absent K95
+ 5904.6 9 0.17 <6 Absent K95
o 5908.3 3 0.6 <8 Weak K95
o 5927.5 11 0.7 <6 Very Weak K95
o 5929.6 7 0.6 .. Absent K95
? 5941.7 - - <6 Absent K95
? 5989.4 - - 9 Probable K95
? 5999.8 6 0.6 <8 Weak K95
o 6032.9 5 0.6 .. Absent K95
+ 6212.7 14 1.23 .. Absent Ch85
? 6238.8 - - <6 Absent K95
o 6321.5 16 1.45 <6 Absent JD94
+ 6451.6 403 25.4 .. Absent JD94
o 6494.9 23 1.39 <6 Absent JD94 + 6532.1 664 17.2 .. too broad JD94
? 6635.3 - - <8 Weak K95
? 6649.8 - - <8 Very Weak K95
? 6693.3 5 0.8 <6 Blend DIB K95
? 6696.8 - - <6 Absent K95
+ 6741.0 13 0.97 .. too broad He75
o 6767.6 8 0.7 <8 Weak He88
o 6768.6 5 0.7 <6 Absent He95
o 6779.0 3 0.54 <8 Weak He95
of these features as DIBs was not possible from our data. Certain very broad DIBs extending over wavelength re-gions which span two or more orders have been omitted due to the insufficient quality of order merging.
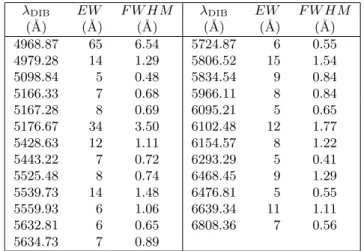
Table 3. Possible additional Diffuse Interstellar Bands in BD+63◦ 1964. These DIBs have yet to be confirmed. Central wavelength, equivalent width (EW) and full width at half maximum (F W HM) are listed
λDIB EW F W HM λDIB EW F W HM
(˚A) (˚A) (˚A) (˚A) (˚A) (˚A)
4968.87 65 6.54 5724.87 6 0.55
4979.28 14 1.29 5806.52 15 1.54
5098.84 5 0.48 5834.54 9 0.84
5166.33 7 0.68 5966.11 8 0.84
5167.28 8 0.69 6095.21 5 0.65
5176.67 34 3.50 6102.48 12 1.77
5428.63 12 1.11 6154.57 8 1.22
5443.22 7 0.72 6293.29 5 0.41
5525.48 8 0.74 6468.45 9 1.29
5539.73 14 1.48 6476.81 5 0.55
5559.93 6 1.06 6639.34 11 1.11
5632.81 6 0.65 6808.36 7 0.56
5634.73 7 0.89
H-α line. The absence of a third DIB, at 6451 ˚A, could possibly be due to its extension over two orders. This DIB however is not visible even when an optimal merging of the orders is obtained. The rest of the “certain” DIBs, except for one, are either too weak to be accurately mea-sured or else absent from the spectrum. The remaining one, at 5850.2 ˚A, positively identified by Jenniskens et al. (1996), is absent because the resolution of the ELODIE spectrograph, at 42 000, is not sufficient to distinguish this very weak DIB from the stronger and broader band at 5849.8 ˚A. It was detected with the AURELIE spectro-graph at Observatoire d’Haute Provence, France, which has a resolution in excess of 50 000 (Jenniskens et al. 1996). Alternatively this is just a red wing of the 5849.8 ˚A DIB. All the remaining DIBs not included in the survey have previously been classified as either probable or doubtful.
6.4. Possible additional DIBs to be confirmed
The spectrum of BD+63◦1964 provides us with a unique opportunity for finding and measuring new diffuse inter-stellar bands. The fact that previously known narrow DIBs are enhanced by a factor of 1.5−3 toward this target lends credence to this. An absorption band has to fulfill certain criteria as mentioned in Sect. 5 before it can be considered as a new DIB.
The wealth of interstellar features in BD+63◦ 1964’s spectrum has resulted in the discovery of 60 new “cer-tain” DIBs based upon these criteria. There seems to be no doubt that this number is limited by the signal to noise of the present data and the magnitude V = 8.6 for this exceptional target. However this seems one of the best tar-gets for DIB surveys when studied with cross-dispersed echelle spectrographs on 2 m class telescopes. It is likely that an analysis of more spectra of higher quality and
using a larger telescope would result in the positive de-tection of many more diffuse bands. In searching BD+63◦ 1964’s spectrum for new DIBs a number of weak absorp-tion features which are probably of interstellar origin were listed. They did not fulfill the necessary criteria to be in-cluded as “certain” DIBs in this particular survey. In some cases the uncertainty was due to blended stellar lines or atmospheric lines, or stellar lines in HD 205021 at the wavelength corresponding to that of the suspect DIB coin-ciding with stellar lines in the synthetic stellar spectrum. In other cases it was difficult to distinguish the feature from localised random noise. Table 3 lists these possible DIBs.
The interest of the present survey comes from the ex-ceptional quality of the spectrum of the line-of-sight of BD+63◦ 1964, with additional confirmation provided by spectra of the very reddened targets HD 183143 (a B7 star with a slow rotation) and BD+40◦ 4220 (a hot O7 star with a fast rotation). Due to the unusual enhance-ment of DIBs in BD+63◦ 1964 we could not confirm the existence of 25 possible DIBs in the other targets. To con-firm or reject these possible DIBs one needs to observe higher signal-to-noise spectra of reddened stars. Those DIBs listed as possible could then be cross-checked with other stars.
7. Statistics on the DIB population
7.1. DIB distribution vs wavelength
In the previous section we discussed the identification of 226 diffuse interstellar bands in the line-of-sight of BD+63◦ 1964 with added confirmation in two other red-dened reference targets and the possible detection of a number of others. Figures 2 and 4 show the distribution of both full widths and equivalent widths of all certain DIBs in the wavelength range of the survey. The blue end of the spectrum is characterised by both a lack of nar-row DIBs and an increased abundance of broad DIBs. We rule out the possibility that this could be an instrumen-tal bias. The lower sensitivity and increased abundance of stellar lines in the blue have already been discussed. The sensitivity limit for the survey can be estimated from the expression:
σEW =
√
2∆λF W HM S N
·
Assuming a Full Width at half maximum of typically 1 ˚A, for instance, we find that the sensitivity limit in the equivalent width is homogeneous from 4500 ˚A to 6500 ˚A. Applying a 5σconfidence level would lead to the detection of DIBs with an equivalent width>12 m˚A. The equivalent width of a DIB is wavelength-dependent,
whereN is the column density of the carrier andf is the oscillator strength (Spitzer 1978). The DIBs in the red are obviously favoured. If constant column density and oscilla-tor strength are assumed, a DIB with an equivalent width of 15 m˚A at 6000 ˚A would have an equivalent width of 9 m˚A at 4500 ˚A. This is however not sufficient to explain the lack of narrow DIBs we see in the blue. A physical explanation must be invoked to explain this phenomenon. Possible explanations might be that stronger and sharper fundamental transitions of large molecules occur in the red while secondary transitions in the blue are broadened due to limited lifetimes in excited levels of molecules (in-tercoupling between vibronic states).
We therefore find that the survey is homogeneously complete with narrow DIBs stronger than 15 m˚A. The broader DIBs are not only concentrated towards shorter wavelengths. There is a second visible group of medium-broad to medium-broad DIBs around 6200 ˚A. The pattern of DIBs also seems to involve some clustering. Five clusters of narrow DIBs, four of which gather around one or more broader ones, can be seen above 5500 ˚A.
7.2. Histograms of DIB widths and intensities
Figures 3 and 5 show histograms depicting the spread of both full widths and equivalent widths of DIBs mea-sured in BD+63◦ 1964. We can distinguish three pop-ulations of DIBs according to their F W HM. The most abundant are those whose widths lie between 0.6 ˚A and 1.4 ˚A (narrow DIBs). Medium-broad DIBs are seen be-tween a width of 1.4 ˚A and 3.2 ˚A, and broad DIBs, broader than 3.2 ˚A do not show any dominant value in the histogram. It is clear that very broad DIBs are not com-pletely surveyed, not only due to their difficulty of detec-tion in echelle orders, but also due to their lower contrast (for a given Equivalent Width), their blend and mutual confusion with other features. However only very clearly defined DIBs would present an interest in terms of identi-fication. The distribution of full widths at half maximum gives direct information on physical properties of the car-riers (e.g. molecular rotational contours for narrow DIBs and lifetime broadening for some of the broad DIBs).
The corresponding plot of the equivalent width distri-bution on the contrary (considering the statistical disper-sion) does not show any preferred equivalent width above the sensitivity cut-off. This is because the equivalent width is a product of three variables, the carrier column density,
N, the transition oscillator strength,f, andλ2, which take
a wide and continuous range of values, with independent statistics.
8. Conclusions
8.1. New detections and DIB statistics
Figure 1 shows a composite spectrum of all DIBs seen toward the reddened targets in the wavelength range 3906−6812 ˚A. The detection of 60 new DIBs raised the total number of DIBs to 226 in this line-of-sight, along with 25 possible DIBs awaiting confirmation. A statistical analysis on the DIB population has clarified the presence of three main DIB groups based on their band widths and has illustrated the clustering of DIBs in selected wave-length bands.
8.2. The enhancement of DIBs in BD+63◦ 1964 vs. other reference targets
This survey of diffuse interstellar bands in the optical range has confirmed earlier reports of the unique nature of BD+63◦1964 compared to other heavily reddened tar-gets, such as HD 183143 and BD+40◦ 4220 (Ehrenfreund et al. 1997). What mechanism could cause this unusual enhancement in DIB strengths and lead to the identifica-tion of many more hitherto undetected DIBs? The Ca II absorption lines at 3933 and 3968 ˚A, as well as the CH band at 4300 ˚A seem to indicate at least two clouds of different velocities in the line-of-sight of BD+63◦1964. In order to understand the DIB behaviour, models of diffuse clouds have been performed using information on various atomic and molecular species residing in the line-of-sight toward BD+63◦ 1964. The models indicate that the line-of-sight toward this target passes through a cloud edge where ultra-violet radiation may trigger the ionization of DIB carriers (Tuairisg et al. 2000). Further modeling and observational efforts are required to constrain the environ-mental conditions in this exceptional line-of-sight.
8.3. Future work
Higher signal-to-noise spectra of BD+63◦1964 and other reddened targets would undoubtedly confirm many of the possible DIBs listed in Table 3, and possibly lead to the de-tection of more new DIBs. Important further work would be to complement this work with a comprehensive survey of DIBs in the near infra-red. Observations taken with the INT/MUSICOS spectrograph are currently under analy-sis. As previously mentioned, the ELODIE spectrograph has limitations for a survey of broader DIBs. Further ob-servations of reddened targets using more suitable spec-trographs to detect broad DIBs, are also desirable.
between 5400 and 6800 ˚A, we find on average one DIB ev-ery 6 ˚A. Therefore any identification in this range based only on wavelength coincidence could be obtained by pure chance and additional criteria for identification are neces-sary, such as multiple bands, band widths, DIB strength ratios and correlated variations in different environments (Ehrenfreund & Foing 1995; Herbig 1995).
Follow-up studies of the surveyed DIBs by high resolu-tion spectroscopy and the physical properties of the line-of-sight conditions will further help to reveal the nature of DIB carriers.
Acknowledgements. We thank the staff at OHP for their help during the observations. PE is a recipient of an APART fellow-ship. S ´OT acknowledges support for a research stage at ESA Space Science Department.
References
Baranne A., Queloz D., Mayor M., et al., 1996, A&AS 119, 373-390
Beals C.S., Blanchet G.H., 1937, PASP 49, 224
Cami J., Sonnentrucker P., Ehrenfreund P., Foing B.H., 1996, A&A 326, 822
Chlewicki G., 1985, Observational constraints on multimodal Interstellar Grain Populations. Thesis Leiden University Chlewicki G., Groot M.S., Van der Zwet G.P., Greenberg J.M.,
Alvarez P.P., Mampaso A., 1987, A&A 173, 131
Ehrenfreund P., Foing B.H., 1995, Planetary Space Sci. 43, 10/11, 1183
Ehrenfreund P., Foing B.H., 1996, A&A 307, L25
Ehrenfreund P., Cami J., Dartois E., Foing B.H., 1997, A&A 318, L28
Ferlet R., Roueff E., Horani M., Rostas J., 1983, A&A 125, L5
Ferlet R., Dennefeld M., 1984, A&A 138, 303 Foing B.H., Ehrenfreund P., 1994, Nat 369, 296 Foing B.H., Ehrenfreund P., 1997, A&A 317, L59
Freivogel P., Fulara J., Maier J.P., 1994, ApJ 431, L151-L154 Hayden-Schmitt W., Snow T.P., Jura M., Cochran W.D.S.,
1981, ApJ 248, 128
Heger M.L., 1922, Lick Obs. Bull 10, 146 Herbig G.H., 1966, Zs. f. Astrophys. 64, 512
Herbig G.H., 1967, in: Radio Astronomy and the Galactic System, IAU Symp. 31, van Woerden H. (ed.), p. 85 Herbig G.H., 1975, ApJ 196, 129
Herbig G.H., 1988, ApJ 331, 999 Herbig G.H., 1995, ARA&A 33, 19
Herbig G.H., Leka K.D., 1991, ApJ 382, 193 Hobbs L.W., 1984, ApJ 280, 132
Jenniskens P., D´esert X., 1993, A&A 274, 465 Jenniskens P., D´esert X., 1994, A&AS 106, 39
Jenniskens P., Porceddu I., Benvenuti P., Desert F.-X., 1996, A&A 313, 649-656
Krelowski J., Sneden C., Hiltgen D., 1995, Planetary and Space Sci. 43, 1195-1203
Merrill P.W., 1934, PASP 46, 206
Salama F., Bakes E.L.O., Allamandola L.J., Tielens A.G.G.M., 1996, ApJ 458, 621
Sanner F., Snell R., Vanden Bout P., 1978, ApJ 226, 460 Sarre P.J., Miles J.R., Kerr T.H., Hibbins R.E, Fossey S.J.,
Somerville W.B., 1995, MNRAS 277, L41 Sorokin P., Glownia J.H., 1996, ApJ 473, 900
Spitzer L., 1978, Physical Processes in the Interstellar Medium. Wiley, New York
Tulej M., Kirkwood D.A., Pachkov M., Maier J.P., ApJ 506, L69-L73
Tuairisg S. ´O., Spaans M., Ehrenfreund P., Foing B.H., 2000 (in preparation for A&A)
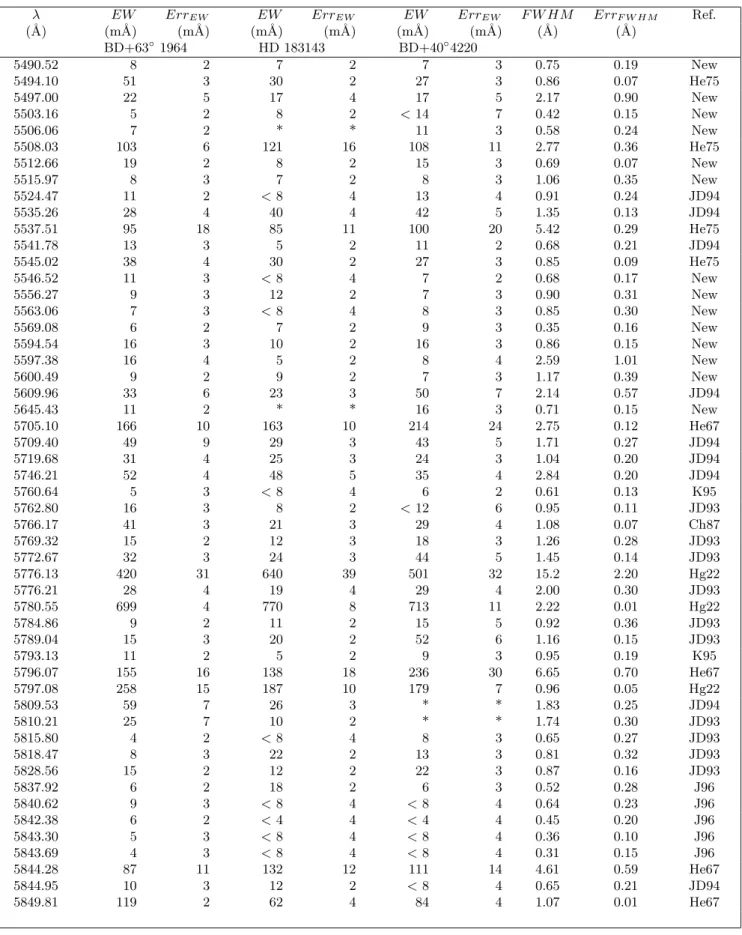
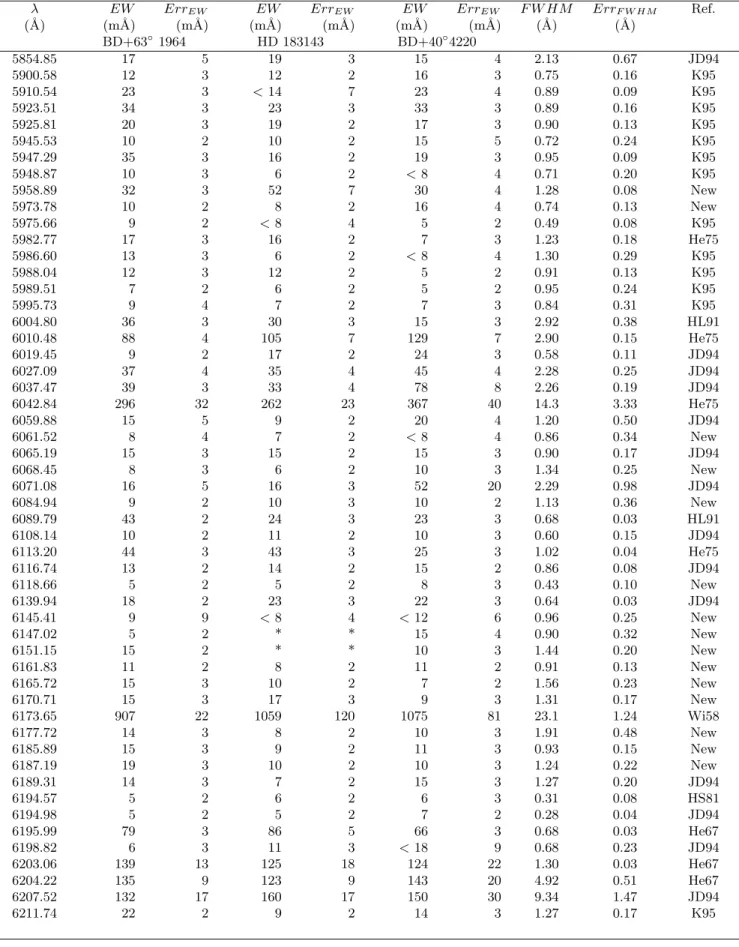
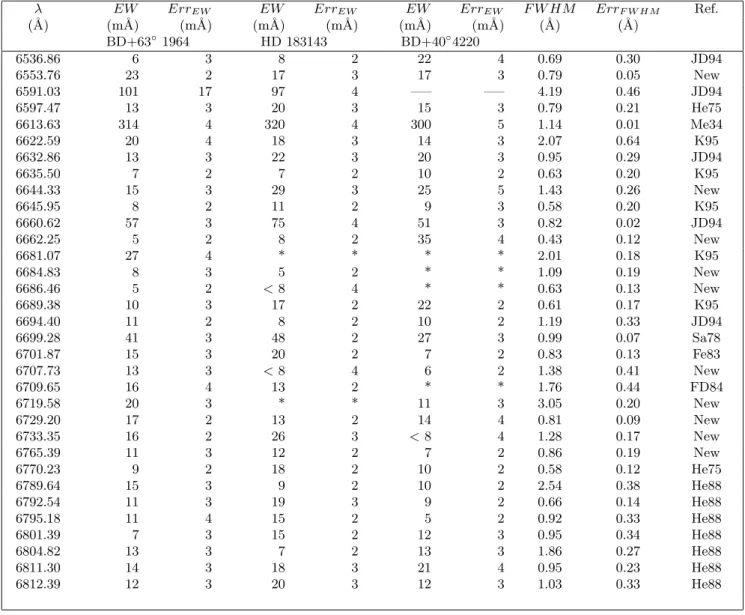
Table 4. Confirmed Diffuse Interstellar Bands measured towards BD+63◦ 1964, HD 183143 and BD+40◦ 4220. The first Col. (λ) gives the central absolute wavelength (in air) after correcting for the cloud velocity shift.EW denotes the diffuse band equivalent width measured in the spectra of the reddened targets (tellurically corrected where necessary, as indicated in Fig. 6 through to Fig. 39). Errors for these values are denotedErrEW.F W HMdenotes the full width at half maximum of the DIBs. Errors for these values are denoted ErrF W HM. The final Col. (Ref.) cites the source of the first identification of the DIB in other targets. New DIBs are denoted by “New”. Due to BD+63◦1964’sE(B−V) of 1.01 normalisation to unit reddening is not
necessary. DIBs which could not be measured due to stellar line contamination are marked with an asterisk (*). A horizontal line denotes the absence of a DIB in the spectrum. Reference codes are: Hg22 - Heger (1922), Me34 - Merrill (1934), BB37 Beals & Blanchet (1937), Wi58 Wilson (1958), He66 Herbig (1966), He67 Herbig (1967), He75 Herbig (1975), Sa78 Sanner et al. (1978), HS81 HaydenSchmitt et al. (1991), F83 Ferlet et al. (1983), FD84 Ferlet & Dennefeld (1984), Ho84 Hobbs (1984), Ch85 Chlewicki (1985), Chl87 Chlewicki (1987), He88 Herbig (1988), HL91 Herbig & Leka (1991), JD93 -Jenniskens & D´esert (1993), JD94 - Jenniskens & D´esert (1994), K95 - Krelowski et al. (1995), J96 - Jenniskens et al. (1996)
λ EW ErrEW EW ErrEW EW ErrEW F W HM ErrF W HM Ref.
(˚A) (m˚A) (m˚A) (m˚A) (m˚A) (m˚A) (m˚A) (˚A) (˚A) BD+63◦1964 HD 183143 BD+40◦4220
4175.46 314 81 450 95 —– —– 17.2 5.22 JD94 4427.96 2760 120 2470 100 2236 250 17.5 1.24 BB37 4501.65 214 10 160 22 127 60 3.55 0.16 He66 4593.93 891 45 545 150 780 110 27.6 2.21 JD94
4666.65 125 7 54 10 —– —– 6.61 0.38 JD94
4726.35 117 7 107 6 204 43 1.70 0.08 He75
4728.35 50 4 41 5 74 23 1.54 0.12 He75
4762.57 143 5 140 5 76 7 2.89 0.16 He75
4764.66 546 55 450 109 1020 250 29.0 3.56 He75
4780.10 55 4 53 3 59 5 1.74 0.22 He75
4825.94 347 27 377 65 —– —– 20.4 2.17 JD94 4882.56 466 20 950 60 1900 350 14.9 0.76 Wi58
4951.05 8 2 6 2 5 2 0.67 0.11 New
4963.03 218 12 239 110 540 200 21.3 2.70 JD94
4963.89 31 3 24 2 54 4 0.71 0.08 JD94
4984.78 19 2 8 3 14 3 0.67 0.16 JD94
5038.59 344 33 421 105 541 150 26.9 2.50 JD94
5061.56 9 2 10 2 10 5 0.64 0.15 New
5110.81 30 6 45 10 35 16 2.45 0.51 JD94
5170.69 18 3 * * 10 50 0.87 0.18 New
5176.00 9 2 11 2 13 4 0.76 0.20 New
5236.34 49 3 51 23 34 7 1.95 0.10 New
5247.91 6 3 6 2 22 8 0.39 0.20 New
5349.16 10 3 8 2 15 3 1.16 0.47 New
5359.58 41 9 52 11 55 10 3.92 0.77 He67
5363.78 76 7 124 10 130 20 2.54 0.24 JD94
5370.36 29 4 11 3 15 5 3.25 0.61 New
5404.52 33 2 41 2 30 4 1.06 0.08 He75
5418.39 109 9 89 12 —– —– 8.85 0.39 He75
5419.05 20 2 12 3 25 5 1.07 0.11 New
5449.76 290 12 345 34 242 40 9.53 0.50 He75 5450.95 696 22 444 150 619 100 31.2 1.46 JD94
5487.54 82 8 67 4 111 20 2.51 0.32 He75
Table 4.continued
λ EW ErrEW EW ErrEW EW ErrEW F W HM ErrF W HM Ref. (˚A) (m˚A) (m˚A) (m˚A) (m˚A) (m˚A) (m˚A) (˚A) (˚A)
BD+63◦1964 HD 183143 BD+40◦4220
5490.52 8 2 7 2 7 3 0.75 0.19 New
5494.10 51 3 30 2 27 3 0.86 0.07 He75
5497.00 22 5 17 4 17 5 2.17 0.90 New
5503.16 5 2 8 2 <14 7 0.42 0.15 New
5506.06 7 2 * * 11 3 0.58 0.24 New
5508.03 103 6 121 16 108 11 2.77 0.36 He75
5512.66 19 2 8 2 15 3 0.69 0.07 New
5515.97 8 3 7 2 8 3 1.06 0.35 New
5524.47 11 2 <8 4 13 4 0.91 0.24 JD94
5535.26 28 4 40 4 42 5 1.35 0.13 JD94
5537.51 95 18 85 11 100 20 5.42 0.29 He75
5541.78 13 3 5 2 11 2 0.68 0.21 JD94
5545.02 38 4 30 2 27 3 0.85 0.09 He75
5546.52 11 3 <8 4 7 2 0.68 0.17 New
5556.27 9 3 12 2 7 3 0.90 0.31 New
5563.06 7 3 <8 4 8 3 0.85 0.30 New
5569.08 6 2 7 2 9 3 0.35 0.16 New
5594.54 16 3 10 2 16 3 0.86 0.15 New
5597.38 16 4 5 2 8 4 2.59 1.01 New
5600.49 9 2 9 2 7 3 1.17 0.39 New
5609.96 33 6 23 3 50 7 2.14 0.57 JD94
5645.43 11 2 * * 16 3 0.71 0.15 New
5705.10 166 10 163 10 214 24 2.75 0.12 He67
5709.40 49 9 29 3 43 5 1.71 0.27 JD94
5719.68 31 4 25 3 24 3 1.04 0.20 JD94
5746.21 52 4 48 5 35 4 2.84 0.20 JD94
5760.64 5 3 <8 4 6 2 0.61 0.13 K95
5762.80 16 3 8 2 <12 6 0.95 0.11 JD93
5766.17 41 3 21 3 29 4 1.08 0.07 Ch87
5769.32 15 2 12 3 18 3 1.26 0.28 JD93
5772.67 32 3 24 3 44 5 1.45 0.14 JD93
5776.13 420 31 640 39 501 32 15.2 2.20 Hg22
5776.21 28 4 19 4 29 4 2.00 0.30 JD93
5780.55 699 4 770 8 713 11 2.22 0.01 Hg22
5784.86 9 2 11 2 15 5 0.92 0.36 JD93
5789.04 15 3 20 2 52 6 1.16 0.15 JD93
5793.13 11 2 5 2 9 3 0.95 0.19 K95
5796.07 155 16 138 18 236 30 6.65 0.70 He67
5797.08 258 15 187 10 179 7 0.96 0.05 Hg22
5809.53 59 7 26 3 * * 1.83 0.25 JD94
5810.21 25 7 10 2 * * 1.74 0.30 JD93
5815.80 4 2 <8 4 8 3 0.65 0.27 JD93
5818.47 8 3 22 2 13 3 0.81 0.32 JD93
5828.56 15 2 12 2 22 3 0.87 0.16 JD93
5837.92 6 2 18 2 6 3 0.52 0.28 J96
5840.62 9 3 <8 4 <8 4 0.64 0.23 J96
5842.38 6 2 <4 4 <4 4 0.45 0.20 J96
5843.30 5 3 <8 4 <8 4 0.36 0.10 J96
5843.69 4 3 <8 4 <8 4 0.31 0.15 J96
5844.28 87 11 132 12 111 14 4.61 0.59 He67
5844.95 10 3 12 2 <8 4 0.65 0.21 JD94
Table 4.continued
λ EW ErrEW EW ErrEW EW ErrEW F W HM ErrF W HM Ref. (˚A) (m˚A) (m˚A) (m˚A) (m˚A) (m˚A) (m˚A) (˚A) (˚A)
BD+63◦1964 HD 183143 BD+40◦4220
5854.85 17 5 19 3 15 4 2.13 0.67 JD94
5900.58 12 3 12 2 16 3 0.75 0.16 K95
5910.54 23 3 <14 7 23 4 0.89 0.09 K95
5923.51 34 3 23 3 33 3 0.89 0.16 K95
5925.81 20 3 19 2 17 3 0.90 0.13 K95
5945.53 10 2 10 2 15 5 0.72 0.24 K95
5947.29 35 3 16 2 19 3 0.95 0.09 K95
5948.87 10 3 6 2 <8 4 0.71 0.20 K95
5958.89 32 3 52 7 30 4 1.28 0.08 New
5973.78 10 2 8 2 16 4 0.74 0.13 New
5975.66 9 2 <8 4 5 2 0.49 0.08 K95
5982.77 17 3 16 2 7 3 1.23 0.18 He75
5986.60 13 3 6 2 <8 4 1.30 0.29 K95
5988.04 12 3 12 2 5 2 0.91 0.13 K95
5989.51 7 2 6 2 5 2 0.95 0.24 K95
5995.73 9 4 7 2 7 3 0.84 0.31 K95
6004.80 36 3 30 3 15 3 2.92 0.38 HL91
6010.48 88 4 105 7 129 7 2.90 0.15 He75
6019.45 9 2 17 2 24 3 0.58 0.11 JD94
6027.09 37 4 35 4 45 4 2.28 0.25 JD94
6037.47 39 3 33 4 78 8 2.26 0.19 JD94
6042.84 296 32 262 23 367 40 14.3 3.33 He75
6059.88 15 5 9 2 20 4 1.20 0.50 JD94
6061.52 8 4 7 2 <8 4 0.86 0.34 New
6065.19 15 3 15 2 15 3 0.90 0.17 JD94
6068.45 8 3 6 2 10 3 1.34 0.25 New
6071.08 16 5 16 3 52 20 2.29 0.98 JD94
6084.94 9 2 10 3 10 2 1.13 0.36 New
6089.79 43 2 24 3 23 3 0.68 0.03 HL91
6108.14 10 2 11 2 10 3 0.60 0.15 JD94
6113.20 44 3 43 3 25 3 1.02 0.04 He75
6116.74 13 2 14 2 15 2 0.86 0.08 JD94
6118.66 5 2 5 2 8 3 0.43 0.10 New
6139.94 18 2 23 3 22 3 0.64 0.03 JD94
6145.41 9 9 <8 4 <12 6 0.96 0.25 New
6147.02 5 2 * * 15 4 0.90 0.32 New
6151.15 15 2 * * 10 3 1.44 0.20 New
6161.83 11 2 8 2 11 2 0.91 0.13 New
6165.72 15 3 10 2 7 2 1.56 0.23 New
6170.71 15 3 17 3 9 3 1.31 0.17 New
6173.65 907 22 1059 120 1075 81 23.1 1.24 Wi58
6177.72 14 3 8 2 10 3 1.91 0.48 New
6185.89 15 3 9 2 11 3 0.93 0.15 New
6187.19 19 3 10 2 10 3 1.24 0.22 New
6189.31 14 3 7 2 15 3 1.27 0.20 JD94
6194.57 5 2 6 2 6 3 0.31 0.08 HS81
6194.98 5 2 5 2 7 2 0.28 0.04 JD94
6195.99 79 3 86 5 66 3 0.68 0.03 He67
6198.82 6 3 11 3 <18 9 0.68 0.23 JD94
6203.06 139 13 125 18 124 22 1.30 0.03 He67
6204.22 135 9 123 9 143 20 4.92 0.51 He67
6207.52 132 17 160 17 150 30 9.34 1.47 JD94
Table 4.continued
λ EW ErrEW EW ErrEW EW ErrEW F W HM ErrF W HM Ref. (˚A) (m˚A) (m˚A) (m˚A) (m˚A) (m˚A) (m˚A) (˚A) (˚A)
BD+63◦1964 HD 183143 BD+40◦4220
6212.95 4 2 5 2 10 3 0.52 0.19 Ch85
6215.80 20 3 13 2 22 4 1.84 0.44 JD94
6220.86 11 3 7 3 11 4 0.84 0.27 K95
6223.53 6 2 10 2 5 2 0.59 0.18 JD94
6226.02 11 2 6 2 11 3 0.82 0.12 K95
6234.01 28 4 18 3 12 2 0.80 0.15 He75
6236.71 10 4 9 2 9 3 1.07 0.42 JD93
6244.42 13 4 22 3 6 2 0.92 0.12 New
6245.36 28 3 22 4 20 7 2.22 0.71 K95
6250.77 16 3 8 3 10 3 1.40 0.32 New
6269.82 84 5 115 10 100 9 1.22 0.10 He67
6270.45 86 11 130 11 128 17 4.34 0.91 He75
6278.17 10 5 32 5 28 5 1.16 0.57 JD93
6280.48 15 5 10 2 17 4 1.03 0.37 JD93
6283.30 899 45 1240 102 1172 120 10.1 0.12 JD93
6284.09 540 11 689 19 712 20 2.71 0.06 Me34
6287.57 13 4 12 2 7 2 0.52 0.24 JD93
6289.70 21 6 20 3 18 5 1.58 1.00 JD93
6302.29 31 3 20 3 30 4 3.19 0.39 New
6308.92 47 3 78 10 90 20 2.08 0.09 HL91
6311.53 268 32 390 48 230 120 23.0 2.64 He75
6317.75 75 11 60 7 139 22 2.97 0.19 JD93
6324.81 22 6 22 2 17 3 1.20 0.26 JD93
6330.14 16 2 18 3 28 10 0.98 0.15 JD93
6353.18 46 3 38 3 30 3 2.09 0.12 He75
6358.54 20 3 15 2 18 3 1.88 0.22 New
6360.21 834 55 920 200 830 125 30.0 2.50 HL91
6362.23 31 4 32 2 29 6 1.66 0.21 HL91
6367.28 18 2 18 2 12 3 0.67 0.09 Ho84
6371.92 6 3 * * 11 2 0.74 0.29 K95
6376.02 27 4 44 4 38 4 0.64 0.09 He75
6376.57 52 7 20 4 54 6 1.80 0.29 JD94
6379.22 176 3 107 3 85 4 0.81 0.01 He75
6396.95 39 3 55 4 37 5 1.35 0.12 HL91
6400.37 18 2 12 2 6 3 1.10 0.11 K95
6410.08 6 2 <8 4 7 3 0.45 0.14 New
6414.15 5 3 22 2 6 3 0.90 0.25 HL91
6414.76 89 9 130 22 174 25 8.20 1.05 HL91
6417.27 5 2 8 2 <14 7 0.61 0.19 New
6418.54 5 2 <8 4 5 2 0.71 0.18 New
6425.61 26 3 21 2 32 3 0.93 0.10 He67
6439.42 35 3 39 3 22 3 1.25 0.10 HL91
6445.25 39 4 42 3 34 3 0.83 0.11 HL91
6449.30 32 3 21 2 14 3 1.16 0.11 HL91
6456.08 47 3 49 7 62 7 1.29 0.08 New
6460.31 13 3 10 2 <14 7 0.73 0.34 JD94
6463.63 30 2 23 3 35 5 1.06 0.07 New
6466.95 15 2 12 2 7 3 0.79 0.06 New
6480.48 8 2 <8 4 28 11 0.54 0.08 New
6489.29 12 3 6 2 <8 4 0.64 0.08 New
6492.17 11 2 20 2 17 3 0.78 0.15 JD94
6492.92 155 21 135 24 180 30 9.67 1.17 JD94
6497.79 6 3 4 2 11 2 0.73 0.33 JD94
Table 4.continued
λ EW ErrEW EW ErrEW EW ErrEW F W HM ErrF W HM Ref. (˚A) (m˚A) (m˚A) (m˚A) (m˚A) (m˚A) (m˚A) (˚A) (˚A)
BD+63◦1964 HD 183143 BD+40◦4220
6536.86 6 3 8 2 22 4 0.69 0.30 JD94
6553.76 23 2 17 3 17 3 0.79 0.05 New
6591.03 101 17 97 4 —– —– 4.19 0.46 JD94
6597.47 13 3 20 3 15 3 0.79 0.21 He75
6613.63 314 4 320 4 300 5 1.14 0.01 Me34
6622.59 20 4 18 3 14 3 2.07 0.64 K95
6632.86 13 3 22 3 20 3 0.95 0.29 JD94
6635.50 7 2 7 2 10 2 0.63 0.20 K95
6644.33 15 3 29 3 25 5 1.43 0.26 New
6645.95 8 2 11 2 9 3 0.58 0.20 K95
6660.62 57 3 75 4 51 3 0.82 0.02 JD94
6662.25 5 2 8 2 35 4 0.43 0.12 New
6681.07 27 4 * * * * 2.01 0.18 K95
6684.83 8 3 5 2 * * 1.09 0.19 New
6686.46 5 2 <8 4 * * 0.63 0.13 New
6689.38 10 3 17 2 22 2 0.61 0.17 K95
6694.40 11 2 8 2 10 2 1.19 0.33 JD94
6699.28 41 3 48 2 27 3 0.99 0.07 Sa78
6701.87 15 3 20 2 7 2 0.83 0.13 Fe83
6707.73 13 3 <8 4 6 2 1.38 0.41 New
6709.65 16 4 13 2 * * 1.76 0.44 FD84
6719.58 20 3 * * 11 3 3.05 0.20 New
6729.20 17 2 13 2 14 4 0.81 0.09 New
6733.35 16 2 26 3 <8 4 1.28 0.17 New
6765.39 11 3 12 2 7 2 0.86 0.19 New
6770.23 9 2 18 2 10 2 0.58 0.12 He75
6789.64 15 3 9 2 10 2 2.54 0.38 He88
6792.54 11 3 19 3 9 2 0.66 0.14 He88
6795.18 11 4 15 2 5 2 0.92 0.33 He88
6801.39 7 3 15 2 12 3 0.95 0.34 He88
6804.82 13 3 7 2 13 3 1.86 0.27 He88
6811.30 14 3 18 3 21 4 0.95 0.23 He88