PARENTAL INVESTMENTS AND SCHOOL-BASED PROGRAMS TO FOSTER EARLY SOCIOEMOTIONAL DEVELOPMENT AND NUTRITIONAL HEALTH IN CHILE
Juan Carlos Caro
A dissertation submitted to the faculty at the University of North Carolina at Chapel Hill in partial fulfillment of the requirements for the degree of Doctor of Philosophy in the Department of Health
Policy and Management in the Gillings School of Global Public Health.
Chapel Hill 2020
Approved by: Sean Sylvia Jere Behrman
Jane Cooley Fruehwirth Sally Stearns
c
2020
ABSTRACT
Juan Carlos Caro: Parental investments and school-based programs to foster early socioemotional development and nutritional health in Chile
(Under the direction of Sean Sylvia)
Childhood obesity and mental health are among the major public health challenges of the 21st century. Evidence suggests that timely nutrition and responsive care from home and the school environment can prevent excessive weight gain and behavioral difficulties. However little is known about the effects of scaled-up programs as they interact with parental behavior to foster nutritional health and socioemotional development (SED). In this dissertation I use a national administrative dataset from Chilean students to quantify the causal effects of the Chilean School Meal Program (SMP) on body mass index for age z-scores (BAZ) for different levels of SED, as well as the potential
role of parental time investments on both BAZ and SED.
Effects on the SMP on BAZ are locally identified using a Regression Discontinuity design based on the program eligibility cutoffs over a household vulnerability score. Participation in first grade reduces average BAZ of girls by 0.2 standard deviations. The effect is equivalent to alocal reduction of 5 percent points in the obesity prevalence. Effects are concentrated among overweight or obese children and driven by improvements in nutritional quality of meals. Non-sedentary students, children with higher socioemotional development, and those receiving mental health services reap larger benefits from the SMP. Continued participation from first grade reduces boys’ average BAZ at fifth grade by 0.4 standard deviations, relative to never participants.
investments can substantially boost socioemotional development and reduce obesity risk, particularly for vulnerable children. Children in the bottom of the SED distribution could gain 0.4 standard deviations for a one standard deviation increase in time investments. A similar increase can lead to a reduction of 0.8 SD in BAZ among severely obese students. The results are consistent with experimental evidence from interventions targeted to vulnerable children. Additional analyses indicate that SED in Kindergarten is a strong predictor of health behaviors and improved task performance in first Grade.
ACKNOWLEDGEMENTS
I am immensely grateful for the continuous support and collaboration of Chilean National Board of School Aid and Scholarships (JUNAEB) and Institute of Nutrition and Food Technology (INTA) at the University of Chile in this project, particularly from Camila Corvalan, Eduardo Candia and Mariana Lira. This work could not have been possible without the insights from JUNAEB on the data collection and program implementation.
My gratitude extends to my advisor Sean Sylvia, and my dissertation committee: Jere Berhman, Jane Cooley Fruehwirth, Sally Stearns and Harsha Thirumurthy. The common research interests on early childhood development and methodological approaches on program evaluation created ideal conditions for this dissertation to be fruitful. I cherish all the input I received on this project from both my committee as well as many colleagues at the SECHI annual meeting, the International Food Policy Research Institute, Triangle Health Economics Workshop at UNC Chapel Hill and the Southern Economic Association annual meeting.
TABLE OF CONTENTS
ABSTRACT . . . iii
ACKNOWLEDGEMENTS . . . v
LIST OF TABLES . . . ix
LIST OF FIGURES . . . x
CHAPTER 1: INTRODUCTION . . . 1
CHAPTER 2: CHILD DEVELOPMENT AND SCHOOL-BASED PROGRAMS IN CHILE . . . 5
2.1 Weight gain among Chilean children . . . 5
2.2 School-level interventions in Chile . . . 5
2.2.1 The Chilean school meals program . . . 6
2.2.2 The skills for life program . . . 7
2.3 Timing of interventions and identification of treatment effects . . . 8
CHAPTER 3: CHILD DEVELOPMENT AND OBESITY PREVENTION: EVIDENCE FROM THE CHILEAN SCHOOL MEALS PROGRAM . . . 10
3.1 Introduction . . . 10
3.2 Background . . . 13
3.2.1 Early development and excessive weight gain . . . 13
3.2.2 The Chilean school meals program . . . 14
3.3 Theoretical framework . . . 17
3.4 Estimation strategy . . . 19
3.4.1 Latent factors and the measurement system . . . 19
3.4.2 Identifying average treatment effects . . . 19
3.5 Data and descriptive statistics . . . 21
3.6 Results . . . 25
3.6.1 Short-exposure Intent-to-Treat effects . . . 25
3.6.3 Heterogeneity on short-exposure effects . . . 29
3.6.4 Discussion . . . 32
3.7 Conclusion . . . 34
CHAPTER 4: PARENTAL INVESTMENTS, SOCIOEMOTIONAL DEVELOPMENT AND NUTRITIONAL HEALTH IN CHILE . . . 36
4.1 Introduction . . . 36
4.2 Data and descriptive results . . . 39
4.2.1 Early development and excessive weight gain . . . 39
4.2.2 Parental time investments . . . 43
4.3 Conceptual framework and methods . . . 43
4.3.1 Production functions . . . 45
4.3.2 Parental time investments . . . 46
4.3.3 Latent factors and the measurement system . . . 47
4.3.4 Estimation . . . 49
4.4 Results . . . 49
4.4.1 SED and parental investments . . . 49
4.4.2 Determinants of parental time investments . . . 51
4.4.3 Production function estimates . . . 53
4.4.4 The potential of interventions . . . 55
4.4.5 Human capital and child behavior . . . 59
4.5 Conclusion . . . 60
APPENDIX A: THE CHILEAN NATIONAL BOARD OF SCHOOL AID AND SCHOLARSHIPS . . . 63
APPENDIX B: A SIMPLE MODEL OF PARENTAL INPUT ALLOCATION . . . 69
APPENDIX C: MEASURING SOCIOEMOTIONAL DEVELOPMENT AND PARENTAL INVESTMENTS . . . 70
C.1 Measures available in the dataset . . . 72
C.2 Exploratory factor analysis . . . 72
C.3 Confirmatory factor analysis . . . 73
C.4 Available measures across cohorts . . . 74
D.1 Factor analysis . . . 77
D.2 Local average treatment effects . . . 77
D.3 Investment equation and production functions . . . 77
LIST OF TABLES
3.1 Descriptive statistics . . . 23
3.2 SMP local average treatment effects (dependent variable: BAZ) . . . 26
3.3 LATE on BAZ at fifth grade in 2014 . . . 28
3.4 LATE on BAZ by time of measurement . . . 30
3.5 LATE on BAZ for in the Metropolitan Region by contract (girls) . . . 31
3.6 LATE on BAZ by sub-group (girls) . . . 32
4.1 Descriptive statistics . . . 40
4.2 Signal-to-noise ratios . . . 51
4.3 Parental time investments . . . 53
4.4 SED and nutritional health production technology . . . 55
4.5 SED in kindergarten and child behavior in first grade . . . 60
A.1 School enrollment and SMP data . . . 67
C.1 Quatimin-rotated factor loadings . . . 75
D.1 Standard deviation of SED and investment factors, cohort 2014-2015 . . . 79
D.2 Correlations between investment and socioemotional factors . . . 79
D.3 Local average treatment effects: specification tests (dep var: BAZ) . . . 81
D.4 Further specification tests (dep var: BAZ) . . . 81
D.5 LATE by school participation in the skills for Life Program . . . 81
D.6 Time investment equation: different specifications . . . 85
D.7 Production functions (exogenous time investments) . . . 86
LIST OF FIGURES
2.1 Nutritional status of first grade Chilean children by year . . . 6
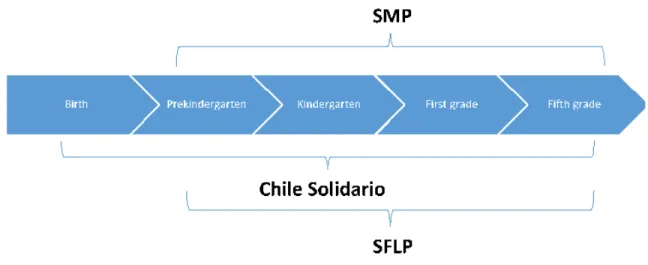
2.2 Timeline of interventions . . . 9
3.1 The School Meal Program Logic Model . . . 16
3.2 Obesity prevalence by Height for age z-scores (HAZ) in pre-kindergarten . . . 24
3.3 Local polynomial fit of BAZ on child vulnerability score (CVS) (centered) . . . 26
3.4 Average treatment effects by decile of BAZ for girls . . . 30
4.1 Obesity prevalence by HAZ in pre-kindergarten . . . 41
4.2 BAZ and obesity prevalence by school vulnerability status . . . 42
4.3 Distribution of responses for time investments by grade and activity . . . 44
4.4 SED and parental investments by vulnerability status . . . 51
4.5 Marginal product of SED and nutritional health . . . 57
4.6 Marginal product of parental time investments . . . 58
A.1 Weight distribution for children in first grade during 2015 (kgs.) . . . 68
A.2 Height distribution for children in first grade during 2015 (cms.) . . . 68
C.1 Distribution of random intercept in the measurement system . . . 76
D.1 Program eligibility by CVS . . . 80
D.2 Placebo tests (low vulnerable girls in 1st grade 2015) . . . 82
D.3 Ssocioemotional development (low vulnerable girls in 1st grade 2015) . . . 83
CHAPTER 1: INTRODUCTION
Socioeconomic vulnerability, inadequate nutrition and psychosocial deprivation prevent nearly one of every two children from reaching their developmental potential worldwide (Black et al., 2017; Grantham McGregor et al., 2014).1 In middle- and high-income countries, early gaps in health are often reflected as excessive weight gain and behavioral difficulties, particularly among vulnerable households (Cunha, Heckman, & Schennach, 2010; Moroni, Nicoletti, & Tominey, 2019; Popkin, 2002; Popkin, Adair, & Ng, 2012). Childhood obesity and behavioral difficulties (e.g. emotional instability) have long-lasting effects in physical, cognitive and socioemotional development (SED) (Conti et al., 2015; Ebbeling, Pawlak, & Ludwig, 2002; Palermo & Dowd, 2012; Wang et al., 2016). From a life-cycle perspective, the costs alone of obesity are substantial: decreased quality of life, elevated risk of mortality, chronic physical and mental health conditions, increased health-care consumption, productivity losses and absenteeism, and social stigma (Dee et al., 2014; OECD, 2019; Puhl & Brownell, 2006; Withrow & Alter, 2011). Obese individuals spend roughly 30% more on direct medical costs alone, compared to normal weight peers. Obesity has increased dramatically since 1980 (Ng, Fleming et al. 2014). 60% of adults and nearly 30% of children are overweight or obese in the OECD area (OECD, 2019). Changes are particularly striking in developed and developing countries that experienced rapid growth in disposable income. The Chilean case is of particular concern as childhood obesity rates nearly doubled in the last two decades, and one of every two children attending public or subsidized schools is overweight by the time they reach first grade of school (JUNAEB, 2017). The World Health Organization (WHO) declared childhood obesity one of the most serious public health challenges of the 21st century (WHO, 2016).
The scientific community has emphasized the importance of integrated strategies to address early childhood gaps given dynamic complementarities between physical, cognitive and socioemotional
development (Alderman & Fernald, 2017; Black et al., 2017; Grantham McGregor et al., 2014). Evidence from small randomized controlled trials (RCT) suggests that integrated interventions (nutrition and stimulation) reduces developmental gaps on both nutrition and SED during preschool (Attanasio et al., 2020; Campbell et al., 2014; Conti et al., 2015; Grantham McGregor et al., 2014).
In countries with high obesity prevalence, less is known about whether large school-based programs, such as School Meal Programs (SMPs), can successfully promote healthy nutritional status. To date, causal evidence on the impact of SMPs on weight gain is rather inconclusive (Gundersen, Kreider, & Pepper, 2012; Millimet & Tchernis, 2013; Schanzenbach, 2009). Some studies suggest that SMP with high nutritional standards can improve weight status (Fung et al., 2013; Schwartz et al., 2015). However, to date there is limited evidence on which supply and demand characteristics can drive program effectiveness. For example, students with higher socioemotional development and/or those who engage in healthy behaviors (e.g. physical activity outside school) could benefit more, on average, from a nutritious SMP. Similarly, children who receive higher parental stimulation or school-based mental health services could also be more receptive to the meals, all else equal. Effects can also be larger among overweight students, if the SMP substitutes high-calorie, less nutritious foods at home. Finally, as noted with other targeted programs, SMP eligibility could induce bullying and stigma, negatively impacting program participation and socioemotional development (Bhatia, Jones, & Reicker, 2011).
In addition to interventions that directly provide resources to households, extensive evidence emphasizes how responsive care is fundamental to foster child development(Alderman & Fernald, 2017; Black et al., 2017; Grantham McGregor et al., 2014). Labor market studies had identified that vulnerable households are more time constrained, having an impact in the time allocated to activities that promote human capital accumulation (Brown et al., 2010; Cawley & Liu, 2012). Still, beyond labor market participation, there is scarce evidence on the determinants of parental time allocation and its impact on human capital accumulation among preschool children. Understanding the factors that can contribute to increased quantity and quality of parental time investments is key for policy design. This study contributes new evidence connecting parental behavior, SED and nutritional status in a context of high overweight status prevalence, using rich administrative data from the Chilean National Board of School Aid and Scholarships JUNAEB, Spanish acronym.
nutritional and stimulation programs, socioemotional development, family dynamics and nutritional status, using administrative data from Chilean children between 4 and 10 years old. The main hypothesis is that successful nutritional and socioemotional interventions during early childhood can promote skills accumulation and parental investments, and by doing so, influence eating behaviors and nutritional status. The objectives of the dissertation are:
1. To identify the short-exposure local treatment effect of the SMP on nutritional status and SED of first grade children, exploring heterogeneity by family background and school-level characteristics.
2. To identify the long-exposure local treatment effect of the SMP on nutritional status and SED of fifth grade children, exploring heterogeneity by family background and school-level characteristics.
3. To estimate the potential role of parental time investments on SED and BAZ among preschool children, accounting for endogeneity of parental behavior.
While aims 1 and 2 provide insights on the effectiveness of school-based programs and the heterogeneity of the such effects, aim 3 explores further the interaction between paternal investments and child development in order to understand the household demand for parental investments that promote childrens’ health. Results from this study can also provide insights to evaluate the effectiveness of policy scenarios that modify the current coverage of both programs. Findings from this study will contribute to a deeper understanding of the connection between socioemotional development, family interactions and nutritional status. In particular, results can contribute to specific recommendations for policy design and evaluation from a health and educational perspective. The latter is key to fight the childhood obesity epidemic we observe in both recently developed countries, such as Chile, and other countries that currently face rapid transition in income per capita and food supply, increasing risk factors associated with obesogenic environments.
CHAPTER 2: CHILD DEVELOPMENT AND SCHOOL-BASED PROGRAMS IN CHILE
2.1 Weight gain among Chilean children
The obesity epidemic has reached critical proportions in middle (and high) income countries, such as Chile, where one of every two children attending public or subsidized schools is overweight or obese by the time they reach first grade (JUNAEB, 2017). Furthermore, obesity among children of the same age has almost doubled in the last twenty years (see 2.1). The alarming rise in obesity prevalence in Chile has pushed the policy agenda towards the obesogenic environment. In 2016, Front-of-Package (FOP) labeling and marketing restrictions towards unhealthy foods and beverages were introduced, including sales prohibitions inside schools, FOP marketing and media advertising restrictions. Although these policies are expected to reduce unhealthy food exposure to children, little is known regarding Chilean childrenâs optimal development (i.e. nutrition and socioemotional skills) and its relationship with health behaviors and nutritional status. Evidence suggests that vulnerable children are more likely to be overweight due to both high energy consumption and limited physical activity (Duran & JUNAEB-DII, 2006; Olivares et al., 2006). A major factor contributing to this pattern is lower self-efficacy and motivation of both mothers and children, suggesting limited socioemotional skills and limited response to environmental cues. However, it is unclear whether there is a connection between socioemotional development and overnutrition among children in Chile.
2.2 School-level interventions in Chile
Figure 2.1: Nutritional status of first grade Chilean children by year
Source: JUNAEB.
2.2.1 The Chilean school meals program
The SMP was implemented in 1964, as part of the creation of JUNAEB, to address high levels of undernutrition and wasting among children in Chile. Currently, the SMP covers nearly 60% of all students attending public or private subsidized schools, and almost complete coverage in pre-school, with a focus on optimal nutrition and acceptability (by 2014, 90% of students attended municipal or private subsidized schools). Children receive daily meals for more than 200 days a year, covering up to 70% and 33% of daily energy requirements in pre-school and school level, respectively (Salinas & Correa, 2013).
program received a substantial supplement to ensure universal coverage for children in the first three quintiles of household income. In contrast with school meal programs in other countries, the Chilean SMP does not work as discounted or free meal benefits; rather, meals are provided by external companies, and a fixed amount or servings are pre-processed and distributed to each school based on the number of eligible students. In fact, there are no school cafeterias, but kitchens and dining halls are equipped to finish and serve meals to students. Meal distribution is assisted by a school staff to ensure that only beneficiaries receive meals. As explained above, non-beneficiaries need to source their meals elsewhere.
Due to the centralized nature of the SMP and for administrative purposes, JUNAEB allocate the SMP demand through several contracts that are bid among the participating providers, with a duration of three years. Contracts specify the number of meals to be allocated in each school, the nutritional content of the meals, frequency of different food groups, among other conditions of food processing and meal delivery. Each contract is associated with a subset of geographic units containing several schools (Duran, Labrana, & Saez, 2015). There are 102 geographic units across the country, grouped randomly in three macro zones. Each year, JUNAEB bid contracts for one macro zone, so in any given year there are three different contracts operating simultaneously, splitting the schools into three randomly selected groups.
Given constant commitment of JUNAEB to improve SMP nutritional quality, providers operating under newer contracts, particularly from 2015 onwards, had to incorporate significant changes in the nutritional quality of meals (e.g. overall less calories and higher frequency of healthy foods, such as fruits, vegetables and whole grains). The latter implies that quality of meals for children in different schools could be different in the same year if schools are associated to different contracts. Overall, JUNAEB ensures a high nutritional standard for the meal offered in the SMP, including mostly traditional (home-style) preparations and low levels of added sugar, fat or salt.
2.2.2 The skills for life program
et al. 2017). SFLP is available for participation to any municipal or private subsidized school in Chile that is defined as âhigh riskâ based on a school vulnerability score, or SVS for short. The SVS is constructed with several indicators that characterize the proportion of vulnerable students based on their CVS for pre-school and grade school. Therefore, the SVS strongly correlates with the proportion of vulnerable students relative to all students. The lowest third of schools by SVS are eligible, and the school must apply to participate in the program. SFLP is implemented in two school cycles. SFLP for students between pre-school and 4th grade, and another cycle for students fifth until eighth grade. The assessment of studentsâ mental health define the range of services are delivered to children, parents and schools, based on their individual (relative) mental health needs (Murphy et al., 2017). In the SFLP, children are evaluated in prekindergarten and kindergarten using a validated and adapted-to-context scale: Pediatric Symptom Checklist (PSC-CL), developed by Jellinek et al. (1988). This instrument is completed by parents and considers several areas of socioemotional development, consistent with several other validated scales. In first and third grade of primary school, students receive a similar assessment, plus an additional instrument completed by their teachers: Teacher Observation of Classroom Adaptation (TOCA-RR-CL-CL in the Chilean context), developed by (Werthamer-Larsson, Kellam, & Wheeler, 1991).
During prekindergarten, SFLP-I activities involve weekly workshops that provide tools and preventive strategies for parents and teachers, delivered in several sessions during the first part of the school year. From first grade and onwards, SFLP-I provide tools and workshops for parents and teachers during every year between first and fourth grade. The material includes input for guided activities in class and parent-teacher meetings (including mental health care workshops for teachers). At each stage of screening (prekindergarten, kindergarten, 1st grade, 3rd grade) teachers and parents receive feedback on the mental health risk of students. Particularly, after 1st grade screening, workshops are tailored based on each classâ mental health needs. In addition, children with particular mental health needs are referred to clinical services.
2.3 Timing of interventions and identification of treatment effects
the student attended on measurement day). Information on birth data is collected retrospectively in the survey. Given that almost all preschoolers receive SMP, I concentrate in the differences in outcomes between beneficiaries and non-beneficiaries of the SMP during the first grade of school, controlling for program eligibility in preschool and other pre-program covariates (see 2.2).
Figure 2.2: Timeline of interventions
Source: Author based on JUNAEB documentation.
CHAPTER 3: CHILD DEVELOPMENT AND OBESITY PREVENTION: EVIDENCE FROM THE CHILEAN SCHOOL MEALS PROGRAM
3.1 Introduction
The World Health Organization declared childhood obesity one of the most serious public health challenges of the 21st century (WHO, 2016). In middle- and high-income countries, early gaps in health are often reflected as excessive weight gain, particularly among more resource-constrained households (Popkin, 2002; Popkin, Adair, & Ng, 2012). Childhood obesity has long-lasting effects in physical, cognitive and socioemotional development SED (Conti et al., 2015; Ebbeling, Pawlak, & Ludwig, 2002; Palermo & Dowd, 2012; Wang et al., 2016). From a life-cycle perspective, the costs of overweight and obesity are substantial: decreased quality of life, elevated risk of mortality, chronic physical and mental health conditions, increased health-care consumption, productivity losses and absenteeism, and social stigma (Dee et al., 2014; OECD, 2019; Puhl & Brownell, 2006; Withrow & Alter, 2011). Obese individuals spend roughly 30% more on direct medical costs alone, compared to normal weight peers. Obesity has increased dramatically since 1980 (Ng, Fleming et al. 2014). 60% of adults and nearly 30% of children are overweight or obese in the Organisation for Economic Co-operation and Development (OECD) area (OECD, 2019). Changes are particularly striking in developed and developing countries that experienced rapid growth in disposable income. The Chilean case is of particular concern as childhood obesity rates nearly doubled in the last two decades, and one of every two children attending public or subsidized schools is overweight by the time they reach first grade of school (JUNAEB, 2017).
The scientific community has emphasized the importance of integrated strategies to address developmental gaps, given the dynamic complementarities between physical, cognitive and socioe-motional development (Alderman & Fernald, 2017; Black et al., 2017; Grantham McGregor et al., 2014). Evidence from small, randomized controlled trials suggests that integrated interventions (nutrition and stimulation) reduces developmental gaps on both nutrition and socioemotional
2015; Grantham McGregor et al., 2014). In countries with high obesity prevalence, less is known about whether large school-based programs, such as school meals, can successfully promote healthy nutritional status. To date, causal evidence on the impact of School Meal Programs (SMPs) on weight gain is rather inconclusive (Gundersen, Kreider, & Pepper, 2012; Millimet & Tchernis, 2013; Schanzenbach, 2009). Some studies suggests that SMPs with high nutritional standards can improve weight status (Fung et al., 2013; Schwartz et al., 2015). However, to date there limited evidence on which supply and demand characteristics can drive program effectiveness. For example, students with higher socioemotional development and/or those who engage in healthy behaviors (e.g. physical activity outside school) could benefit more, on average, from a nutritious SMP. Similarly, children who receive higher parental stimulation or school-based mental health services could also be more receptive to the meals, all else equal. Effects can also be larger among overweight students, if the SMP substitutes high-calorie, less nutritious foods at home. Finally, as noted with other targeted programs, SMP eligibility could induce bullying and stigma, negatively impacting program participation and socioemotional development (Bhatia, Jones, & Reicker, 2011).
This study contributes new evidence connecting large early childhood interventions, parental behavior, SED and nutritional status in a context of high overweight status prevalence, using rich administrative data from the National Board of School Aid and Scholarships. The analysis follows two cohorts of children that started pre-kindergarten in 2012 and 2013, with repeated measurements at pre-kindergarten, kindergarten , first and fifth grade. I estimate the local Intent-to-Treat effects of short- and long-run exposure to the Chilean SMP on the z-score of the body mass index (BAZ) of boys and girls attending public and subsidized schools in urban areas, under a fuzzy regression discontinuity (FRD) framework. The running variable approximates a household vulnerability score and treatment status is determined at the individual level based on two pre-determined cutoffs.
health intervention covering nearly a third of all schools, based on their vulnerability (Murphy et al., 2017). Finally, I conduct sub-group analysis based on the student’s socioemotional development, parental time investments and health behaviors. To measure socioemotional development and parental time investments, I estimate underlying factors from noisy measures contained in the household questionnaire (see Attanasio, Meghir, and Nix (2015), Heckman, Pinto, and Savelyev (2013)).
The estimated measurement system allows the identification of several measures of socioemotional development with an analogous interpretation to dimensions of the Big Five Inventory (Externalizing Behavior, Openness to Experience, Extroversion). Local average treatment effects reveal that girls (but not boys) eligible for the program have a significant post summer decrease in average BAZ in the 2015 cohort. In contrast, there are no significant effects in the 2014 cohort, before the implementation of improved nutritional standards. Furthermore, the effect occurs at the top half of the BAZ distribution, i.e., children that are obese or overweight. Additional analysis confirms that effects are mainly driven by improvements in the nutritional quality of meals provided. Openness to Experience and Neuroticism (also referred as Externalizing Behavior), moderate the SMP effects on BAZ, consistent with prior evidence from observational studies and randomized experiments (Heckman, Pinto, & Savelyev, 2013). Conversely, I find no evidence that program eligibility has any impact on socioemotional development. In addition, children who attend to schools providing additional mental health services (the SFLP) exhibit larger reductions in BAZ. Using data from the 2014 cohort, evidence shows that continuous SMP participation from first grade until fifth grade (i.e. long-run exposure) significantly decreases BAZ on boys, relative to never participants, specially if they are overweight. Exogenous variation in participation status between fourth and fifth grade due to policy changes in 2016 had no significant effects on average BAZ in fifth grade (during 2018).
& Pepper, 2012; Millimet & Tchernis, 2013).1. Overall, I found that the nutritional quality of the Chilean SMP contributes to preventing excess weight among overweight students in the short-and long-run. This study also contributes additional evidence regarding the impact of scaling-up pre-school integrated nutrition and stimulation interventions (Alderman & Bundy, 2011; Kautz et al., 2014). The effectiveness of the SMP is higher for students with high socioemotional development and those receiving a mental health intervention delivered at the school level.
3.2 Background
3.2.1 Early development and excessive weight gain
Individual obesity risk starts at conception due to epigenetic characteristics that can be triggered by factors such as maternal overnutrition during pregnancy or absence of exclusive breastfeeding in the first six months of life (Anderson & Butcher, 2006; Lillycrop & Burdge, 2011). From an early age, increased availability and marketing of foods high in critical nutrients (i.e. sugars and fats) can have a substantial effect on weight gain among children (Anderson, Butcher, & Schanzenbach, 2019; Birch & Anzman, 2010; Swinburn et al., 2011; Wyatt, Winters, & Dubbert, 2006). As such, the rise in childhood obesity through the last decades can be explained substantially by striking changes in health behaviors (increased sedentarism and energy intake) as a response to environmental cues, particularly among vulnerable households. Despite the emergence of structural food policy schemes aiming to transform obesogenic environments, recent available data from Chile indicates that obesity (and severe obesity) has increased over the last years (JUNAEB, 2015; OECD, 2019; Vandevijvere et al., 2019). There is also striking evidence of seasonal effects in weight gain. Children (particularly those obese) gain more weight during the summer, and are also likely to lose weight starting the school year as the school environment provides more structure in their diet, physical activity and leisure time (Baranowski et al., 2014; Kobayashi & Kobayashi, 2006).
Another important factor associated with early weight gain is insufficient socioemotional
opment. SED, such as self-regulation, are strong predictors of obesity among children (Graziano, Calkins, & Keane, 2010). This result is striking, as there is substantial evidence of an increase in the prevalence of emotional and behavioral problems among children and adolescents in recent decades (Collishaw et al., 2004; Tick, Van der Ende, & Verhulst, 2007). Insufficient nurturing care to promote socioemotional development and nutritional health create a vicious circle: limited SED leads to unhealthy behaviors that promote obesity. In turn, overweight children are more likely to be marginalized and bullied, stunting their socioemotional development (Cornette, 2011; Strauss & Pollack, 2003).
Disentangling the relationship between socioemotional development and weight gain is rather challenging. First, insufficient parental investments can lead to both limited socioemotional devel-opment and obesity. Poor households not only have less time and resources to invest in SED, but also are more likely to provide meals rich in simple carbohydrates and fats and scarce in key micro-nutrients. Secondly, limited SED in the form of poor self-regulation and executive function skills can be conducive to increased eating in absence of hunger. The association between self-regulation, caloric intake and weight gain among children has been substantially documented in observational studies (Francis & Susman, 2009). In a similar way, poor SED can preclude the adoption of other health behaviors, such as physical activity. Third, early evidence on the microbiota-gut-brain axis suggests that the gut modulates the reward system and affects mood, stimulating the intake of calorie-dense foods under emotional distress (Torres-Fuentes et al., 2017). As such, poor diets can actually become an additional stressor to child development. Finally, peers can influence not only socioemotional development (e.g. bullying) but also the adoption of unhealthy behaviors, which is consistent with evidence of behaviors "spreading" in social networks (Christakis & Fowler, 2007; Dishion & Tipsord, 2011). Given such complexities, relying on randomized interventions is one promising avenue to understand the complementarities among different dimensions of early childhood development (Alderman et al., 2014; Heckman, Pinto, & Savelyev, 2013).
3.2.2 The Chilean school meals program
children were undernourished; dropping to 0.5% by 2012 (Mönckeberg, 2014). However, since 1985 childhood obesity more than doubled in the same age group (Atalah, 2012; Vio & Albala, 2000). The SMP has responded to the obesity epidemic by continuously improving the nutritional quality of the meals, while increasing the fraction of eligible students (particularly since 2015). Currently, the SMP covers 60% of all students attending public or private subsidized schools (i.e. target schools), and virtually all students in pre-school, with a focus on optimal nutrition and acceptability.2 Children receive daily meals for more than 200 days a year, covering up to 70% and 33% of daily energy requirements in pre-school and school levels, respectively (Salinas & Correa, 2013).
JUNAEB determined program eligibility based on multiple criteria depending on household characteristics (see Figure 3.1). Until 2015, the Ficha de Proteccion Social (FPS) (Social Pro-tection File, in English), constructed by the Ministry of Social Development, was a major input to determine program participation.3 SMP elegibility before 2016 can be described as follows. High-vulnerable beneficiaries were ensured to receive the program fully, accounting for three meals a day (FPS<4,213), while low-vulnerable had a high probability (but not certainty) to be eligible for two meals, breakfast and lunch (4,213<FPS<8,500). While the FPS is not the only informa-tion used to determine eligibility, the predetermined cut-offs are linked to strong changes in the probability of being eligible. In principle, the high-vulnerable group includes students in extremely poor households, while the low-vulnerable group target individuals within non-poor vulnerable households. Lastly, non-beneficiaries had no access to any meals (FPS>8,500) and usually sourced food from home or purchased meals at school kiosks (roughly 25% of first grade students attending public or subsidized schools in 2015). Since 2016, JUNAEB considers students eligible for the SMP if they belong to the 60% most vulnerable households, using the Household Social Registry (HSR), a tool developed by the Ministry of Social Development to replace the FPS.4 Given the multiplicity of factors determining program eligibility and to protect households’ private information, JUNAEB also calculates a CVS as the continuous latent variable that arises from the ordered
2
in 2014, 90% of students attended municipal or private subsidized schools. 3
The FPS was widely utilized by many public institutions to determine the allocation of subsidies and other social welfare benefits. This score summarizes the self-reported information of households and housing conditions from the Social Protection Registry.
choice model associated with eligibility. 5 Once children’s eligibility status is determined, JUNAEB calculates the school vulnerability score (IVE) as the percentage of vulnerable (eligible) students at each school (from 0 to 100). Public and subsidized Chilean schools rarely have private cafeteria services, rather kiosks are available for snacks and light meals to be purchased. SMP services are provided by external companies and a fixed number of servings are cooked at the school based on the number of eligible students. Most schools are equipped with kitchens and dining halls provide meals to students. Meal distribution is assisted by school staff to ensure that only beneficiaries receive meals.
Figure 3.1: The School Meal Program Logic Model
Socioeconomic score (FPS)
Mother's education
Health insurance, region, and geographic area
Eligebility criteria (SINAE)
Child vulnerability score (CVS)
High vulnerable
Not vulnerable Low vulnerable School vulnerability
score (IVE)
Providers Nutritional requirements JUNAEB
Notes: Blocks in blue represent key variables in the eligibility process.
Due to the centralized nature of the SMP and for administrative purposes, JUNAEB bid meal services through staggered contracts that cover random, mutually exclusive geographic areas, with a duration of three years. 6 Contracts specify the number of meals to be allocated in each school, the
5
The CVS preserves the two cut-off points observed in the FPS, and similarly, it has no interpretable scale.
nutritional content of the meals, frequency limits of different food groups, and other characteristics of food processing and meal delivery. Each year JUNAEB auctions one contract, so in any given year there are three different contracts operating simultaneously. Given the constant commitment of JUNAEB to improve SMP nutritional quality, providers operating under newer contracts, particularly from 2015 onwards, incorporated significant changes in the nutritional quality and acceptability of meals, particularly increasing frequency of healthy foods, such as fruits, vegetables and whole grains.7
3.3 Theoretical framework
The model described below is adapted to incorporate nutritional status into the theory of human capital production in early childhood, drawing substantially from the frameworks discussed in the relevant literature (Agostinelli & Wiswall, 2016; Attanasio, 2015; Conti et al., 2015; Cunha & Heckman, 2007; Cunha, Heckman, & Schennach, 2010). Nutritional status as an input (Ht) can be
described by an inverted u-shape, given that both low or excessively high BAZ-for-age are related to poor nutritional status. For simplicity, in this model I assume thatHt increases as individuals
move from obesity towards normal nutritional status (consistent with a context of high overweight prevalence). There is also a vector of other relevant inputs or skills (θt), which could include cognition,
socioemotional development and other measures of health. All inputs can be determined by parental investments, school and household background, and the past history of nutritional status and SED. The model follows (children are not indexed to simplify notation):
Ht+1=ht(θt, Ht, It, Pt, Xt, et) (3.1)
θt+1 =gt(θt, Ht, It, Pt, Xt, vt) (3.2)
In the model described above Itcorresponds to parental investments, Ptcaptures parents’ stocks
of human capital andXtis a set of covariates that can affect the total factor productivity (Attanasio,
Meghir, & Nix, 2015). et and vt are random variables that reflect unobserved shocks. g(.) is
the high-dimensional skills formation technology, where nutritional status is a direct input in this function, based on the idea that improved nutritional status facilitates skill accumulation. h(.)
approximates the metabolic balance equation, where future nutritional status is a function of present choices and previous nutritional background. In this framework, (school) interventions can impact both the stock of inputs and their productivity, as noted by Heckman, Pinto, and Savelyev (2013). In turn, households can change the allocation of resources provided to children in response to external shocks (Attanasio, 2015; Das et al., 2013; Todd & Wolpin, 2003; Yi et al., 2015). Formally, we can describe the household’s demand for parental investments as:
It=ft(θt, Ht, Pt, Xt, Zt, ut) (3.3)
In this framework, parents make investment choices in each period given children’s SED and nutritional status history (Attanasio (2015) formalizes a simple model consistent with this setup). Investments also respond to householdsâ characteristics, such as income (included inXt) and to other
variables that measure the market prices and quality of parental inputs, contained inZt. Finally,ut
reflects other shocks that might affect investment decisions.
Under this framework, I can empirically test the presence of complementarity between SED and nutritional status, and also between school characteristics and parental investments. Moreover, this approach can be used to explore heterogeneity on treatment effects by several household characteris-tics. However, the simplicity of this model does not allow accounting for other relevant aspects that could influence nutritional status and SED such as peer effects, food availability outside the school, and fertility decisions. Moreover, is important to acknowledge that in most empirical applications not all inputs are observed, which can lead to biased estimates. 8
3.4 Estimation strategy
3.4.1 Latent factors and the measurement system
In the SMP data, SED are partially captured by many variables that characterize children’s behavior (self-reported by caregivers). To avoid model selection over potential proxies and to address measurement error, I obtain latent factors from noisy proxies using a measurement system, that both reduces dimensionality and accounts for measurement error (Cunha, Heckman, & Schennach, 2010; Gorsuch, 2003). Methods are discussed in detail in Appendix C. The structure of the measurement system was chosen based on exploratory factor analysis.
While the estimated factors contain (classical) measurement error, is expected to be random at the local cut-off points, thus no adjustment is required. Moreover, given the characteristics of the sample, and the fact that the system is linear, it is not necessary to incorporate adjustments to the standard errors in this step. However, preliminary analysis of the data indicates a strong presence of response styles from parents in the behavioral observation of children’s behavior. As such, following Aichholzer (2014), I allow the intercepts to have a common (random) component across measurements for each individual (parent) that is orthogonal to the underlying factors. This random intercept captures the individual preference to report consistently lower (or higher) responses across all measures (see Appendix C for more details). Finally, I estimate separately a measurement system for skills and investments, in order to use all available data. Results from estimating the system jointly or separately show that there is no significant differences (see Appendix D).
3.4.2 Identifying average treatment effects
functional form assumptions. More importantly, given that all data are used, it reflects properly the relative vulnerability of children with and without FPS.
The LATE reflects the intent-to-treat impact of the SMP on BAZ, as CVS does not uniquely determines eligibility (hence a fuzzy design). Students allocated to the low-vulnerable group have a very high probability of receiving meals, but not certainty (mostly due to budget restrictions). In addition, there is scope for non-compliance, i.e. beneficiary students can opt not to consume meals, or alternatively, teachers might allow non-beneficiary children to have meals if there are available after eligible children have been served. There are no available data to measure the degree of non-compliance, although based on interactions with JUNAEB officials, this issue arises among upper middle and high school students. Formally, if we defineXi as the CVS, and c as (one of the
two) cut-off, the estimand can be identified as:
τF SD=E(Hi(1)−Hi(0)|Xi =c, Ti(1)−Ti(0) = 1) (3.4)
Where Ti determines SMP elegibility. Under standard assumptions (Calonico, Cattaneo, &
Titiunik, 2014; Hahn, Todd, & Van der Klaauw, 2001), the LATE can be estimated as the ratio of two sharp local-linear regression discontinuity estimators:
ˆ
τF SD(hn) =
ˆ
µY,+(hn)−µˆT,−(hn)
ˆ
µY,+(hn)−µˆT,−(hn)
(3.5)
Where µˆU,+(hn) andµˆU,−(hn) are the local-linear estimators for a random variable Ui. As in
I extend the FRD setup to understand heterogeneous effects by segmenting the sample in (binary) sub-groups by parental investments and SED, using the method proposed by Carril et al. (2017). As mentioned, this approach is valid under the additional assumptions that treatment is continuous on the running variable over the support of the covariates of interest, and that there are compilers over the conditional distribution of such variables. The method balances the sub-groups in other covariates using an IVE approach, in order to avoid bias. A rich set of information on child health and household characteristics are used for balancing the sample across sub-groups. I also explore heterogeneous effects by season (of measurement) and provider contracts in service for a given year. Contracts are bid exogenously (to students) and service areas are pre-defined based on random assignment. If newer contracts have better quality, I expect they might affect the impact of SMP participation, at least for some sub-populations. In terms of peer effects, given that program participation is virtually universal in pre-school, I use the sub-group analysis proposed by Carril et al. (2017) to determine if children with a large fraction of overweight peers in the previous year (kindergarten ) are more (or less) sensitive to program eligibility. An additional concern is that local effects could vary along the distribution of the outcome variable, as noted in previous studies (Frandsen, Frolich, & Melly, 2012; Frolich & Melly, 2010; Hsu & Shen, 2016). In particular, children with higher risk of obesity or undernutrition might be more sensitive to the treatment. Hence, I used the quartile treatment effect approach to the FRD framework proposed by Frandsen, Frolich, and Melly (2012).
In terms of long-exposure effects, eligibility does not change significantly between first and fifth grade. The same approaches are used for long and short exposure effects, while accounting for vulnerable children in fifth grade that were not eligible in first grade, due to changes in their vulnerability and due to the expansion of the SMP in 2016.
3.5 Data and descriptive statistics
comprehensive household background information for children in schools eligible for the SMP, during three consecutive years from pre-kindergarten to first grade, fifth grade (since 2018) and then when students are high school freshmen. This questionnaire is known as the Vulnerability Survey. Schools consolidate and submit the information directly to JUNAEB each year during the the school cycle. The household questionnaire includes background on household characteristics, socioemotional development, health status (including birth weight and premature status), parenting beliefs and parental investments. Appendix A details the information contained in the Vulnerability Survey data. The main outcome is the z-score of body mass index, calculated by JUNAEB using the WHO reference guide (2007). SED are built based on a set of Likert-scale measures that characterize child’s health and behavior (see Appendix C for more details). Similarly, parental investments are constructed from questions regarding time inputs (e.g. reading together, play music or sports, and took children to play with others).
There are two main estimation samples in this study. First, I analyze the effects on SMP eligibility on all students attending the first grade in urban schools during 2015 that have a vulnerability measurement (CVS).9 Given the large variation in local food and schooling systems, rural households are excluded from the primary analysis. I also exclude implausible weight and height measurements.10 I refer to this sample interchangeably as the first grade (urban) or overall sample. The second estimation sample includes children that have CVS and are linked longitudinally, hereon referred as RD Panel (for more detail see Appendix A).
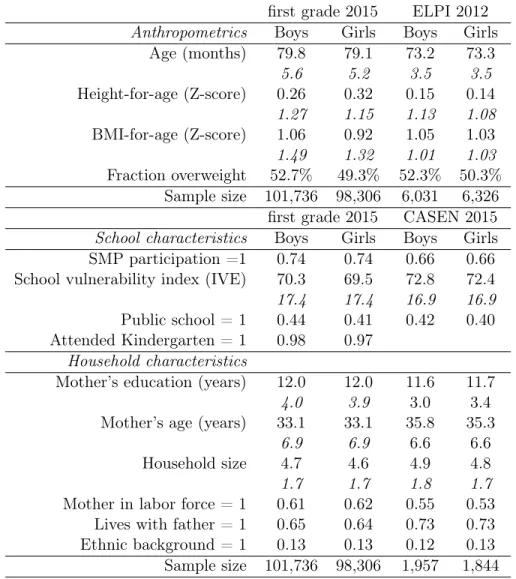
Table 4.1 shows basic descriptive statistics of the JUNAEB data in contrast with two nationally representative surveys: the 2012 ELPI and the 2015 CASEN. There are not significant differences in the anthropometric data, albeit children in the ELPI data are slightly younger at time of measurement. In terms of household characteristics, we observe that, while eligibility is substantial (almost three
9Although CVS is calculated for virtually every children in the sample, I restrict the estimation of local treatment effects to children that have FPS scores. The main reason is that I concentrate on the local effects around the eligibility thresholds over the continuous dimension of the CVS. Incorporating the students that do not have FPS introduces lumps in the distribution of the CVS that affect estimation. As shown, there are no major differences between children with and without FPS score.
Table 3.1: Descriptive statistics
first grade 2015 ELPI 2012 Anthropometrics Boys Girls Boys Girls
Age (months) 79.8 79.1 73.2 73.3
5.6 5.2 3.5 3.5
Height-for-age (Z-score) 0.26 0.32 0.15 0.14
1.27 1.15 1.13 1.08
BMI-for-age (Z-score) 1.06 0.92 1.05 1.03
1.49 1.32 1.01 1.03
Fraction overweight 52.7% 49.3% 52.3% 50.3% Sample size 101,736 98,306 6,031 6,326 first grade 2015 CASEN 2015 School characteristics Boys Girls Boys Girls SMP participation =1 0.74 0.74 0.66 0.66 School vulnerability index (IVE) 70.3 69.5 72.8 72.4
17.4 17.4 16.9 16.9
Public school = 1 0.44 0.41 0.42 0.40 Attended Kindergarten = 1 0.98 0.97
Household characteristics
Mother’s education (years) 12.0 12.0 11.6 11.7
4.0 3.9 3.0 3.4
Mother’s age (years) 33.1 33.1 35.8 35.3
6.9 6.9 6.6 6.6
Household size 4.7 4.6 4.9 4.8
1.7 1.7 1.8 1.7
Mother in labor force = 1 0.61 0.62 0.55 0.53 Lives with father = 1 0.65 0.64 0.73 0.73 Ethnic background = 1 0.13 0.13 0.12 0.13 Sample size 101,736 98,306 1,957 1,844 Notes: first grade data includes children aged 61-107 months old. Longitudinal Survey of Early Life (ELPI): Early Childhood Longitudinal Survey 2012 (restricted to children between 68-83 months old, weighted values). National Socioeconomic Characterization Survey (CASEN): National Survey of Socioeconomic Characterization (restricted to families with children attending first grade to public or subsidized schools, weighted values). Mother’s age and education in CASEN only available for children living with mother at time of survey. SMP: School Meals Program. Standard deviations in italics, if applicable.
of every four children), self-reported participation is lower (66%). Also, first grade children in CASEN have mothers that are older and less likely to participate in the labor force. Children in the Vulnerability Survey data are more likely to live without a father (35%) in comparison to the CASEN data (27%).
Figure 3.2: Obesity prevalence by HAZ in pre-kindergarten (a) Boys
.1
.2
.3
.4
Obesity prevalence
<−2 −2 to −1 −1 to 0 0 to 1 1 to 2 >2
HAZ in Pre−Kinder
Pre−Kinder First Grade Fifth Grade
(b) Girls
.1
.2
.3
.4
Obesity prevalence
<−2 −2 to −1 −1 to 0 0 to 1 1 to 2 >2
HAZ in Pre−Kinder
Pre−Kinder First Grade Fifth Grade
Notes: Calculations based on the longitudinally matched JUNAEB data.
baseline. Taller children more likely to be obese by first grade. However, by fifth grade, while boys obesity prevalence increases for all HAZ groups (being as high as 40%), obesity declines (or stays) among girls in all HAZ groups. The results are consistent with two epidemiological phenomena: (1) there is evidence of increased adiposity in first grade, leading to accelerated linear growth, an early marker of metabolic syndrome, and (2) in fifth grade, boys are at substantially higher obesity risk than girls (which risk actually decreases relative to first grade). Together, both are important markers of obesity and metabolic risk factors in adulthood.
The estimated measurement system for behavioral and health measurements elicit three latent SED that are consistent with measures of the Big Five Inventory of personality: Extroversion (θE), Openness to Experience (θO) and Neuroticism (θN) and one learning process measure (L) 11 (see Appendix C for a discussion on SED measurement and latent factors). Results from those measurement systems indicate that deviations from normality are important; the estimated mixing parameter is 0.514 [0.508 , 0.520]. The random intercept allow to remove bias introduced by response styles (small in magnitude). The distribution of response styles and its correlation with parent’s education is consistent with social desirability bias. (see Appendix C for additional results). In
11
the case of parental time investments (I), results are remarkably close in terms of model fit and all measures relate to the underlying factor in a similar magnitude.12
3.6 Results
3.6.1 Short-exposure Intent-to-Treat effects
Figure D.1 shows the discontinuity on eligibility at first grade for low vulnerable and high vulnerable groups respectively in 2015, using CVS as the running variable. In both cut-off points there is a large change in average probability of being eligible (to either high or low vulnerable). In the case of high vulnerable students, many children on the right of the cut-off are eligible, which is due to the interaction with another important social program, Chile Solidario (CH), which makes children SMP eligible as high vulnerable regardless of their FPS if their families belong to this program. When we exclude that group (about half of the high vulnerable students), both cut-offs have a very similar distribution. Based on the density manipulation test proposed by Cattaneo, Jansson, and Ma (2018), there is no evidence of potential manipulation of the running variable around the eligibility thresholds, in either case. However, the test is sensitive to the cases of students eligible for CH, therefore LATE estimates are presented in both cases.
Table 3.2 reports the LATE estimates for both cut-off for the 2014 and 2015 cohorts (first grade). Figure 3.3 shows the local polynomial fit of the BAZ mean at each side of the eligibility cut-off for low vulnerable students (boys and girls) in 2015. The following covariates are included to improve the precision of the estimated standard errors: age, school type (public/subsidized), school size (enrollment), birth weight and z-score of height-for-age. LATE is significant and negative among girls that are eligible as low-vulnerable (compared to non-eligible similar students) in 2015. The average difference in BAZ between groups is 0.15 SD. Using obesity prevalence as the outcome variable, the effect size is consistent with a reduction of obesity rates of 5 percent points. The LATE estimates between high and low vulnerable students are not significant. The latter is reasonable, given that the additional calories received by low vulnerable students (relative to not eligible) are substantially more relative to the extra calories that the high vulnerable students receive, at the margin.
12
Figure 3.3: Local polynomial fit of BAZ on CVS (centered) (a) girls
.6
.7
.8
.9
1
−2 −1 0 1 2
Sample average within bin Polynomial fit of order 4
(b) boys
.9
.95
1
1.05
1.1
1.15
−2 −1 0 1 2
Sample average within bin Polynomial fit of order 4
Notes: CVS: child vulnerability score (JUNAEB). Bandwidth on CVS limited avoid overlap with high vulnerable cut-off. Triangular kernel and bin selection based on Integrated Mean Squared Error optimal quantile-spaced method.
Table 3.2: SMP local average treatment effects (dependent variable: BAZ) Vulnerability high vs low high vs low (chs=0) low vs no
Boys Girls Boys Girls Boys Girls
Panel a) 2015 cohort
First Stage 0.66 0.69 0.90 0.91 0.97 0.97
0.02 0.015 0.011 0.008 0.005 0.005
LATE 0.016 -0.023 0.007 0.004 0.08 -0.15
0.091 0.073 0.07 0.067 0.091 0.069
Bandwidth 0.32 0.36 0.39 0.35 0.66 0.67
N 11018 13197 10560 8934 12009 12157
Panel b) 2014 cohort
First Stage 0.63 0.68 0.80 0.86 0.9 0.87
0.027 0.027 0.029 0.019 0.012 0.013
LATE 0.075 -0.067 0.232 0.01 0.029 0.006
0.183 0.153 0.187 0.116 0.095 0.082
Bandwidth 0.34 0.31 0.31 0.42 0.86 0.88
N 7125 6341 4607 7177 11741 12546
Notes: significant values in bold (p<0.1). Standard errors based on optimal mean squared error. Standard errors in italics.
of the functional form, and increasing the bandwidth creates more imprecise estimates. Moreover, estimates are not much changed if I use the RD panel sample instead of the full sample. The results among students in rural schools are somewhat similar but very imprecise (see Table D.4).
3.6.2 Long-exposure effects and policy changes
In 2016, three major policy changes were introduced, impacting SMP eligibility criteria and availability of food in schools. The extension in coverage allows estimation of the LATE on children that were not eligible for the program before 2016. In addition, the introduction of the RSH as eligibility measure changed a continuity feature of the SMP until 2015. Before 2016, children classified as vulnerable remained in the program for at least three consecutive years, while from 2016 onward, children have a probability of changing eligibility status every year. Finally, in the context of the Food Labelling and Regulation Act of 2012, foods classified as "unhealthy" according to the new regulation standards were banned from schools (and 100 meters around them) since June 2016. As such, food availability for students inside schools changed dramatically.
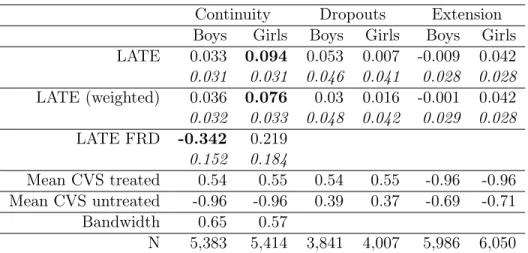
In this section I present estimates for different sub-samples to understand both the potential long exposure effects of the SMP (by fifth grade), as well as the effects that might arise from policy changes, summarized on Table 3.3. The first two columns give estimates of the LATE between students that participated in the SMP continuously until fifth grade versus those who never participate in the program, or "continuity". Columns 3 and 4 estimates the effect of being continuously eligible in the program until fifth grade versus those that"dropout" from the program based on their RSH assessment. Finally, columns 5 and 6 compare the effect of students that were eligible for the program only during Fourth and fifth grade, relative to students that never participated in the SMP, due to the program "extension" in coverage.
Table 3.3: LATE on BAZ at fifth grade in 2014
Continuity Dropouts Extension Boys Girls Boys Girls Boys Girls LATE 0.033 0.094 0.053 0.007 -0.009 0.042 0.031 0.031 0.046 0.041 0.028 0.028 LATE (weighted) 0.036 0.076 0.03 0.016 -0.001 0.042 0.032 0.033 0.048 0.042 0.029 0.028 LATE FRD -0.342 0.219
0.152 0.184
Mean CVS treated 0.54 0.55 0.54 0.55 -0.96 -0.96 Mean CVS untreated -0.96 -0.96 0.39 0.37 -0.69 -0.71
Bandwidth 0.65 0.57
N 5,383 5,414 3,841 4,007 5,986 6,050 Notes: HSR cut-off since 2016 is percentile 60. Sample restricted to students between 40 and 80 percentile on the HSR (low vulnerable and no eligible students only). Significant values in bold (p<0.1). Robust standard errors in italics. LATE weighted estimates based on the inverse of absolute distance from CVS low-vulnerable cutoff. FRD indicate fuzzy regression discontinuity estimates. Optimal bandwidth based on optimal mean squared error in the full sample.
relative to never participants.13 Evidence is consistent with the significant differences in obesity risk between boys and girls at fifth grade. Again, local estimates indicate that boys who are overweight or obese are more likely to benefit from the SMP, while there are no significant differences among students with normal BAZ (results in Appendix D).
For those children who were eligible to the SMP continuously, average BAZ is not different from those students that dropped out from the program due to a change in their household vulnerability status. Students who only recently participated in the program due to the extension of the SMP coverage have similar average BAZ relative to students who never participated in the program. Overall, the evidence suggests that within this cohort, short-term effects are not apparent for fifth grade BAZ on boys or girls, however sustained effects in fifth grade indicate that overweight boys who continuously participated in the SMP had lower BAZ relative to non-participants. Similarly, the latter suggests that program exposure in early years (ages 5-9) could carry persistent effects on
BAZ, at least for some students.
3.6.3 Heterogeneity on short-exposure effects
The average estimates suggest that both characteristics of students and the program itself can lead to heterogeneous effects and highlight potential demand and supply side drivers. To determine potential mechanisms, I explore heterogeneous effects by student’s nutritional status, socioemotional development, parental time investments, and nutritional quality of the meals provided.
Heterogeneity along the BAZ distribution Figure 4.6 shows the local effects of the SMP at different deciles of the BAZ distribution for girls (between low vulnerable and not eligible). Estimates suggest that the LATE is larger and significant for the top half of the distribution, i.e., for students that are either overweight or obese, but non-significant in the lower half of the distribution. The latter supports the idea that students with excess weight are the ones benefiting from the SMP nutritional quality, potentially substituting nutrient rich meals offered at school for the energy dense meals offered at home. Additional analysis on the long-exposure effects on boys in fifth grade reveals that reductions on BAZ also occurs at the upper half of the BAZ distribution, i.e. among overweight students.14
Seasonal weight variation Given that children’s anthropometrics are evaluated through the school year, we can expect differences in LATE among students measured during the fall versus those assessed at springtime.15 Estimates in Table 3.4 show that the LATE among girls in 2015 occurs mostly during the first part of the school year (after summer vacation), while there is limited effect observed amongst the girls measured in spring. The evidence is consistent with the seasonal pattern; weight reduction after the summer and a rebound during springtime.
Nutritional quality of services provided Another important source of variation comes from the quality of the meal services provided. A new bid contract started in 2015, which included more strict nutritional requirements (reduced calories and increased frequency of healthy foods). Differences
14
Results available upon request.
Figure 3.4: Average treatment effects by decile of BAZ for girls (a) Mean Squared Error
−.4
−.2
0
.2
LATE
0 20 40 60 80 100
quantile
(b) Coverage Error Rate
−.3
−.2
−.1
0
.1
LATE
0 20 40 60 80 100
quantile
Notes: CI in right panel estimated using bandwidth based on optimal coverage error rate and in left panel using bandwidth based on optimal mean squared error. CVS: child vulnerability score (JUNAEB).
Table 3.4: LATE on BAZ by time of measurement
boys girls
Fall Spring Fall Spring LATE 0.096 0.072 -0.361 0.018
0.115 0.134 0.148 0.091
Bandwidth 0.84 0.6 0.93 0.68
N 7466 5603 6100 8062
Notes: significant values in bold (p<0.1), adjusted for mul-tiple hypothesis testing using the Sidak method. Bandwidth based on optimal mean squared error. Robust standard errors, in italics.
in the quality of the meals offered could explain the reported differences between the two cohorts. In order to control for potential differences in environmental characteristics, Table 3.5 reports the LATE for each major contract operating in 2014 and 2015, restricting the sample only to students in the Santiago Metropolitan Region (36% of total sample).16 In schools where there was a change in the contract during 2015, the LATE is large and significant. Conversely, in schools where no change in contract took place, local average effects from the SMP are not significant. Overall, we
16
can conclude that the SMP effects observed in 2015 can be attributed to a short-term reduction in BAZ on girls, mainly in schools where the nutritional characteristics of the meals improved.
Table 3.5: LATE on BAZ for in the Metropolitan Region by contract (girls)
2014 2015
Contract 16LP12 35LP11 35LP11* 16LP12 35LP11 10LP14
LATE 0.146 -0.42 0.548 -0.381 -0.077 -1.06
0.322 0.27 0.237 0.543 0.384 0.362
Bandwidth 0.93 0.72 0.84 0.57 0.68 0.48
N 814 1105 1342 303 683 447
Notes: significant values in bold (p<0.1), adjusted for multiple hypothesis testing using the Sidak method. Bandwidth based on optimal mean squared error. Standard errors in italics. *Indicates schools in 2014 that switched to contract 10LP14 in 2015.
The role of socioemotional development, paternal investment and physical activity Table 3.6 summarizes the LATE for girls, between low vulnerable and not eligible, for several different sub-groups of interest. There are small differences by parental time investments (in the previous year), but they are not significant. However, SED are a meaningful moderator for the SMP local effects. Between girls that are in the top quartile of Neuroticism and Openness to Experience, the effects are quite large and more significant than in the rest of the distribution. An important concern with this results is potential spillover effects of the SMP on SED that could bias the results. Results in Appendix D show no effect of program eligibility on the measures of socioemotional development.
In addition, there is suggestive evidence of complementarity of the SMP with a large mental health intervention, the Skills for Life Program, which covers a third of schools, based on vulnerability. Table D.5 shows that among children in SFLP participating schools, the SMP local effect is significantly larger, compared to children attending equivalent non-participant schools. 17
Finally, given the importance that sedentarism and diet have on energy balance, I compared children that engage in some type of physical activity outside the Physical Education versus those who do not. Results suggests that children that engage in physical activity benefit more from SMP
17
Table 3.6: LATE on BAZ by sub-group (girls)
Sample Parental investment Emotional Stability Openness Physical activity <p(75) >p(75) <p(75) >p(75) <p(75) >p(75) none some LATE -0.113 -0.207 -0.088 -0.289 -0.068 -0.32 -0.046 -0.166
0.233 0.241 0.089 0.148 0.089 0.141 0.170 0.084
Bandwidth 0.67 0.67 0.67 0.67 0.67 0.67 0.67 0.67
N 11464 11464 11215 11215 11463 11463 11470 11470
Notes: significant values in bold (p<0.1), adjusted for multiple hypothesis testing using the Sidak method. Bandwidth based on optimal mean squared error. Robust standard errors, in italics.
eligibility, while girls that are sedentary do not. The latter can be interpreted in, at least, two different ways: sedentary children might also be more likely to consume more snacks and junk foods, and/or active children might be more likely to avoid weight gain if the majority of their meals come from sources low in added sugars and fats.18
3.6.4 Discussion
Evidence from the Chilean school meal program suggests that eligible (low vulnerable) overweight girls have lower average body mass index during first grade, relative to non-eligible in 2015. There does not seem to be a meaningful difference between low and high vulnerable students in the same period. The short-term effects seem to be driven by improved nutritional quality in 2015. International evidence indicates that students have the largest weight gain during the summer (particularly those who are overweight or obese), hence it is expected that major effects appear during the first months of the school year (Baranowski et al., 2014; Kobayashi & Kobayashi, 2006; Moreno, Johnston, & Woehler, 2013). Additional evidence is needed to understand whether significant differences persist after prolonged exposure, specially as student reach high-school age.
When conducting sub-group analysis, evidence suggests that Neuroticism and Openness to Experience are important moderators of the SMP effects, consistent with previous literature. Given the attributes of personality associated with the underlying factors, it seems plausible that self-control is limited among children that are more prone to stress and negative feelings, while students that show curiosity and intellectual vocation are more likely to develop more in their executive functioning