Comparative Evaluation of Mixed Algorithms for Color Image Segmentation
Andreea Iancu, Bogdan Popescu, Dumitru Dan Burdescu, Marius Brezovan and Eugen Ganea
University of Craiova
Software Engineering Department
Craiova, Bd. Decebal 107, Romania
{
andreea.iancu, bogdan.popescu
}
@itsix.com,
{
dumitru burdescu, brezovan marius, ganea eugen
}
@software.ucv.ro
Abstract
In the present paper we are introducing a new method of salient object detection with very good results relative to other already known segmentation methods. We address through our research the problem of image segmentation evaluation by an efficient comparison of four complex al-gorithms. In order to compare our method with other ap-proaches, we built an evaluation framework that helped us with our experiments. The experimental results offer a com-plete basis for parallel analysis with respect to the precision of our algorithm, rather than the individual efficiency.
Keywords - color segmentation; graph-based segmenta-tion; salient region detection
1
Introduction
Color image segmentation is a very important operation performed on acquired images. The evaluation of this pro-cess [5] focuses on two main topics: generalityand objec-tivity.
Generality means that the test images in the benchmark should have a large variety so that the evaluation results can be extended to other images and applications.
Objectivity means that all the test images in the bench-mark should have an unambiguous ground-truth segmenta-tion so that the evaluasegmenta-tion can be conducted objectively.
The main target of image segmentation process is the domain-independent partition of the image into a set of re-gions which are visually distinct and uniform with respect to some property, such as grey level, texture or color. The problem of segmentation is an important research field and many segmentation methods have been proposed in the lit-erature so far ([1],[6],[7],[10], [2], [3], [4]).
The purpose of this paper is to emphasize the very good results of image segmentation obtained by our segmentation
technique, Graph-Based Salient Object Detection, and to compare them with other existing methods. The other algo-rithms that we use for comparison are: Unsupervised Seg-mentation of Natural Images via Lossy Data Compression, ROI-SEG: Unsupervised Color Segmentation by Combining Differently Focused Sub-Results, andMulti-Layer Spectral Segmentation.
They are all complex and well known methods, with very good results and proved efficiency in this area. We considered them mixed algorithms because they implement their logic based on some other famous segmentation mech-anisms:Efficient Graph-Based Image Segmentation (Local Variation),Normalized Cuts,Mean Shift
The experiments were completed using the images and ground-truth segmentations in the Berkeley segmentation dataset [11]. Since the ground-truth segmentation may not be well and uniquely defined, each test image in the Berke-ley benchmark is manually segmented by a group of people. The segmentation accuracy is measured taken into con-sideration the global consistency error and the local consis-tency error.
The paper is organized as follows: in Section 3 we briefly present previous studies in the domain of image segmenta-tion and the segmentasegmenta-tion method we propose. The method-ology of performance evaluation is presented in Section??. The experimental results are presented in Section 5. Sec-tion 6 concludes the paper and outlines the main direcSec-tions of the future work.
2
Related Work
Boundary-based segmentation methods can be broadly classified as either model-based [13] or visual feature-based [14] approaches. A distinct category of boundary-based segmentation methods that is relevant to our approach is represented by graph-based segmentation methods. Most graph-based segmentation methods attempt to search a
cer-tain structure in the associated edge weighted graph con-structed on the image pixels, such as minimum spanning tree [6], or minimum cut [15].
The topic of image segmentation evaluation is an open subject in today’s image processing field. The goal of exist-ing studies is to establish the accuracy of each individual approach and find new improvement methods. The seg-mentation methods require ground-truth image segmenta-tions as reference. The main drawback of providing such reference is represented by the resources that are needed. However, after analyzing the differences between the image under study and the ground-truth segmentation, a perfor-mance proof is obtained.
Some methods avoid the auxiliary costs and need of re-sources and base their studies on analyzing the homogene-ity of the image, without further research. This way, homo-geneity is measured within the resulting segments and the inhomogeneity across segments close to each other.
Berkeley image segmentation benchmark is the refer-ence that we use for our study. Using the same input, the provided image dataset, we are developing a customized methodology in order to efficiently evaluate our algorithm.
The experiments we performed have indicated that [2] offers the most similar approach to the one we are present-ing.
Our contribution is based on two main aspects: (a) in order to minimize the running time we construct a hexago-nal structure based on the image pixels, that is used in both color-based and syntactic-based segmentation algorithms, and (b) we propose an efficient method for segmentation of color images based on spanning trees and both color and syntactic features of segments.
3
Segmentation Methods
We will compare four different segmentation techniques: Unsupervised Segmentation of Natural Images via Lossy Data Compression [4], ROI-SEG: Unsupervised Color Segmentation by Combining Differently Focused Sub Re-sults [2],Multi-Layer Spectral Segmentationand our own boundary-based segmentation method. We have noticed that most of the mixed algorithms we studied partially im-plement or useMean Shift-Based[7] segmentation because it is generally effective and has become widely used in the vision community.
3.1
Graph-Based Salient Object
Detec-tion
We developed an efficient segmentation method that uses color and some geometric features of an image to process it and create a reliable result [12]. We used RGB as color
space in our work so far because of the color consistency and its computational efficiency.
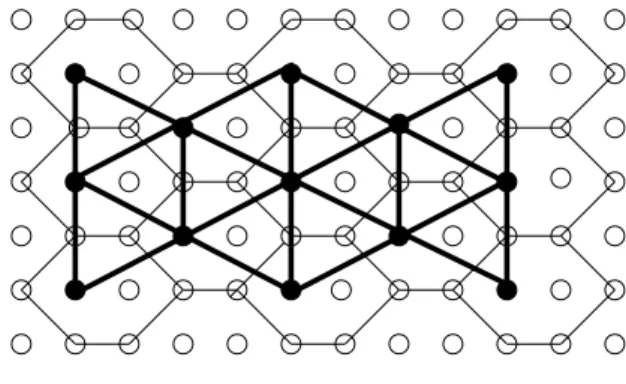
Figure 1. The grid-graph built on the hexago-nal structure of an image
As a particularity of this approach is the basic usage of hexagonal structure instead of color pixels. This is how we can represent the structure as a grid-graphG= (V, E)
where each hexagonhin the structure has a corresponding vertex v ∈ V, as presented in Figure 1. Every hexagon has six neighbors and each neighborhood connection is rep-resented by an edge in the set E of the graph. For each hexagon on the structure two important attributes are asso-ciated: the dominant color and the coordinates of the gravity center. Basically, each hexagonal cell contains eight pixels: six from the frontier and two from the middle.
The segmentation process on images is realized in two distinct steps. The first step represents a pre-segmentation step when only color information is used to determine an initial segmentation. The second step represents a syntactic-based segmentation step when both color and geometric properties of regions are used.
The first step uses a color-based region model and will produce a forest of maximum spanning trees based on a modified form of the Kruskal’s algorithm. In this case the evidence for a boundary between two adjacent regions is based on the difference between the internal contrast and the external contrast between the regions. The color-based segmentation algorithm builds a maximal spanning tree for each salient region of the input image.
The second step of the segmentation algorithm uses a new graph, which has a vertex for each connected compo-nent determined by the color-based segmentation algorithm. In this case the region model contains in addition some ge-ometric properties of regions such as the area of the region and the region boundary. The final segmentation step pro-duces a forest of minimum spanning trees based on a mod-ified form of the Bor˚uvka’s algorithm. Each determined minimum spanning tree represents a final salient region de-termined by the segmentation algorithm.
3.2
Unsupervised Segmentation of
Natu-ral Images via Lossy Data
Compres-sion
The clustering method follows the principle of lossy minimum description length (LM DL) [17] : Principle (Data Segmentation via Lossy Compression). The optimal segmentation minimizes the number of bits needed to code the segmented data, subject to a given distortion.
The lossy compression-based method is applied to seg-menting natural images. First, a low-level segmentation is applied to partition an image into many small homoge-neous patches. The superpixel notion is introduced. The superpixels are used to initialize the mid-level texture-based segmentation, which minimizes the total coding length of all the texture features by repeatedly merging adjacent seg-ments, subject to a distortion. The method studies several simple heuristics for choosing a goodεfor each image.
3.3
ROI-SEG: Unsupervised Color
Seg-mentation by Combining Differently
Focused Sub Results
This mechanism is used for the detection of a set of con-nected segments in a color image, based on a previously defined region-of-interest (ROI). The detected segments all have approximately the same color distribution as the in-put ROI. The sub-segmentation algorithm, which gets an arbitrarily shaped ROI and a color image as input, can be roughly divided into four subsequent steps. First, the im-age is converted into the CIE Luv color space in order to have an isotropic feature space. Second, the color distribu-tion of the ROI is modeled by a Gaussian Mixture Model (GMM), which is initialized by the results of a Mean Shift algorithm. Third, all color pixels are ordered by calculating Bhattacharyya distance values for each pixel. This is done by an efficient integral image based approach. The ordered pixel values are passed to a modified version of the Maxi-mally Stable Extremal Region (MSER) detector to compute the final result - a set of connected regions, which approxi-mately have the same color appearance as the input ROI.
3.4
Multi-Layer Spectral Segmentation
This algorithm introduces an affinity model for image segmentation that uses the relevance scores, learnt from the test image by semi-supervised learning [18], [19], [20], as graph affinities. The first step is to construct a multi-layer graph with pixels and regions generated by the mean shift algorithm [7]. A semi-supervised strategy is applied on the affinities in order to efficiently estimate them. In a single multi-layer framework of Normalized Cuts, the proposed full affinities are used to simultaneously cluster all pixel and
region nodes into visually coherent groups across all layers. The algorithm offers high-quality segmentation results by considering all intra- and inter-layer affinities in the spectral framework. The computation is very efficient by the eigen-decomposition of a sparse matrix.
4
Boundary-based performance evaluation
We describe comparative results of segmentation perfor-mance for our boundary based segmentation method and the three alternative segmentation methods mentioned above.The evaluation measure we present is closely related to the precision-recall framework. It represents a paramet-ric curve that illustrates the relation between accuracy and noise while the detector threshold varies. Precision is the fraction of detections that are true positives rather than false positives, while recall is the fraction of true positives that are detected rather than missed. In our particular case, we will consider precision as the number of pixels from the contour that can be found on a ground truth contour and use a similar approach for recall. In probabilistic theory, precision is the probability that the detectors signal is valid, and recall is the probability that the ground truth data to be detected.
The precision and recall measures are particularly mean-ingful in the context of boundary detection when we con-sider applications that make use of boundary maps, such as stereo or object recognition. It is reasonable to characterize higher level processing in terms of how much true signal is required to succeedR(recall), and how much noise can be toleratedP(precision). A particular application can define a relative costαbetween these quantities, which focuses at-tention at a specific point on the precision-recall curve. The
F−measure[5], is defined as:
F = P R
αR+ (1−α)P (1)
This equation contains the particular representation as the weighted harmonic mean ofP andR. A more acces-sible formula results whenα= 0.5:
F = 2P R
R+P (2)
The location of the maximumF-measurealong the curve provides the optimal detector threshold for the application given.We report the maximum F-measure value across an algorithm’s precision-recall curve as its summary statistic.
We will evaluate the performance of our algorithm on the Berkeley Segmentation Database (BSD) [11]. We will refer the characteristics of the error metrics previously defined by Martin et al. [5], explore potential problems with these met-rics, introduce precision/recall curves that use the BSD to evaluate the quality of a segmentation, and show that these
curves can be used to tune the parameters of a segmentation algorithm, and to characterize its performance over a range of parameter values.
5
Experimental Results
5.1
Berkeley Segmentation Dataset
Our study of segmentation quality is based on experi-mental results and uses the Berkeley segmentation dataset provided at [11]. We present comparative results of seg-mentation quality for the contour based segseg-mentation algo-rithm and the three alternative segmentation methods men-tioned above. The current public version of the Berkeley Segmentation Database is composed of 300 color images. The images have a size of481x321pixels, and are divided into two sets, a training set containing 200 images that can be used to tune the parameters of a segmentation algorithm, and a testing set containing the remaining 100 images on which the final performance evaluations should be carried out.
We have built a custom benchmark framework, that is processing the Berkeley dataset, converts it to our propri-etary format and preforms parallel analysis. Additionally, we have adapted the other mentioned algorithms to the same evaluation format for unitary purposes.
The human segmented images provide the ground truth boundaries. Therefore, any boundary marked by a human subject is considered to be valid. Since there are multiple segmentations of each image by different subjects, it is the collection of these human-marked boundaries that consti-tutes the ground truth. Based on the output of the previously presented algorithms for a set of images, we will determine how well the ground truth boundaries are approximated.
In order to determine an algorithm’s efficiency by com-paring it to the ground truth boundaries, a threshold of the boundary map is needed. At each threshold level precision and recall are taken into account, resulting in a precision-recall curve for each algorithm. Precision is the probability that a machine-generated boundary pixel is a true boundary pixel. Recall is the probability that a true boundary pixel is detected. Both these axes are considered to be sensible and intuitive. Precision is a measure of how much noise is in the output of the detector. Recall is a measure of how much of the ground truth is detected. The curve shows the inherent relation between these two quantities as the detector thresh-old changes.
Even though the precision-recall curve for an algorithm is a rich descriptor of its performance, it is still desirable to converge the performance of an algorithm towards a sin-gle number. We are providing an additional evaluation tool based on a histogram of the pixels that have a correspon-dent on a human segmentation boundary. This can provide
a ratio of efficient pixel from a segmented contour.
The summary statistic that we use is a measure of the dis-tance used to calculate the histogram. It is the F-measure, which is the harmonic mean of precision and recall. The F-measure is defined at all points on the precision-recall curve. We report the maximum F-measure value across an algorithm’s precision-recall curve as its summary statistic.
An alternative to precision-recall curves would have been the use of ROC curves.
Receiver operating characteristic (ROC) curves show, qualitatively, the same trade-off between misses and false positives that precision-recall curves show.[10] However, ROC curves are not appropriate for quantifying boundary detection. A disadvantage of this approach consists of not being efficient for evaluating boundary detection. This method uses as axes for a ROC curve the fallout and re-call. Recall is the same as above, and is also called hit rate. Fallout, or false alarm rate, is the probability that a true neg-ative was labeled a false positive. Unfortunately, this is not a measurable property for a boundary detector since it is not independent of the image resolution. By reducing the radius of the pixels by a factor of n so that the number of pixels grows asn2, the number of true negative will grow
fast in n while the number of true positives will grow only linearly in n.
In order to obtain the evaluation results, we have per-formed segmentation of the selected images with all the al-gorithms using a various set of parameters.
5.2
Precision-Recall Analysis
In order to proper evaluate the segmentation method we propose, we will use a well known quantitative contour-based measure: Precision - Recall metric. To calculate the Precision vs. Recall curve, we have elaborated and imple-mented a proprietary framework as an alternative to Berke-ley’s benchmark tool. We will present a parallel analysis of our method with three other segmentation algorithms men-tioned above.
We have implemented a custom definition for Precision and Recall. LetCbe the set of points on the objects’ con-tour derived from the segmentation andGC be the ground truth reference. We are using as ground truth definitions the human segmentations from Berkeley dataset. We are defining a matching functionmatch(C)as the number of pixels from C that have a correspondent inGCwith a
toler-anceε. The tolerance is represented by a minimum distance in pixels that is considered good for evaluation. Similarly,
match(GC) will represent the reverse calculation of
cor-respondent pixels, from ground truth to the segmentation result.
The equations are as follows:
P = match(C)
|C| (3)
P = match(G C)
|GC| (4)
In order to have a better analysis result and a more com-plete Precision-Recall curve we have performed 10 differ-ent tests for each subject per algorithm. More precisely, by varying some parameters, we have obtained 10 distinct points that define the curve for each approach.
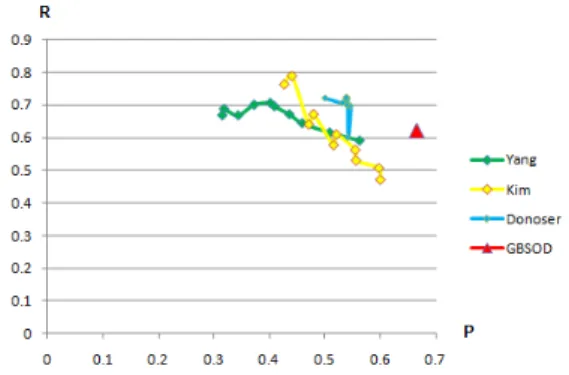
For our customized performance measure we have ob-tained the results illustrated in Figure 2.
Figure 2. Comparative analysis for: Graph-Based Salient Object Detection - GBSOD, Unsuper-vised Segmentation of Natural Images via Lossy Data Compression - Yang,ROI-SEG: Unsupervised Color Segmentation by Combining Differently Focused Sub-Results - Donoser, Multi-Layer Spectral Segmenta-tion - Kim
From the above presented diagram we can see that the pp(R;A) metric for our proposed method, denoted
GBSOD−Graph Based Salient Object Detectionis placed above the other graphics indicating a better perfor-mance result and a balanced algorithm.
5.3
Histogram based evaluation
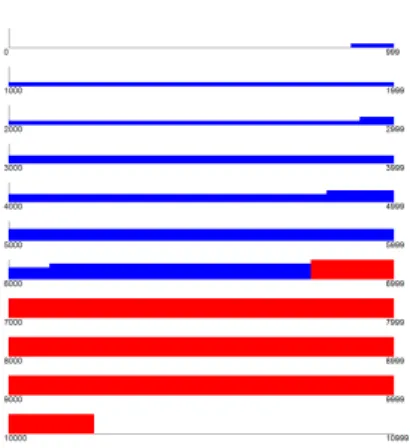
We have elaborated a histogram-based evaluation mech-anism aimed to compare contour segmentation results. The histograms present in a graphic manner thematch(C) func-tion used by the Precision-Recall equafunc-tion. They are very useful as they provide an overview of the results of every segmentation. We have listed in Figures 3, 4, 5, 6 individ-ual histogram analysis for all the four compared algorithms. From visual point of view, the red areas represent pixels that have no match with the ground truth contour, while the blue
areas denote matching pixels on both contours relative to the tolerance measureε.
Figure 3. Graph Based Salient Object Detec-tion Histogram
Figure 4. ROI-SEG: Unsupervised Color Seg-mentation by Combining Differently Focused Sub-Results
6
Conclusions
We described in this paper a new graph-method for im-age segmentation and extraction of visual objects. Starting from a survey of several segmentation strategies, we have performed an image segmentation evaluation experiment.
The study results offer a clear view of the effectiveness of each segmentation algorithm, trying in this way to offer a solid reference for future studies.
Future work will be carried out in the direction of inte-grating syntactic visual information into a semantic level of a semantic image processing and indexing system.
Acknowledgment
The support of the The National University Research Council under Grant CNCSIS IDEI 535 is gratefully ac-knowledged.
References
[1] K. Fu and J. Mui, “A survey on image segmentation. Pattern Recognition”, 1981.
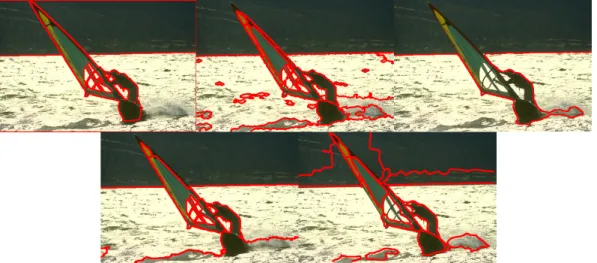
Figure 7. Comparative segmentation results: Human Segmentation, Graph Based Salient Object Detection, ROI-SEG: Unsupervised Color Segmentation by Combining Differently Focused Sub-Results, Multi-Layer Spectral Segmentation, Unsupervised Segmentation of Natural Images via Lossy Data Compression
Figure 8. Comparative segmentation results: Human Segmentation, Graph Based Salient Object Detection, ROI-SEG: Unsupervised Color Segmentation by Combining Differently Focused Sub-Results, Multi-Layer Spectral Segmentation, Unsupervised Segmentation of Natural Images via Lossy Data Compression
Figure 5. Unsupervised Segmentation of Nat-ural Images via Lossy Data Compression
Figure 6. Multi-Layer Spectral Segmentation
[2] M. Donoser and H. Bischof, “ROI-SEG: Unsupervised Color Segmentation by Combining Differently Focused Sub Results”, Institute for Computer Graphics and Vi-sion Graz University of Technology.
[3] T. H. Kim, K. M. Lee and S. U. Lee, “Learning Full Pairwise Affinities for Spectral Segmentation” Dept. of EECS, ASRI, Seoul National University, 151-742, Seoul, Korea
[4] A. Y. Yang, J. Wright, S. Sastry and Yi Ma “Unsuper-vised Segmentation of Natural Images via Lossy Data Compression” , Preprint submitted to Elsevier, 2007 [5] D. Martin, C. Fowlkes, D. Tal, and J. Malik, “A
database of human segmented natural images and its application to evaluating segmentation algorithms and measuring ecological statistics”, Proc. Int. Conf. Comp. Vis., vol. 2, pp. 416-425, 2001.
[6] P. Felzenszwalb and D. Huttenlocher, “Efficient Graph-Based Image Segmentation”, Intl J. Computer Vision, vol. 59, no. 2, 2004.
[7] D. Comaniciu and P. Meer, “Mean Shift: A Robust Ap-proach toward Feature Space Analysis”, IEEE Trans. Pattern Analysis and Machine Intelligence, vol. 24, pp. 603-619, 2002.
[8] C. Christoudias, B. Georgescu, and P. Meer, “Syner-gism in Low Level Vision”, Proc. Intl Conf. Pattern Recognition, vol. 4, pp. 150-156, 2002.
[9] R. Unnikrishnan, C. Pantofaru, and M. Hebert, “To-ward Objective Evaluation of Image Segmentation Al-gorithms”, IEEE Transactions on pattern analysis and machine inteligence, Vol. 29, No. 6, 2007.
[10] J. Shi and J. Malik, “Normalized Cuts and Image Seg-mentation”, IEEE Transactions on pattern analysis and machine intelligence, Vol. 22, No. 8, 2000.
[11] “Berkeley Segmentation and Boundary De-tection Benchmark and Dataset”, 2003, http://www.cs.berkeley.edu/projects/vision/grouping/segbench. [12] D. Burdescu, M. Brezovan, E. Ganea, and L. Stanescu,
“A New Method for Segmentation of Images Repre-sented in a HSV Color Space”, Lecture Notes in Com-puter Science, 5807, 606-617, 2009.
[13] C. Carson, S. Belongie, H. Greenspan, and J. Malik, “Blobworld: Image segmentation using expectation-maximization and its application to image querying and classification”, IEEE Trans. on Pattern Analysis and Machine Intelligence, 24(8),1026–1037, 2002.
[14] J. Fauqueur and N. Boujemaa, “Region-based image retrieval: Fast coarse segmentation and fine color de-scription”, Journal of Visual Languages and Comput-ing, 15(1), 69–95, 2004.
[15] J. Shi and J. Malik, “Normalized cuts and image seg-mentation”, Proc. of the IEEE Conference on Computer Vision and Pattern Recognition, San Juan, Puerto Rico, 731–737, 1997.
[16] “MSRA Salient Object Database”,
http://research.microsoft.com/en-us/um/people/jiansun/SalientObject/salient object.htm. [17] D. Dowson, B. Landau, “The Frechet distance be-tween multivariate normal distributions”, Journal Mul-tivariate Analysis 12 (3) (1982) 450455. 12
[18] S. Brin and L. Page. “The anatomy of a large-scale hypertextual web search engine” In WWW, 1998. [19] D. Zhou, O. Bousquet, T. N. Lal, J. Weston and
B. Scholkopf “Learning with local and global consis-tency”. In NIPS, 2003
[20] J.-Y. Pan, H.-J. Yang, C. Faloutsos, and P. Duygulu. “Automatic multimedia cross-modal correlation dis-covery”. In KDD, 2004.