Software Engineering Research Group
Technical Report Series
Faster Defect Resolution with Higher
Technical Quality of Software
Bart Luijten, Joost Visser
Report TUD-SERG-2010-006
Published, produced and distributed by: Software Engineering Research Group Department of Software Technology
Faculty of Electrical Engineering, Mathematics and Computer Science Delft University of Technology
Mekelweg 4 2628 CD Delft The Netherlands ISSN 1872-5392
Software Engineering Research Group Technical Reports: http://www.se.ewi.tudelft.nl/techreports/
For more information about the Software Engineering Research Group: http://www.se.ewi.tudelft.nl/
Note: Paper accepted for publication in the proceedings of the 4th International Workshop on Software Quality and Maintainability (SQM 2010)
c
⃝copyright 2010, by the authors of this report. Software Engineering Research Group, Department of Software Technology, Faculty of Electrical Engineering, Mathematics and Computer Science, Delft Uni-versity of Technology. All rights reserved. No part of this series may be reproduced in any form or by any means without prior written permission of the authors.
Faster Defect Resolution with Higher Technical Quality of Software
Bart Luijten
Delft University of Technology & Software Improvement Group The Netherlands
Email: [email protected]
Joost Visser
Software Improvement Group The Netherlands Email: [email protected]
Abstract—We performed an empirical study of the relation between technical quality of software products and the defect resolution performance of their maintainers. In particular, we tested the hypothesis that ratings for source code maintain-ability, as employed by the SIG quality model, are correlated with ratings for defect resolution speed. This study revealed that all but one of the metrics of the SIG quality model show a significant positive correlation.
Keywords-Software defects, Defect resolution, Maintainabil-ity, Source code metrics, Rank correlation, Issue tracker mining
I. INTRODUCTION
The ISO/IEC 9126 international standard for software product quality [1] defines three perspectives on product quality: internal quality, external quality, and quality-in-use. These perspectives correspond to three distinct phases in the lifecycle of a software product. Internal product quality concerns the quality of the product as can be perceived already in the construction phase, by observation of the prod-uct independent of its operation. Static analysis techniques, such as source code metrics, are the instrument of choice to determine internal quality. External product quality concerns the quality as it can be observed in the testing phase, by dynamic analysis of the product’s behaviour in a test environment. Quality-in-use concerns quality as perceived by its users (in a broad sense, e.g. including owners of the business processes that it supports) when the software product is operational.
For internal and external quality, the ISO/IEC 9126 stan-dard provides a breakdown of the overall notion of quality into six main characteristics and a further breakdown into over 20 sub-characteristics. One of the six main character-istics is maintainability, which is further broken down into
analysability,changeability,stability, andtestability. To operationalise the quality definitions of ISO/IEC 9126, the Software Improvement Group (SIG) has developed a pragmatic measurement model that maps a selection of source code metrics to themaintainabilitycharacteristic and its sub-characteristics [2]. Being based on static analysis, this model measures maintainability under the perspective of internal product quality. It can be applied to software products already in the construction phase, i.e. before enter-ing the testenter-ing or production phases. The model is employed
by SIG in its assessment and monitoring services [3, 4]. It also provides the basis of the software product certification service offered by SIG in collaboration with T ¨UV Infor-mationstechnik (T ¨UViT), which results in the quality mark
T ¨UViT Trusted Product Maintainability[5].
In a good quality measurement model, each selected metric has a strong relationship with the particular quality characteristic that is measured with it. In case of the SIG quality model, this means that the maintainability metrics as measured on the source code should have a strong relationship with the maintainability of the software product as experienced during maintenance activities. There is ample anecdotal evidence that suggests such a strong relation, based for example on the testimonials of software engineers and managers of numerous software products that have been evaluated with the SIG quality model in the context of software assessment, monitoring, and certification. In this paper, we report on an empirical study that investigates the relationship between maintainability and actually performed maintenance in a systematic manner.
In order to compare maintenance activities to our main-tainability metrics, we need to quantify these activities in some manner. Properties of maintenance activities that one would like to quantify include their effectiveness (Do defects get solved correctly?) and their efficiency (How much maintenance effort is invested?). Unfortunately, reliable data regarding correctness and effort of fixes is notoriously hard to come by, simply because they are usually not recorded.
We have looked to the data available in issue tracking systems to find a substitute for effort data. These trackers record for each defect when it was reported and when it was solved. This gives us an indication of defect resolution speed, which in turn we use as a substitute for defect resolution effort. By aggregation of resolution durations for individual defects during limited time-frames, we can construct an indicator of maintenance efficiency for the version of the product under maintenance in that time-frame. Thus, the experiment we report on seeks to answer the following research question:
What is the relationship between software product quality as measured by the SIG quality model and the speed at which defects in these products are solved by the development / maintenance team?
issue repository defects defects defects defects defects snapshot correlation test snapshot ratings defect resolution ratings project site
Figure 1. Overview of the experiment.
We have conducted the experiment on data retrieved from the issue trackers and source code of a range of open source software products.
In Section II we explain our methods for data collection and analysis, including the SIG quality model and the quantification of defect resolution speed. In Section III we describe the systems on which we have conducted the experiment. In Section IV we give the results of analysing these systems, including the various hypotheses that we are able to accept. In Section V we list and discuss the threats to validity of our experiment. In Section VI we compare our work to related efforts. In Section VII we conclude the paper with a discussion of the relevance of our results and avenues for future work.
II. METHODS
An overview of the experiment process is given in Fig-ure 1. The process consists of analysis streams for issues (explained in II-A and II-B) and for source code (II-C). Issues of type defect are selected and grouped by source code snapshot date (as indicated by the calendar icon). The results of these streams are combined in a correlation analysis (II-D).
A. Issue analysis
The process of reporting and resolving issues for a system during its development and/or maintenance is of-ten handled through the use of an Issue Tracking System (ITS). Examples include Bugzilla1, Issuezilla2, Jira3and the
SourceForge Issue-Tracker4. Typically, an ITS can record
for each issue its type (e.g.defect,task), its state (e.g.new,
assigned, resolved,closed), the date of submission and of each state change, the submitter, any comments by others, and indications of severity and/or priority.
We constructed a Java tool that allows us to capture information from ITS repository dumps. The tool includes
1http://www.bugzilla.org/
2A modified Bugzilla by CollabNet, http://www.open.collab.net/. 3http://www.atlassian.com/software/jira/
4http://issue-tracker.sourceforge.net/
Defect resolution time (days)
Count 0 1000 2000 3000 4000 5000 6000 0 200 400 600 800 1000
Figure 3. Histogram of defect resolution times.
a generic data model that can store the needed data from different issue trackers in a unified fashion. The data model is optimised for post-mortem queries on large batches of issues, rather than for views and updates of the latest version of individual issues.
For the experiment reported in this paper, we measured
issue resolution time defined as the time an issue is in an open state. Thus, we look at the time an issue is marked as being in thenew or assigned state but not in theclosed or
resolvedstate. If an issue has been closed and then reopened, all open intervals count towards the issue resolution time, but the intervals in which the issue was closed do not. We take this as an indicator of the effort that was spent on solving the issue, for lack of availability of more accurate data.
Since we want to compare issue resolution times with maintainability measurements for particular versions of soft-ware products (snapshots at particular dates), we need to group issues by product version. For each version (i.e. snapshot date), we count as relevant issues those that are closed and/or resolved between that version and the next. We assume that most, if not all, of the work on solving an issue will be performed just before it is closed.
In this experiment, we focus exclusively on issues of type defect. The processes of submission and resolution of defects is characterised by a different level of urgency than other types of issues, such as new features, tasks, patches, or enhancements. Indeed, visualisation of issue churn for defects and other types bears out that they behave quite differently [6]. Thus, pooling defects with other issues does not seem to be justified.
B. Quantification of defect resolution efficiency
The defect resolution times of individual defects need to be aggregated to issue resolution efficiency ratings for the group of defects associated by date to each snapshot. Defect resolution times do not follow a normal distribution, but rather a power-law-like distribution (see Figure 3). As a result, a simple aggregation by taking the mean ormedian
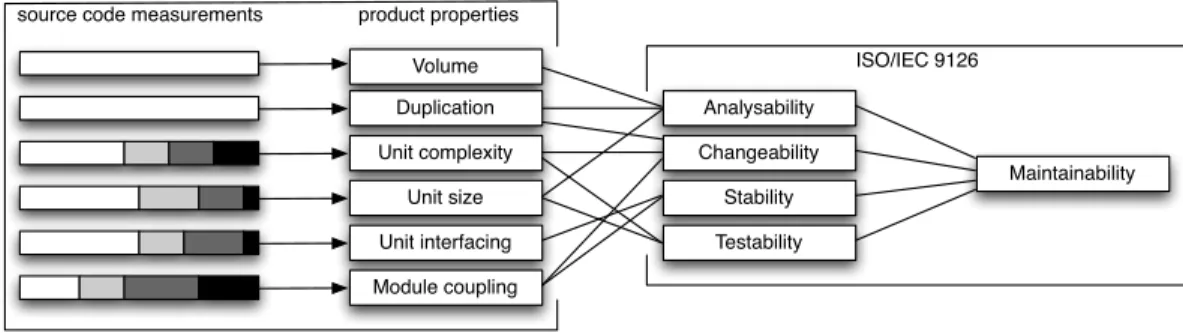
Volume Duplication Unit complexity Unit size Unit interfacing Module coupling Analysability Changeability Stability Testability Maintainability ISO/IEC 9126 product properties source code measurements
Figure 2. The SIG Quality Model maps source code measurements onto ISO/IEC 9126 quality characteristics.
of the defect resolution times is not appropriate. Instead we use so-calledrisk profiles.
A risk profile can be composed by assigning items to risk categories based on their metric values. For defect resolution time, we use the following risk categories:
Category Thresholds
Low 0 - 28 days (4 weeks)
Moderate 28 - 70 days (10 weeks)
High 70 - 182 days (6 months)
Very high 182 days or more
For example, a defect with a resolution time of 42 days falls into themoderate risk category.
Based on this risk assignment, a risk profile is constructed by calculating the percentage of items in each category. For example, h70,19,11,0i is the risk profile of a product
history where 70% of all defects were resolved within 4 weeks, 89% were solved within 10 weeks, and none took longer than 6 months to solve.
Risk profiles can be mapped to ratings to enable straight-forward comparison. We rate on a unitless scale between 0.5 and 5.5 that can be rounded to an integral number of
stars (more is better). By benchmarking against about 100 releases of various open source products [6] we calculated the following mapping:
Rating Moderate High Very High
***** 8.3% 1.0% 0.0%
**** 14% 11% 2.2%
*** 35% 19% 12%
** 77% 23% 34%
For example, a snapshot with risk profileh70,19,11,0iwill be eligible for a ranking of 3 stars. By interpolation our ranking algorithm establishes an exact rating of 3.25.
We adopted the notions of risk profiles and star ratings from the SIG maintainability model [2] where they are used to aggregate source code metrics, rather than defects. This model is summarised below.
C. Source code analysis
The SIG has developed a layered model for measuring and rating the technical quality of a software system in terms of the quality characteristics of ISO/IEC 9126 [2]. The layered structure of the model is illustrated in Figure 2. In the first layer, source code analysis is performed to collect measurement data about the software system. The analysis involves well-known metrics such as Lines of Code (LOC), duplicated LOC, McCabe complexity numbers, parameter counts, and dependency counts. These metrics are collected on the level of basic building blocks such as lines, units (e.g. methods or functions), and modules (e.g. files or classes).
Subsequently, these metrics for building blocks are mapped onto ratings for properties at the level of the entire software product, such as volume, duplication, and unit complexity. As in the case of defects, these ratings take values in the interval between 0.5 and 5.5, which can be rounded to an entire number of stars between one and five. This constitutes a unitless ordinal scale that facilitates communication and comparison of quality results at the level of entire software products.
The mapping functions for volume and duplication are straightforward translations of LOC-based metrics to ratings. The remaining mapping functions make use of risk pro-files as intermediate device. Each profile is a partition of the volume of a system (measured typically by LOC) into four risk categories: low, moderate, high, and very high risk. For example, if 4,000 LOC of a 100,000-LOC system sit in methods with a McCabe number higher than 50, the volume percentage in its very high risk category is 4.0%. Thresholds for metric values (like McCabe > 50) have been chosen based on statistical study of a large set of representative systems. Likewise, thresholds have been chosen to define a mapping of risk profiles to quality ratings.
For the extraction of measurement values from source code, we rely on the Software Analysis Toolkit (SAT) of the SIG. The SAT offers source code analysis capabilities for a wide range of languages as well as generic modules for aggregating and mapping source code metrics in accordance with the SIG quality model.
Table I
SOFTWARE VERSIONS IN DATASET
software main LOC issue snapshots snapshots issues defects defects product language (latest) tracker (total) (selected) (total) (total) (selected) Abiword C++ 332,132 Bugzilla 1 1 10,941 9,581 130 Ant Java 122,130 Bugzilla 20 19 5,192 3,595 1,856 ArgoUML Java 171,402 Issuezilla 20 20 5,789 4,327 3,008 Checkstyle Java 44,653 SourceForge 22 16 612 612 419 Hibernate-core Java 145,482 Jira 1 1 4,009 2,421 229 JEdit Java 54,235 Sourceforge 1 1 3,401 3,401 351 Spring-framework Java 118,833 Jira 21 21 5,966 2,415 1,415 Subversion C 218,611 Issuezilla 1 1 3,103 1,849 65 Tomcat 6.0 Java 163,589 Bugzilla 19 8 644 547 272 Webkit C++ 1,255,543 Bugzilla 1 1 22,016 20,970 1,447
N=10 107 89 61,673 49,718 9,192
D. Statistical methods
The ratings for maintainability and for defect resolution time have an ordinalscale. Furthermore both the maintain-ability ratings and defect resolution time do not follow the normal distribution in our sample. For these reasons we have chosen to use the (non-parametric) Spearman rank-correlation method [7] for analysing rank-correlation between these metrics, instead of the Pearson product-moment cor-relation coefficient.
III. DATA
A. Software products used as subjects
The data we used for our experiments was obtained from the ITSs of 10 open source projects. See Table I for an overview. These projects were chosen because they are well-known projects and have publicly available source code and issue repositories. A few of the projects (notably ArgoUML and Checkstyle) were included because of the large amount of previous research done on these projects (e.g. [8, 9, 10]). For half of the systems, data has been collected for multiple snapshots, with a total of 107 snapshots. All systems have non-trivial size, with Checkstyle as one of the smaller systems (44 KLOC in the most recent snapshot) and Webkit as the largest (1.2 MLOC). The total number of collected issues for the 10 systems is more than 61,000 of which almost 50,000 are defects.
B. Data cleaning and selection
Several steps have been taken to reduce the data set for the experiment. Firstly, all duplicate issues were removed, as well as issues that presented any kind of inconsistency. Also, issues were removed that could be established not to pertain to the source code. Secondly, snapshots with 5 or fewer issues associated with them were rejected.
From the resulting issues, we selected only issues of type
defectand with status closedorresolved. This resulted in a final set of about 9,000 defects.
IV. RESULTS
A. Tested hypotheses
We tested rank correlation between the calculated rat-ings for defect resolution efficiency against each of the 11 ratings in the SIG quality model. Thus, for each x ∈ {maintainability, analysability, changeability, stability, testability,... } we have the following null hypothesis and alternative hypothesis:
Hx
0: There is no relation between defect resolution
efficiency and x.
Hx
alt: There is a relation between defect resolution
effi-ciency and x.
As stated above, these hypotheses were tested using Spear-man’s rank correlation. Since we expect a positive correla-tion, we used a one-sided test.
B. Correlation results
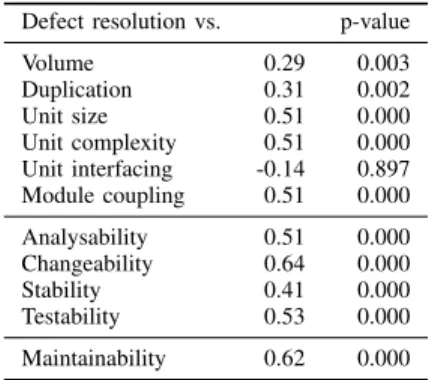
The results of the rank-correlation test are shown in Table II. All correlations, except for unit interfacing, are significant at a 99% confidence level. The significant correlation factors ρs vary between 0.29 and 0.62. This
means that for all x ∈ {maintainability, analysability, changeability, stability, testability, volume, duplication,
Table II
RESULTS OFSPEARMAN’S RANK-CORRELATION TEST BETWEEN RATINGS FOR DEFECT RESOLUTION TIME AND MAINTAINABILITY.
Defect resolution vs. ρs p-value
Volume 0.29 0.003 Duplication 0.31 0.002 Unit size 0.51 0.000 Unit complexity 0.51 0.000 Unit interfacing -0.14 0.897 Module coupling 0.51 0.000 Analysability 0.51 0.000 Changeability 0.64 0.000 Stability 0.41 0.000 Testability 0.53 0.000 Maintainability 0.62 0.000
unit size,unit complexity,module coupling}we reject the null hypothesisHx
0 and maintain the alternative hypothesis
Hx
alt that a relation exists with defect resolution efficiency.
Forx=unit interfacing we can not reject or accept either
hypothesis. The remainder of this section discusses these results in more detail.
C. Correlation with system properties
The first six rows of the table concern the system prop-erties. These are measured directly from the system source code. As stated, most of these correlate positively with the defect resolution rating.
The correlations to volume and duplication are lower (around 0.30) than the others. In a larger system, we expect it to take longer to locate the locations where fixes need to be made. In a system with more duplication, each defect might need to be fixed in multiple places. The lower correlation factors suggest that these effects of volume and duplication exist, but have lower impact than the effect of the other properties in the model.
The correlations to unit complexity, unit size, and mod-ule coupling are stronger (around 0.51). This demonstrates that, as expected, defects in systems with large and highly complex units (methods, functions, etc.) take more time to fix. Also, systems composed of modules (files, classes, etc.) that have high inward coupling apparently apparently take more time to fix.
For unit interfacing (rated via a risk profile for the number of parameters of each unit) the correlation result is not statistically significant. Therefore, we can not accept or reject the associated hypotheses. It is possible that with a larger data set significant results can be obtained that either show absence or presence of correlation. Also, the unit interfacing rating could be related with a different measure of issue handling efficiency. These questions lie outside the scope of our experiment and will be discussed below as possibilities for future work.
D. Correlation to quality characteristics
The next four rows of the table concern the maintainability subcharacteristics that compose the intermediate level of the SIG quality model. The ratings of these subcharacteristics are calculated from the ratings of system properties. All four subcharacteristics correlate positively. Interestingly, the correlation factors tend to be higher than the ones for the system properties from which they are calculated. For example, the correlation factor fortestability is 0.53, while the factors for unit size and unit complexity (from which the testability rating is calculated) are both 0.51. Apparently, the mapping of properties to subcharacteristics reinforces the correlation.
The last row of the table concerns maintainability itself. Maintainability is correlated to defect resolution time with one of the highest factors of all (0.62), showing again the reinforcing effect of aggregation in the model.
V. THREATS TO VALIDITY
As suggested by Perry et al. [11], we discuss three types of influences that might limit the validity of our study.
A. Construct validity
Do the variables and hypotheses of our study accurately model the research question?
Lack of issue detail: The data recorded in ITSs does not allow us to distinguish between different activities in solving an issue, such asanalysis(finding out what changes need to be made),modification(actually changing the code), and verification (checking that the defect has indeed been resolved). Lacking such detail, we compare the entireissue lifetime to the maintainability characteristics, as well as its subcharacteristics (analysability, etc.) and the system properties (complexity, etc.). We expect this to decrease
significance and strength of correlation, which means our positive results are conservative.
Idle time and double time: Though we filter out the periods between closing and re-opening of an issue, the issue resolution time that we measure potentially includes idle time: though the issue is open, the team may not be working on it. On the other hand, our metric does not take into account that more than one team member may be working on the same issue at the same time. We believe that idle time is a common phenomenon and further study is warranted to discover whether it occurs in roughly the same degree in all defects in all projects. We believed that double time is rare and has a very limited effect on our study.
B. Internal validity
Can changes in the dependent variables be safely at-tributed to changes in the independent variables?
Unequal representation: The dataset contains systems with just one snapshot and systems with multiple (up to 21). As a result, not all systems are equally represented and do not contribute with equal weight to the result. Still, multiple snapshots of the same system might be regarded as independent data points since they are separated in time and large variations can be observed among the ratings for different snapshots of the same system. Future experiments on larger datasets, or datasets without multiple versions of a single system, can counter this threat more definitively.
Confounding effects: We did not measure some aspects of software projects that could have an influence on the issue handling process, such as team size or project popularity. Such factors could lead to larger or smaller numbers of issues being reported or fixed. We believe the influence of these factors to be small.
C. External validity
Can the study results be generalised to settings outside the study?
Bias due to issue tracker usage: Our experiment in-cludes only data from projects that make systematic use of an issue tracker. It is plausible this is a trait of well-organised projects that embrace best practices and follow a mature software engineering process. The established relationship between source code maintainability metrics and issue resolution efficiency should therefore not be assumed to hold also for projects at a lower maturity level.
Generalisation beyond Java:Most projects in our study have Java as the main programming language. Even though the SIG quality model has been designed to include metrics that are applicable to a wide range of languages, the typical measurement values may be different per language. We believe that generalisation of the results of our study to languages with similar characteristics, such as C# and C++, is justifiable. For languages with different characteristics, such as COBOL (procedural), PHP (dynamically typed), or Erlang (functional) further experiments are warranted.
Generalisation to commercial projects: We studied only data from open source projects. The organisation, management, and execution of open source projects typically differs from those of commercial projects. Still, the bound-aries between these two kinds of projects are not strict. Many (successful) open source projects are initiated, supported, organised, and/or managed by a commercial organisation (e.g. Oracle/SUN for OpenOffice.org, IBM for Eclipse, etc., VMware/SpringSource for the Spring Framework, and Apple for Webkit). On the other hand, commercial software projects are increasingly adopting practices that have been common practice in open source projects for a longer period already, such as unit testing, continuous integration, usage of ITSs, globally distributed teams, nightly builds, and (elements from) agile methodologies. Due to these blurring boundaries, we believe that our results can be generalised to commercial projects that are run in a “modern” way, but not necessarily to classical waterfall-development projects.
VI. RELATED WORK
A. The maintainability index
We start our related work discussion with a comparison to empirical studies conducted on the Maintainability Index (MI) [12], because the construction of the SIG maintain-ability model was originally motivated by criticism of the MI [13, 2].
Oman et al. introduced the MI as a source-code measure for maintainability [12]. The MI is a four-metric polynomial, based on the Halstead effort metric, McCabe’s cyclomatic complexity metric, lines of code and lines of comment. The constants in the formula that combines these metrics were initially established by a regression analysis against subjective assessments of maintainability for 8 software systems ranging between 1,000 and 10,000 lines of code written in C or Pascal [14]. The subjective maintainability assessments of the subject systems was elicited from the
system’s maintainers by surveys based on the Air Force Op-erational Test and Evaluation Center (AFOTEC) evaluation guide [15]. All systems were programmed in Pascal or C and were obtained from two different sites of Hewlett-Packard. For the model obtained by regression analysis, a value of
R2 = 0.90 was reported as goodness of fit. A further 6
systems sized between 1,000 and 8,000 lines of code in the same languages were used to validate the model. A Spearman rank-correlation test was performed between the MI values calculated from the source code of these systems and the subjective assessments of their maintainability. A correlation factor was reported of ρ = 0.74, but without statistical significance(p >0.05).
In spite of the lack of statistical significance, an im-proved version of the model was applied to 11 industrial software systems and their components where “[i]n each case, the results from [the] analysis corresponded to the maintenance engineers ‘intuition’ about the maintainability of the (sub)system components” [16]. The improvements of the model include using Halstead volume instead of Halstead effort and making it optional to use the metric for comment lines. On the original validation data, the average residual between the original and improved model is reported to be low (less than 1.4 for values ranging between 45 and 95).
The three-metric polynomial MI (i.e. without the optional factor for number of comment lines) was applied to all components of “a large industrial software system” and compared to the number of recorded defects for each of these 30 components [17]. A correlation factor is reported of 0.83, but no further details of this study were provided.
The three-metric and four-metric polynomial MIs were applied to various versions of the same software system [18]. The earlier versions were developed in FORTRAN, while later re-engineered versions co-existed in C and Ada. For one version in each language, also a subjective assessment was performed. No statistical analysis of correlation was performed, but “[a]lthough the numerical values of the subjective assessments do not correspond exactly to the MI values obtained for those systems, the scale and direction of the results are similar” [18].
The MI and the SIG maintainability model show some overlap in their ingredient metrics, such as lines of code and cyclomatic complexity. However, the way these mea-surements are aggregated and combined are very different, with the MI taking themeanof these metrics while the SIG model constructs risk profiles. The two models also differ in the scale used for rating. In the SIG model, an ordinal scale between 0.5 and 5.5 is used on all levels, with a rounding convention to integral numbers between 1 and 5. The MI derives its scale from the 25-item AFOTEC evaluation guide where each item gets rated on an ordinal scale between 1 and 5, leading to an overall score between 25 and 125. The constructed polynomial model in practice attributes values on a wider scale, with values for entire systems reaching
over 140 and values for parts of systems falling below -90. Calibration of the MI model was done with 8 software systems of a single company written in procedural languages totalling no more than 80,000 lines of code. Calibration was done against subjective assessments of maintainability of these 8 systems by their maintainers. The SIG model is calibrated with systems of multiple organisation and open source communities with a total of more than 5 million lines of code written in modern languages such as Java and C#. Calibration is done against a desired symmetric distribution of the subject systems over the rating scale.
The validation of the SIG model provided in the current paper can be compared with the validation reported by Cole-man et al. [17] that correlates the MI for system components with their recorded number of defects. Both validations use a defect metric as dependent variables, though we do not use defect counts for components, but defect resolution speed for the system as a whole. Our validation uses 100 snapshots of 10 open source systems, while the reported MI validation uses 30 components of a single proprietary system.
B. Prediction of defects
Most of the existing work which mines ITSs is focused on bug prediction. Examples of this are the works of Ratzinger et al. [19] and Graves et al. [20]. Both attempt to predict the amount of bugs affecting a piece of software using the corresponding source and fault history. Interestingly, they identify the number of previous changes to a given module as a major influence, which is not a source code metric.
It is also possible to attempt to predict bugs in new or changed code by identifying the past changes that introduced a bug [21, 22, 23, 8]. This is done by examining the change log messages for indicators that a bug was fixed and assuming that the change that last touched the same code will have introduced the bug. Even though this seems to be a rather strong assumption, prediction accuracies of 35% [8] to 60% [23] have been reported.
Gyimothy et al. [24] study the Chidamber-Kemerer suite of object-oriented metrics [25] within the Mozilla project5.
They assign bugs in the ITS to source code in a specific release by examining patch files submitted with a bug. Using logistic regression analysis, they show that the Coupling Between Objects metric is the best predictor for fault-proneness, with precision and recall of just under 70%. However, due to the necessity of having patches available, their approach only takes a small percentage of bugs into account, which compromises generalisability [26].
Another evaluation of the Chidamber and Kemerer was later done by Briand et al. [27], who also examine a large number of metrics defined by others. They perform logistic regression techniques to determine impact on fault-proneness of the metric values. As a dataset, they use
5http://www.mozilla.org
systems developed by students in a computer science course, with the faults determined by an independent team of pro-fessionals. Their best fitted model consists of four coupling and three inheritance measures, with a precision of 84% and recall of 94%. This result is consistent with others in placing emphasis on coupling metrics above size and complexity. Interestingly, the often-used McCabe complexity [28] is not included in this analysis. A number of later works have replicated the verification of the Chidamber and Kemerer metrics, using various techniques such as threshold models [29] and neural networks [30].
Zimmermann et al. [31] examine the transferability of bug prediction models between projects. Out of the 622 project version combinations they tested, an astonishingly low 3.4% was able to reach their 75% cross-prediction accuracy threshold. Further investigation allows them to formulate a set of guidelines on how to select a project that will provide maximum prediction accuracy for a given target project. Unfortunately, Zimmermann et al. [31] make no claims on the usability of a general model, trained on all subject systems.
A problem with some of the previously discussed work is the dependence on available links between Version Control System (VCS) and ITS. In order to determine the source code impacted by an issue, many authors use issue identifiers present in commit logs, including [31, 32, 19, 21, 22, 23, 8]. Both Ayari [33] and Bird et al. [26] investigate the validity of this approach. Both show that a large amount of the issues present in the ITS are typically not traceable to source code. Bird et al. [26] demonstrate that this leads to a bias in test results. This is a big threat to the validity of studies adopting this method. In our experiment, no use was made of VCS-ITS links. Rather, we looked at the total corpus of issues that are reported and closed for a product release or a time period. Furthermore, we are not directly interested in predicting new issues, but in the influence of software maintainability on the speed of issue solving.
C. Other maintainability indicators
Riaz et al. [34] conducted a systematic review of studies into software maintainability prediction and metrics. They conclude that “there is little evidence on the effectiveness of software maintainability prediction techniques and models”. In particular, out of 710 studies identified by automatic literature search, only 15 studies were deemed sufficiently promising for detailed assessment, which revealed that “met-rics related to size, complexity and coupling were to date the most successful maintainability predictors employed”. Four of the selected studies concern the Maintainability Index and were discussed above [14, 16, 17, 18].
Among the other studies identified by Riaz et al., several construct and test predictive models for maintainability based on various kinds of regression analysis [35, 36]. Van Koten et al. [37] use Bayesian Networks. Some of the
identified studies use defect data as dependent variable, such as error rate [38] and moments of detecting and correcting defects [39].
Riaz et al. note that many of the identified studies rely on data-sets that limit generalisability of the results. This can be the case, for instance, when subject systems from a single source are used as in the various MI studies, when use is made of students to perform maintenance tasks, or when the number of data points is small. In case of our experiment, a large amount of source code from many different sources were used. Though all are open source systems, professional organisations are involved in their development.
VII. CONCLUSION
A. Contributions
We have conducted an empirical study that demonstrated a significant, positive statistical correlation between the quality of software products as measured by the SIG quality model and the speed at which defects are solved by the development and/or maintenance teams of these products.
The correlation was shown to exist on all three levels of the SIG quality model, i.e. at the level ofmaintainability, at the level of subcharacteristics of maintainability as defined by ISO/IEC 9126, and at the level of directly observable product properties, such as volume, duplication, and unit complexity. For only one product property in the SIG quality model (unit interfacing, measured in terms of thenumber of parameters per unit) no correlation was found.
The strength of correlation as found in the experiment proved to increase at higher levels of aggregation. This suggests that the various metrics employed in the SIG quality model reinforce each other’s effects. In other words, the quality model as a whole is more informative regarding issue resolution efficiency than any of its parts.
B. Discussion
The relationship between source code metrics for main-tainability and duration of maintenance tasks established by our experiments constitutes an important empirical valida-tion of the SIG quality model.
This validation was performed on the defects and source code of open source projects that use Java as main pro-gramming language. Due to these characteristics, the study has immediate consequences for a large part of currently ongoing software engineering activities: defect resolution is one of the most important activities in software development and maintenance; recent years have seen a rapid growth of open source software as well as adoption of its best practices in commercial software projects; and Java is currently one of the most widely used programming languages.
Extrapolation of the experiment results beyond Java and beyond open source must be done with care. We have not identified a priori reasons why such extrapolation would not be possible. Nonetheless, an extension of the presented
experiment to other programming languages and other devel-opment models would be of great added value. We explain our plans in that direction below (Section VII-C).
Extrapolation of the experiment results beyond defects is not a priori expected to be possible, since other types of issues have already been observed to have very different statistical properties.
We believe that the experiment outcomes for the SIG model and its ingredient metrics can be understood to set a benchmark for other quality models and source code metrics. When proposing a new metric or new model intended to measure maintainability, a validation along the lines of the experiment described here can be performed to establish whether the proposal adds to the state-of-the-art. Also, when making modification to the SIG quality model, a repetition of the experiment should be carried out to determine the desirability of the modification.
C. Future work
Throughput ratings for other issue types: In this exper-iment we have focussed exclusively on issues of typedefect. It would be interesting to see whether it is also applicable to issues of other types, such as refactorings and new features.
Expand the dataset: The dataset we used consists of ten open source projects, five of which are represented by multiple versions. Increasing the size of this set will help in strengthening the confidence in the experiment results. In particular, it will be interesting to add commercial projects and to add projects with a main programming language different from Java. Also, with larger dataset, it is possible that significant (positive or negative) correlation results can be obtained forunit interfacingas well.
Normalise the throughput ratings: It is clear there are still a number of confounding factors present in the throughput ratings. For example, differences in team size between projects, that influence the throughput times. On the other hand, it seems that the correlation between throughput and maintainability ratings holds even better for successive versions of a single system. We suspect that a number of confounding factors could be eliminated by normalising the ratings in some way. Again, this would improve confidence in the influence of the maintainability rating.
Lower-level analysis: Ideally, the analysis we per-formed should be done on the level of source code modules. Knowing where an issue was fixed in the source code is necessary to do this, however. If subject systems that provide such information are available, this is a very interesting research direction. We expect this will give a much clearer picture, because the metrics of irrelevant parts of the system do not influence the result.
Unit interfacing: The lack of significant results for theunit interfacing system property gives rise to directions for further investigation. Repetition of the study with more data was mentioned above. Alternatively, a different source
code metric could be chosen to quantify unit interfacing itself. In the current model, the number of parameters of units are used for this purposes. Alternatively, a weighted variant of this metric could be used (giving more weight to parameters of “richer” types) or a metric that takes not only explicitly declared parameters into account, but also access to variables. Finally, hypotheses can be formulated and tested that relate unit interfacing to other issue handling metrics (examples follow below).
Correlations with other indicators: We quantified effi-ciency of maintenance activities in terms of defect resolution speed. Correlation of the SIG quality model with other indicators is of interest as well. Examples are resolution times for other types of issues than defects or the number of people that work on issues. Also, the effectiveness of maintenance activities (Are issues resolved correctly?) is worth investigation. This could be measured for example by the number of times issues get reopened or by the number of new defects that are introduced while resolving an issue.
ACKNOWLEDGMENT
Thanks to Miguel Ferreira of SIG for configuring and running source code analysis tooling to produce data for this study. Thanks to the developers of various open source systems for communication that helped us clean data and interpret results in our study.
REFERENCES
[1] International Organization for Standardization, “ISO/IEC 9126-1: Software engineering - product quality - part 1: Quality model,” Geneva, Switzerland, 2001.
[2] I. Heitlager, T. Kuipers, and J. Visser, “A practical model for measuring maintainability,” in6th Int. Conf. on the Quality of Information and Communications Technology (QUATIC 2007). IEEE Computer Society, 2007, pp. 30–39.
[3] A. v. Deursen and T. Kuipers, “Source-based software risk assessment,” inProc. Int. Conf. Software Mainte-nance. IEEE Computer Society, 2003, p. 385. [4] T. Kuipers, J. Visser, and G. de Vries, “Monitoring the
quality of outsourced software,” inProc. Int. Workshop on Tools for Managing Globally Distributed Software Development (TOMAG 2007), J. van Hillegersberg
et al., Eds. Center for Telematics and Information Technology, Netherlands, 2007.
[5] R. Baggen, K. Schill, and J. Visser, “Standardized code quality benchmarking for improving software main-tainability,” in4th International Workshop on Software Quality and Maintainability (SQM 2010), March 15, 2010, Madrid, Spain, 2010.
[6] B. Luijten, “The influence of software maintainability on issue handling,” Master’s thesis, Delft University of Technology, 2010.
[7] C. Spearman, “Demonstration of formulæ for true measurement of correlation,”The American Journal of Psychology, vol. 18, no. 2, pp. 161–169, Apr. 1907. [8] S. Kim, K. Pan, and E. J. Whitehead Jr, “Memories
of bug fixes,”FSE ’06: Proc.14th ACM SIGSOFT Int. Symposium on Foundations of Software Engineering, pp. 35–45, 2006.
[9] A. Zaidman, B. Rompaey, S. Demeyer, and A. van Deursen, “Mining software repositories to study co-evolution of production & test code,”ICST ’08: Proc. 1st Int. Conf. on Software Testing, Verification, and Validation, pp. 220–229, 2008.
[10] Z. Lubsen, A. Zaidman, and M. Pinzger, “Using asso-ciation rules to study the co-evolution of production & test code,”MSR ’09: Proc. 6th Int. Working Conf. on Mining Software Repositories, pp. 151–154, 2009. [11] D. E. Perry, A. A. Porter, and L. G. Votta, “Empirical
studies of software engineering: a roadmap,” in ICSE ’00: Proceedings of the Conference on The Future of Software Engineering. New York, NY, USA: ACM, 2000, pp. 345–355.
[12] P. W. Oman, J. Hagemeister, and D. Ash, “A definition and taxonomy for software maintainability,” Moscow, ID, USA, Tech. Rep. #91-08-TR, 1991.
[13] T. Kuipers and J. Visser, “Maintainability index revis-ited – position paper,” in Special Session on System Quality and Maintainability (SQM 2007) of the 11th European Conference on Software Maintenance and Reengineering (CSMR 2007), 2007, p. http://www.cs. vu.nl/csmr2007/workshops/SQM07 paper3.pdf. [14] P. Oman and J. Hagemeister, “Construction and testing
of polynomials predicting software maintainability,”J. Syst. Softw., vol. 24, no. 3, pp. 251–266, 1994. [15] Air Force Operational Test & Evaluation Center
(AFOTEC), “Software maintainability – evaluation guide,” 1989, AFOTEC Pamphlet 800-2, vol. 3, HQ AFOTEC, Kirtland Air Force Base, New Mexico, U.S.A.
[16] D. M. Coleman, D. Ash, B. Lowther, and P. W. Oman, “Using metrics to evaluate software system maintain-ability,” IEEE Computer, vol. 27, no. 8, pp. 44–49, 1994.
[17] D. Coleman, B. Lowther, and P. Oman, “The appli-cation of software maintainability models in industrial software systems,” J. Syst. Softw., vol. 29, no. 1, pp. 3–16, 1995.
[18] K. D. Welker, P. W. Oman, and G. G. Atkinson, “Development and application of an automated source code maintainability index,”Journal of Software Main-tenance, vol. 9, no. 3, pp. 127–159, 1997.
[19] J. Ratzinger, M. Pinzger, and H. Gall, “EQ-Mine: Predicting short-term defects for software evolution,”
Lecture Notes in Compure Science, vol. 4422, p. 12, 2007.
[20] T. Graves, A. Karr, J. Marron, and H. Siy, “Predicting fault incidence using software change history,” IEEE Transactions on Software Engineering, vol. 26, no. 7, pp. 653–661, 2000.
[21] J. ´Sliwerski, T. Zimmermann, and A. Zeller, “When do changes induce fixes?” MSR ’05: Proc. 2005 Int. Workshop on Mining Software Repositories, pp. 1–5, 2005.
[22] S. Kim, T. Zimmermann, K. Pan, and E. J. White-head Jr, “Automatic identification of bug-introducing changes,” ASE ’06: Proc. 21st IEEE/ACM Int. Conf. on Automated Software Engineering, pp. 81–90, 2006. [23] L. Aversano, L. Cerulo, and C. D. Grosso, “Learning from bug-introducing changes to prevent fault prone code,”IWPSE ’07: Proc. 9th Int. Workshop on Princi-ples of Software Evolution, pp. 19–26, 2007.
[24] T. Gyimothy, R. Ferenc, and I. Siket, “Empirical valida-tion of object-oriented metrics on open source software for fault prediction,” IEEE Transactions on Software Engineering, vol. 31, no. 10, pp. 897–910, 2005. [25] S. Chidamber and C. Kemerer, “A metrics suite for
object oriented design,”IEEE Transactions on Software Engineering, vol. 20, no. 6, pp. 476–493, 1994. [26] C. Bird, A. Bachmann, E. Aune, and J. Duffy, “Fair
and balanced?: bias in bug-fix datasets,” ESEC/FSE ’09: Proc. 7th joint meeting of the European Software Engineering Conference and the ACM SIGSOFT sym-posium on the Foundations of Software Engineering, pp. 121–130, Jan 2009.
[27] L. Briand, J. W¨ust, J. Daly, and D. V. Porter, “Ex-ploring the relationships between design measures and software quality in object-oriented systems,” Journal of Systems & Software, vol. 51, no. 3, pp. 245–273, 2000.
[28] T. McCabe, “A complexity measure,” IEEE Transac-tions on Software Engineering, vol. 2, no. 4, pp. 308– 320, Jan 1976.
[29] S. Benlarbi, K. E. Emam, N. Goel, and S. Rai, “Thresh-olds for object-oriented measures,” ISSRE ’00: Proc. 11th Int. Symposium on Software Reliability Engineer-ing, p. 24, 2000.
[30] J. Xu, D. Ho, and L. Capretz, “An empirical validation of object-oriented design metrics for fault prediction,”
Journal of Computer Science, vol. 4, no. 7, pp. 571– 577, 2008.
[31] T. Zimmermann, N. Nagappan, H. Gall, and E. Giger, “Cross-project defect prediction: a large scale experi-ment on data vs. domain vs. process,”ESEC/FSE ’09: Proc. 7th joint meeting of the European Software Engi-neering Conference and the ACM SIGSOFT symposium on the Foundations of Software Engineering, pp. 91– 100, Jan 2009.
[32] M. Fischer, M. Pinzger, and H. Gall, “Populating a release history database from version control and
bug tracking systems,” ICSM ’03: Proc. Int. Conf. on Software Maintenance 2003, pp. 23–32, 2003. [33] K. Ayari, P. Meshkinfam, G. Antoniol, and M. D.
Penta, “Threats on building models from CVS and bugzilla repositories: the mozilla case study,”CASCON ’07: Proc. 2007 Conf. of the Center for Advanced Studies on Collaborative Research, pp. 215–228, 2007. [34] M. Riaz, E. Mendes, and E. Tempero, “A system-atic review of software maintainability prediction and metrics,” in ESEM ’09: Proceedings of the 2009 3rd International Symposium on Empirical Software Engi-neering and Measurement. Washington, DC, USA: IEEE Computer Society, 2009, pp. 367–377.
[35] Y. Zhou and H. Leung, “Predicting object-oriented software maintainability using multivariate adaptive regression splines,”J. Syst. Softw., vol. 80, no. 8, pp. 1349–1361, 2007.
[36] S. C. Misra, “Modeling design/coding factors that drive maintainability of software systems,”Software Quality Control, vol. 13, no. 3, pp. 297–320, 2005.
[37] C. van Koten and A. R. Gray, “An application of bayesian network for predicting object-oriented soft-ware maintainability,” Information & Software Tech-nology, vol. 48, no. 1, pp. 59–67, 2006.
[38] E. H. Ferneley, “Design metrics as an aid to software maintenance: an empirical study,”Journal of Software Maintenance, vol. 11, no. 1, pp. 55–72, 1999. [39] K. Shibata, K. Rinsaka, T. Dohi, and H. Okamura,
“Quantifying software maintainability based on a fault-detection/correction model,” in PRDC ’07: Proceed-ings of the 13th Pacific Rim International Symposium on Dependable Computing. Washington, DC, USA: IEEE Computer Society, 2007, pp. 35–42.