Andrzej Kawalec
e-mail: [email protected]Jerzy Wiktor
Rzeszów University of Technology, Department of Mechanical and Aerospace Engineering, ul. W. Pola 2, Rzeszów, PL-35-959, Poland
Dariusz Ceglarek
Department of Industrial and Systems Engineering, The University of Wisconsin-Madison, Madison, WI e-mail: [email protected]Comparative Analysis
of Tooth-Root Strength Using ISO
and AGMA Standards in Spur and
Helical Gears With FEM-based
Verification
Current trends in engineering globalization require researchers to revisit various normal-ized standards that determine “best practices” in industries. This paper presents com-parative analysis of tooth-root strength evaluation methods used within ISO and AGMA standards and verifying them with developed models and simulations using the finite element method (FEM). The presented analysis is conducted for (1) wide range of spur and helical gears manufactured using racks or gear tools; and for (2) various combina-tions of key geometrical (gear design), manufacturing (racks and gear tools), and per-formance (load location) parameters. FEM of tooth-root strength is performed for each modeled gear. FEM results are compared with stresses calculated based on the ISO and AGMA standards. The comparative analysis for various combinations of design, manu-facturing, and performance parameters are illustrated graphically and discussed briefly. The results will allow for a better understanding of existing limitations in the current standards applied in engineering practice as well as provide a basis for future improve-ments and/or unifications of gear standards. 关DOI: 10.1115/1.2214735兴
Keywords: gear design and manufacturing, gear strength, finite element analysis
1 Introduction
1.1 Motivation. Gears are essential to the global economy and are used in nearly all applications where power transfer is required, such as automobiles, industrial equipment, airplanes, he-licopters, and marine vessels. Frequency of product model change and the vast amounts of time and cost required to make a change-over, also called time-based competition, has become a character-istic feature of modern global manufacturing and new product development in automotive, aerospace, and other industries 关1兴. This forces gear manufacturers to respond with improved gear systems that are designed and manufactured faster than before. Simultaneously, current trends in engineering globalization re-quire research to revisit various normalized standards to determine their common fundamentals and those approaches needed to iden-tify “best practices” in industries. This can lead to various benefits including reduction in redundancies, cost containment related to adjustments between manufacturers for missing part interchange-ability, and performance due to incompatibility of different stan-dards. Given the range of differences that exist in engineering practices today, frequently manufacturers must seek certificates of their products in Asia, Europe, and/or/ in the USA. This coincides with the recently developed “Gear Industry Vision in 2025” stra-tegic goals. The report recommends as one of the five strastra-tegic goals to establish common standards with special emphasis on:共i兲 one global system of design and testing standards by 2015; and 共ii兲standardized quality and verification procedures关2兴.
Gear transmissions are widely used in various industries and their efficiency and reliability are critical in the final product per-formance evaluation. Gear transmissions affect energy
consump-tion during usage, vibraconsump-tions, noise, and warranty costs among others factors关3–6兴. These factors are critical in modern competi-tive manufacturing, especially in the aviation industry which de-mands exceptional operational requirements concerning high reli-ability and strength, low weight and energy consumption, low vibrations and noise. Considering their reliability and efficiency are some of the most important factors, problems of distribution of loads and, consequently, distribution of stresses in the whole gear transmission, particularly in teeth of mating gears, need to be thoroughly analyzed.
Gears have been manufactured for a number of years with ex-tensive ongoing research related to their efficiency, operational quality, and durability. They are relatively complex and there are a number of design parameters involved in gear design. The design of gears requires an iterative approach to optimize design param-eters, which govern both the kinematic as well as strength perfor-mance. Due to the complex combinations of these parameters, conventional design office practice tends to become complicated and time consuming. It involves selection of appropriate informa-tion from a large amount of engineering/standards data available in engineering catalogues and design handbooks. While the knowledge in gearing design is vast, however, there is an acute paucity of research on comparative analysis between various dards and engineering practices. Currently, the most popular stan-dards are ISO and AGMA. These stanstan-dards vary in selected ap-proaches as well as models and methods resulting in different design solutions obtained for the same gear under the same set of working conditions. Yet, the field lacks systematic comparative analysis of both standards supported and justified by the detailed finite element method共FEM兲analysis.
In the ISO standard the finite element method is treated as the most accurate method of gear strength determination共method A兲 and can be used for verification purposes of the results obtained with other methods. This paper attempts to provide a systematic Contributed by the Power Transmission and Gearing Committee of ASME for
publication in the JOURNAL OFMECHANICALDESIGN. Manuscript received July 21, 2004; final manuscript received November 18, 2005. Review conducted by Prof. David Dooner.
comparative analysis between the ISO and AGMA standards, fo-cused on tooth-root strength, based on the precise FEM modeling of spur and helical gears.
1.2 Literature Review. When the loads occurring in gear transmission cross certain thresholds, very often a fatigue break-age of gear tooth takes place due to repeated high stress exceeding allowable stress limits usually due to improper structure of gear transmission, inappropriate tooth contact, stress concentration around a notch, material defects, and other factors. Tooth break-age results in destroying gear transmission and breaking links be-tween driving and driven shafts. The fracture usually starts at the stretched tooth fillet. Therefore, stress state at tooth root is a rep-resentative factor to estimate tooth-root strength of gearings for both involute cylindrical gears with symmetric profiles and for involute spur gears with asymmetric profiles关7兴in static and dy-namic conditions关8,9兴.
Accurate evaluation of the stress state and distribution of stresses at tooth root is a complex task. The precise determination of stress distribution requires application of experimental methods using electric resistance wire strain gauges关9,10兴or photo-elastic gauges 关10,11兴, digital photoelastic system involving real time imaging关8兴, as well as numerical methods关4,10,12–15兴, applying FEM-based simulations 关16–18兴, bipotential equations, and/or
utilizing Airy function 关11兴, finite prism method 关19兴, or the theory of Muskhelishvili applied to circular elastic rings关20兴.
Significant development in analysis of strength properties of gear transmissions follows the achievements in computational de-sign, simulation of meshing, and tooth contact analysis made by Litvin et al.关21,22兴, Lewicki et al.关23兴, and Handschuh and Bibel 关24兴. In particular, Litvin et al.关21兴 developed an analytical ap-proach for simulation and meshing as well as contact of a face-gear drive with a spur involute pinion, followed by numerical stress analysis of the model of five contacting teeth. In the paper Litvin et al.关22兴investigated the contact force and its distribution over contact ellipse, tooth deflection, and load share as well as maximum bending stress along the width of the gear in loaded gear drive. The results of the performed computations were simi-lar to the known experimental ones. Lewicki et al.关23兴studied the effect of moving gear load on crack propagation predictions. They performed two-dimensional共2D兲analysis using finite element and boundary element methods. Comparison of computed results to experimental ones validated crack simulation based on calculated stress intensity factors and mixed mode crack angle prediction techniques in a model of tooth loaded at the highest point of single tooth contact. Handschuh and Bibel 关24兴 investigated an aerospace-quality spiral bevel gear set numerically and experi-mentally. The developed nonlinear finite element model allowed Fig. 1 The finite element model of a segment of a gear and two
load cases: prescribed force applied at the tip and prescribed force applied at the highest point of single tooth contact „HPSTC…
Fig. 2 The FEM model of a representative gear „z= 45, mn = 2.75 mm, ␣n= 20 deg, b= 32 mm…: segment of three-tooth made of 3D isoparametric 20-node brick finite elements; boundary conditions as in Fig. 1; load uniformly distributed along the line of contact at the HPSTC
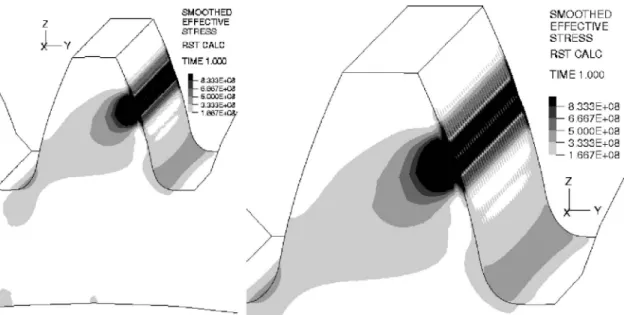
Fig. 3 The FEM model of a representative gear „z= 45, mn = 2.75 mm,␣n= 20 deg,b= 32 mm…made of 3D 20-node isopara-metric and eight-node brick finite elements; all degrees of free-dom on the internal cylinder of gear disk fixed; load uniformly distributed along the line of contact at the HPSTC; model of the whole gear„left…; enlarged view of the loaded tooth„right…
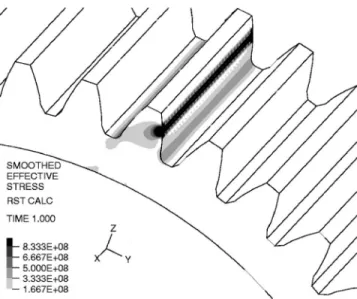
Fig. 4 Distribution of effective stress in the loaded part of the whole gear shown in Fig. 3
them to simulate three-dimensional共3D兲multitooth contact. The results were then compared to experimental ones, obtained with strain gauges. Barkah et al.关25兴applied finite element models for static stress evaluation of non-circular gears, focusing on the tooth fillet region. Computed results of stress distributions were in full agreement with existing analytical solutions. Sainsot and Velex 关20兴 developed a new bidimensional analytical model based on Muskhelishvili’s theory applied to elastic rings. The model ap-proximates stress distributions at the root circle and allows to calculate gear body-induced tooth deflections more precisely than the Weber’s equation, which is based on the semi-infinite plate approximation. Guingand et al. 关19兴 applied the finite prism method共FPM兲for quasi-static analysis of helical gears to build a model of cylindrical gears with reduced computational complexity as compared to conventional FEM models. The developed FPM models allow computing load and tooth-root stresses. Velex and Baud 关9兴 experimentally investigated quasi-static and dynamic tooth-root stresses in spur and helical gears and compared them with numerical predictions obtained by using FEM. They devel-oped a specific FE model which accounts for non-linear time-varying mesh stiffness, tooth geometrical errors, and
flexural-torsional-axial couplings. However, they did not consider the gear fabrication process, thus their simulations model does not allow to analyze the impact of the fillet shape on tooth-root stresses.
The development in analysis of gear strength shown in papers 关21–25兴validates the use of correctly defined finite element mod-els for analysis of not only spur or helical gears, but also other types of gears, like hypoid or spiral-bevel gears, etc. Experimental methods, though necessary for validation of theoretical and nu-merical analyses, are especially complicated, expensive, and labo-rious. Therefore, they are applied mainly in special cases. In prac-tice, simplified formulas are usually used in gear transmission design. They enable estimation of stresses at tooth root with ac-curacy acceptable for engineering design.
In every case, strength properties of gear transmissions are strongly influenced by gear geometry, applied manufacturing pro-cesses, and dimensional accuracy of manufactured gears 关4,12,13,18兴. For example, investigations described in Liu and Pines’ paper 关26兴 illustrate that some fundamental gear design parameters such as diametral pitch 共proportional to the normal module, used in Europe as the characteristic parameter in gear design兲, pressure angle, and number of teeth, may have a signifi-Fig. 5 Distribution of the effective stress in the loaded tooth of the gear shown in Fig. 3
Fig. 6 Comparison of effective stress distributions along tooth line and along fillet of the same gear computed with the use of different finite element models: „i…the whole spur gear built of 3D 20-node isoparametric and eight-node brick finite elements;„ii…segment of three teeth built of 3D 20-node isoparametric brick finite elements; and„iii…segment of three teeth built of eight-node plane stress finite elements; distance⌬describing location of transversal section of tooth is shown in Fig. 7 right
cant influence on damage detection sensitivity. In the aforemen-tioned investigations, the three main types of gear damage were considered: pitting and wear of tooth flanks, concentration of stress, and cracks at tooth root.
The final geometry of every gear depends on the assumed gear structural parameters and the applied manufacturing processes, applied tools, tool machines, etc.关3,12,13,18兴. Therefore, the es-tablished standards consider models of both gear structures and manufacturing techniques, and take into account certain structural factors, mostly geometric and operational, as well as information concerning applied manufacturing processes, applied tools, and materials. In particular, suitable international ISO关27兴standards developed over the years in Europe共or fully compatible German standard DIN关28兴兲, and American standard AGMA关29–37兴 de-scribe procedures for approximate calculations of stresses at tooth root of the involute gearings. In all these standards evaluation of tooth-root strength is performed based on maximum stress at tooth root on the stretched side of the tooth. Moreover, in all of these standards it is assumed that the maximum stress occurs in the critical section of the tooth. It is clear that proper evaluation of maximum bending stress at tooth root is one of the most critical parameters determining whether or not a particular gear transmis-sion will function properly. Tooth breakage due to operating stress that significantly exceeds the maximum allowable stress in gear transmission can be extremely dangerous in automotive, aero-space, or space industries 关3,4,38,39兴. Therefore, an accurate
estimation of critical strength parameters is of great importance in such cases.
The models considered in ISO and AGMA standards are similar from both theoretical and computational points of view, though they are not identical. They have been developed using state of the art industrial practice as well as theoretical and experimental re-search in this field. However, there are a number of discrepancies within the current standards. These discrepancies can be classified as:共1兲 each standard defines different geometrical parameters as critical for gear performance;共2兲 the calculations undertaken to estimate the thresholds for these critical parameters are based on different assumptions and on different mathematical relations fol-lowing them; and共3兲results of computations differ for each stan-dard under the same conditions.
Currently, there is a need to unify both standards关35兴. Initial studies, which intended to compare both standards, were done by Hösel关36,37兴. However, Hösel only considered the older versions of the standards, thus limiting his analysis to simple numerical comparison of both standards without any other verification of computed results.
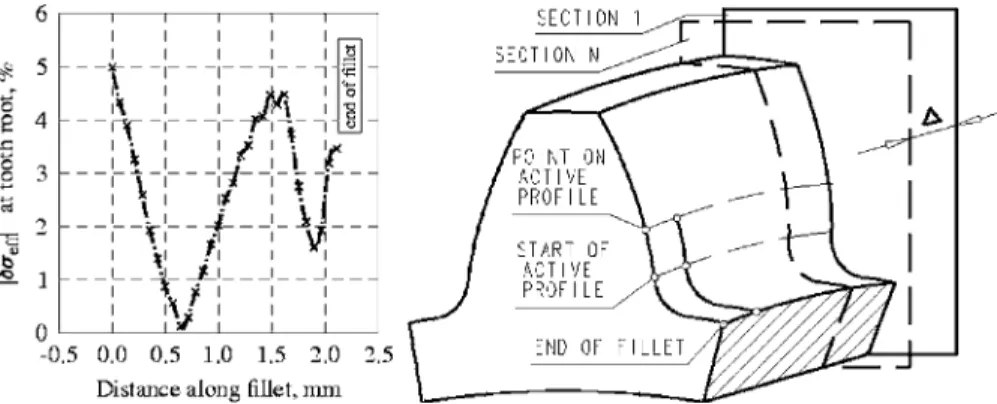
In this paper corresponding models of gears, computational methods used for their analysis, and results obtained according to the ISO and AGMA standards are briefly described and compared with each other. In the next step we verify these with the use of the developed FEM models and simulations. This approach allows Fig. 7 Absolute values of obtained differences in the effective stresses along fillet␦eff
computed according to Eq.„1…for the 2D plane stress model with three teeth and for the model of the whole gear built of 3D 20-node isoparametric and eight-node brick finite elements in sections associated with⌬= 2 mm„left…; explanation of the sections and the lines where the effective stresses are compared„right…
Fig. 8 Comparative analysis of the effective stress distribution at tooth root for three magnitudes of rim thickness of gear„left…; absolute values of the relative differences in the effective stresses along fillet⌬eff„*1 ,*i
… computed according to Eq.„2…for the model of three-teeth segment of gear built of 3D 20-node isoparametric, for load applied at the HPSTCFbn/b= 500 N / mm„right…
for better understanding of existing limitations in the current stan-dards as applied in engineering practice and will provide a basis for future improvements of the standards.
1.3 Approach.In both the ISO and AGMA standards, stresses at tooth root are calculated for load applied at the highest point of single tooth contact, i.e., at the HPSTC共in the case of spur gear-ings兲 or at the tooth tip 共in the case of helical gearings兲. In the case of helical gears, calculations are performed for the virtual gear with straight teeth and virtual number of teeth denotedzn.
The analysis is conducted in three steps to calculate:共i兲 transmit-ted load;共ii兲nominal tooth-root stressFO; and,共iii兲local stress at the tooth root, i.e., to the tooth-root stressF.
Transmitted loadin the plane of action, which is normal to the tooth flank, is converted to the nominal tangential load at the reference diameterFt共according to the ISO standard兲 or to the
transmitted tangential load at the operating pitch diameter Fwt 共according to the AGMA standard兲. For a given load, thenominal
tooth-root stressFOis calculated with consideration to the tooth fillet shape and stress concentration caused by the notch. Then, the nominal tooth-root stress is converted using load factors to the
local stress at the tooth root, i.e., to the tooth-root stressF. The
load factors take into account increase of stresses caused by mis-alignments in manufacturing of gear transmission, external and internal dynamic loads acting on gear transmission, as well as non-uniform distribution of load.
The FEM simulation models of tooth-root strength use a method for computations of tooth profiles as presented in Ref. 关40兴. This method allows for accurate computation of real tooth profile, including fillet for both tools rack or gear tool. Addition-ally, the results are automatically interpreted by the software de-scribed in Ref.关40兴. The development of the precise FEM model of gear tooth requires accurate determination of tooth profile with consideration of the selected machining process of gear fabrica-tion. Such methods are described in Refs.关40,41兴.
Table 1 Tooth load
ISO AGMA
Straight tooth gearings: Straight tooth gearings:
According to method B共accurate computational method兲 maximum stress at tooth root is calculated for the load applied at the HPSTC共for gear transmission with the transverse contact ratio 1⬍␣n艋2兲or at the highest point of double tooth contact共for 2⬍␣n艋3兲.
Maximum stress at tooth root is calculated for transmitted load applied at the HPSTC共the standard allows calculation of stresses for the load applied at the tooth tip兲 关29兴.
According to method C共simplified computational method兲maximum stress at the tooth root is calculated for the load applied at the tooth tip. Then, with the use of the coefficientYit is converted to the stress generated with the load applied at the HPSTC关27兴.
Helical gearings: Helical gearings:
Maximum stress at tooth root is calculated for the virtual gearings with straight tooth共with virtual number of teeth zn兲and for load applied at the tip.
Maximum stress at tooth root is calculated for the virtual gearings with straight tooth共with virtual number of teeth zn兲
and for the load applied at the tooth tip关29兴. Transmitted load in the plane of action normal to the
tooth flank is converted to the tangential load at the operating pitch diameter关27兴:
Transmitted load in the plane of action normal to the tooth flank is converted to the tangential load at the reference diameter关33兴
Ft=2000T1,2 d1,2
Fwt=2000T1,2 dw1,2
where:Ft- tangential load at the operating pitch diameter关N兴;T1,2- pinion torque共1兲, wheel torque共2兲
关Nm兴;d1,2- operating pitch diameter of pinion共1兲,
wheel共2兲 关mm兴.
where:Ftw- tangential load at the reference diameter 关N兴;T1,2- pinion torque共1兲, wheel torque共2兲 关Nm兴;d1,2
- reference diameter of pinion共1兲, wheel共2兲 关mm兴. Next, unit tooth load is calculated: Next, unit tooth load is calculated关33兴:
Ft bmn
Fwt bmn
where:b- facewidth关mm兴;mn- normal module关mm兴. where:b- facewidth关mm兴;mn- normal module关mm兴.
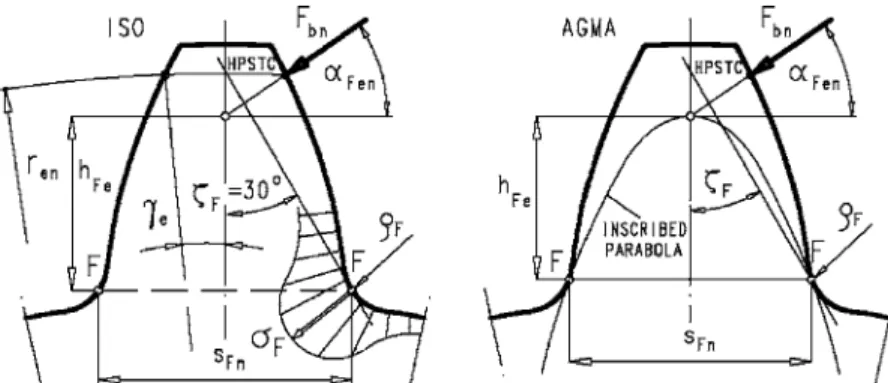
Fig. 9 Determination of the critical section location, angleFand parameters of the critical sectionsFn, hFe, and F; according to the ISO and the AGMA standards„for comparison see Table 7 in the Appendix…
It should be noted that the ISO and AGMA standards do not provide procedures for calculation of the whole tooth profile. The standards describe ways to calculate the main parameters of the basic rack profile. In addition, the formulas given in each of the standards do not cover all range of gear manufacturing tools used in industrial practice.
For the sake of comparative analysis the following conditions and assumptions are made:
共1兲 Loads applied in the FEM, ISO, and AGMA standards are the same.
共2兲 There are no misalignments in gear transmission, and loads are static and uniformly distributed.
共3兲 Location of the critical tooth section and maximum tooth-root stresses were calculated following the procedures of the ISO关27兴and AGMA关29–35兴standards. Both standards provide formulas for calculation of tooth-root stress at the critical section while the conducted FEM simulations allow obtaining the whole distributions of stresses in the modeled gears. From those distributions of stresses the maximum tooth-root stresses with their locations were found by scan-ning the FEM results.
共4兲 The notation follows both ISO关27兴and AGMA standards 关29–35兴. Regarding the analysis and computations focused on the ISO procedures, the whole notation is based on the
ISO standard关27兴. Concerning analysis and computations focused on the ISO procedures in cases where the presented notation is the same for both standards, only the ISO nota-tion is used in order to emphasize similarities between the standards. Other parameters used in formulas are denoted according to the ANSI/AGMA 2101-C95关33兴and AGMA 908-B89 关29兴 standards. The nomenclature list for both standards is presented in Table 7 in the Appendix. The details of the related approaches, computational models, methods of calculations, and results are presented in the tables and figures included in the following sections. The outline of the paper is as follows. Section 2 presents the FEM-based approach used for calculation and analysis of gear strength at tooth root. Section 3 describes the loads, critical section definition, and parameters, co-efficients, and load factors used in computations as well as recal-culations of nominal tooth-root stresses to local tooth root stress. In Sec. 4, tooth-root stress analysis following the ISO, AGMA, and FEM procedures is presented. Finally, the results are summa-rized and conclusions are drawn in Sec. 5.
2 FEM Modeling
Spur and helical gear models were analyzed based on formulas given in the ISO and AGMA standards as well as based on the Table 2 Methods of determination of the critical section
ISO AGMA
Based on calculations and analysis of experimental results it is assumed that the critical section is determined by the points of tangency of the fillet with the straight lines inclined at 30 deg to the tooth center line共Fig. 9, left兲
Location of the critical section is determined on the basis of the modified Lewis method共Fig. 9, right兲. The tooth is considered as a beam fixed at its root and loaded with the transmitted load. The critical section is determined by the tangency points of a parabola inscribed into the tooth profile. This parabola represents profile of the beam with uniform strength along its axis. Therefore, the angleFbetween tooth center line and
tangent to fillet at the critical pointFis constant and independent from shape of the fillet and from location of applied load:
F= 30 deg
The angleFbetween tooth center line and tangent to fillet at the critical pointFis not constant - its value depends on profile of the fillet and on location of the point where load is applied. In the examples considered in this paper the load is applied at the tip and the angle
Fwhich varies共depending on parameters of the gear and machining tool兲within the range:
F= 13– 16 deg
For load applied at the HPSTC the angleFvaries within the range:
F= 24– 30 deg
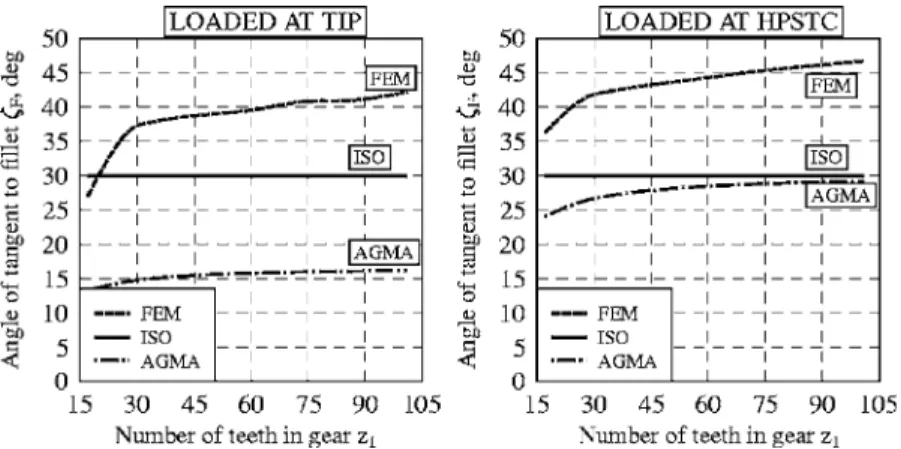
Fig. 10 Influence of the number of gear teeth on the angleFbetween tooth centerline and tangent to fillet at the critical pointFaccording to the ISO stan-dard, AGMA stanstan-dard, and FEM: load applied at the tip„left…, load applied at the HPSTC„right…; main parameters of the gear:mn= 2.75,␣n= 20 deg,s1= 4.265, 1= 0 deg, main parameters of the rack:␣0= 20 deg,s0= 4.320,hfP= 1.22mn,fP = 0.18mn
conducted FEM modeling关16–18兴. FEM computations of stress distribution, as presented in this paper, require precise modeling of tooth, especially accurate representation of its fillet, which con-stitutes a typical geometric notch. Therefore, a specialized mesh generating program integrated with the ADINA关42兴finite element system was developed. The developed program allows for para-metric and automatic generation of well shaped finite element meshes for two-dimensional 共2D兲 and three-dimensional 共3D兲 problems with consideration to proper node numbering and re-quired tooth fillet profile 关40兴. A precise representation of the whole tooth profiles in their various sections was based on cubic Hermite splines and on the least squares approximations关43,44兴. The three-dimensional geometric models of tooth profiles were transformed to the ADINA system关42兴for further finite element analyses.
Considering the geometric symmetry of the gear only certain gear segments were defined and used for FEM computations. They represented plane stress models made of the eight-node iso-parametric plane stress finite elements for spur gears and 3D mod-els made of isoparametric 20-node and eight-node brick finite el-ements for spur and helical gears. All nodes at the internal circle of gear rim in models considered in this work had all degrees of freedom共DOE兲fixed. In addition, the nodes at both radial bound-ary sections had all DOF fixed, except the ones which are related to radial movements. All nodes at both radial boundary conditions
were defined in their local coordinate systems共Fig. 1兲. According to the ISO and AGMA standards the models were loaded at tooth tip or at the highest point of single tooth contact with correspond-ing prescribed load共Fig. 1兲. Considering load distribution along the path of contact associated with共i兲contact of a single pair of mating teeth, or共ii兲simultaneous contact of two pairs of mating teeth, the load applied at tooth tip was half of the load applied at the HPSTC.
The selected plane stress model共Fig. 1兲is the most suitable for strength analysis of spur gears presented in this paper. The selec-tion of the plane stress model for strength analysis of spur gears is based on fulfilment of necessary conditions for replacement of 3D strength analysis with plane stress strength analysis of structures 关45兴 like spur gears共much longer face width than whole depth, same shape in each transversal section, uniform load distribution along tooth line兲as well as on conducting a large number of two-and three-dimensional finite element gears simulations. The mesh is chosen to satisfy: 共i兲 accuracy requirements for modeling of tooth shape; and 共ii兲 to properly represent necessary boundary conditions, which are located far from the fillets of loaded tooth and region of load application. Following recommendations of Kawalec and Wiktor关44兴, the optimum mesh density was gener-ated and selected using the criterion of change in the maximum effective stress, i.e., the mesh density in the volume of tooth root is increased until the changes in the maximum effective stress at tooth rooteff,maxare less than 0.4%. In order to compare results of plane stress models with three-dimensional ones several 3D FEM models were developed and analyzed:共1兲 models built of eight-node 2D isoparametric plane stress elements; 共2兲 models built of 20-node 3D isoparametric brick elements; and共3兲models built of 20-node isoparametric and eight-node brick 3D finite el-ements 共FEs兲. Two of the models are shown in Figs. 2 and 3. Figures 2 and 3 also show the key parameters of gears used in this paper.
The simulations conducted in the paper for 3D models use load, which is uniformly distributed along tooth line and corresponds to the point load applied in plane stress models. The application of load uniformly distributed along tooth line as well as point load is justified, according to the Saint-Venant’s principle关45兴. That prin-ciple states that self-equilibrated systems of tractions result in stresses that decay rapidly with distance from the region where tractions are applied. In other words, in the cases of simulations of bending stresses at tooth root which are considered in this paper, the tooth root is located far from the area of load application, and thus, the overall load forces can be replaced with the equivalent static forces having the same total moments and the same resultant Fig. 11 Influence of the number of teethz0of the gear tool on the angleF
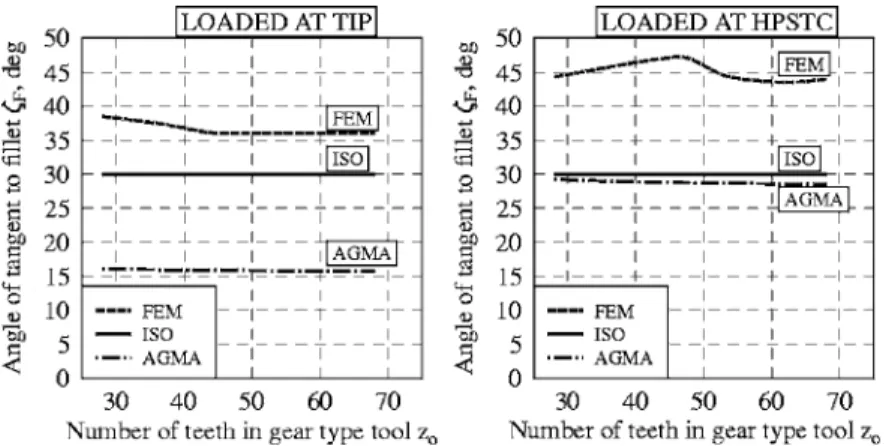
between tooth centerline and tangent to fillet at the critical pointF accord-ing to the ISO standard, AGMA standard, and FEM: load applied at the tip „left…, load applied at the HPSTC„right…; main parameters of the gear:mn = 2.75,z1= 45,␣n= 20 deg,s1= 4.265,1= 0 deg, main parameters of the gear tool:␣0= 20 deg,s0= 4.320,hfP= 1.22mn,fP= 0.18mn
Fig. 12 Influence of the normal module mn on the angle F between tooth centerline and tangent to fillet at the critical pointFaccording to the ISO standard, AGMA standard for load applied at the tip„Tip…, and at the HPSTC; main parameters of the gear:z1= 45,␣n= 20 deg,1= 0 deg; main parameters of the rack:␣0= 20 deg,hfP= 1.25mn,fP= 0.5
forces. The results of FEM stress simulations are shown in Figs. 4–6 and 8. From analysis of tooth stress distribution, the follow-ing conclusions can be drawn 共see also Figs. 4 and 5兲: large stresses in the area of load application and at the fillet are sepa-rated from each other by the area of very low stresses. Therefore, considering obtained distributions of stresses and the Saint-Venant’s principle applied to bending of tooth caused by load transmitted between teeth in mesh, the propagation of errors from point or distributed loadings of tooth to the area/volume at the fillet can be neglected.
Figure 6 contains comparison of distributions of von Mises ef-fective stress along fillet of the same gear computed with the use of different finite element models:共1兲the whole gear built of 3D 20-node isoparametric and eight-node brick finite elements; 共2兲 segment of three teeth built of 3D 20-node isoparametric brick finite elements; and共3兲segment of three teeth built of eight-node plane stress finite elements.
Relative differences in distributions of the effective stresses along fillet␦efffor the 2D plane stress model with three teeth eff,共2D兲and for the model of the whole gear built of 3D 20-node
isoparametric and eight-node brick finite elements eff,共3D兲 were
computed according to the formula:
␦eff=
eff,共2D兲−eff,共3D兲
eff,共2D兲
100 共1兲
Absolute values of the computed differences␦effare shown in
Fig. 7. From the performed analysis it follows that the maximum difference in tooth-root stresses between the 2D model 共Fig. 1兲 and the 3D model of the whole gear共Fig. 3兲are less than 5%.
Strength computations of gears require analysis of the rim thickness关46,47兴. Therefore, in order to investigate the influence of rim thicknesssRon the maximum tooth-root strength, various 3D models of three teeth segments of gear with different magni-tudes of rim thicknesssRmade of the 20-node isoparametric finite elements were computed. Relative differences in distributions of the effective stresses along fillet⌬eff共*1 ,*i兲 for the 3D models
of three-tooth segments of gear with various magnitudes of rim thicknessi*s
Rwere computed according to the formula:
⌬eff共*1,*i兲=
兩eff,max共*1兲−eff,max共*i兲兩
eff,max共*1兲
100 共2兲 wherei苸兵0.5, 0.6, 0.75, 2.0, 4.0其, andeff,max共*1兲,eff,max共*i兲 de-note the maximum tooth-root stress computed in the model with Table 3 Parameters of the critical section
ISO AGMA
The ISO standard describes how to calculate the parameters of the critical section for gearings generated with rack. In the case of gearings generated with gear tool共e.g., with gear-shaper cutter兲the real tool is in the a.n. procedure of calculations replaced with a virtual one—a rack with the same reference tooth profile. It significantly simplifies calculations, but can lead to erroneous results. The tooth profile generated with the gear tool differs from the one generated with the rack. Therefore, parameters calculated for the virtual rack can significantly differ from the real ones. This may lead to errors in estimation of tooth-root strength, due to wrong results of stress calculations.
The AGMA standard contains procedure of calculation of the parameters of the critical section for gearings generated with gear tool. In the case of gearings generated with rake the calculations are performed the same way, but the rack is represented by the gear tool witha very large number of teeth, i.e.z0= 10,000. The
parameter of the critical section calculated in such a way are comparable with the real ones. The differences can be omitted as far tooth-root strength of gears generated with racks is concerned.
Formulas determining parameters of the critical section are derived from the geometric relations given in Fig. 13 共up兲which shows both machined gear and generating rack in a position in which the rack generates pointF belonging to the fillet共the point which determines location of the critical section兲.
Formulas determining parameters of the critical section are derived from the geometric relations given in Fig. 13 共bottom兲which shows both machined gear and generating gear tool in a position in which the tool generates pointFbelonging to the fillet共the point which determines location of the critical section兲.
Tooth-root chord at the critical sectionsFn: Coordinates of the critical pointF关29兴: sFn mn =znsin
共
3−兲
+冑
3共
G cos− f P mn兲
nF=rwn1sinn1+KFcosF nF=rwn1cosn1+KFsinF Radius of fillet at the critical sectionF: Tooth-root chord at the critical sectionsFn:sFn= 2nF F mn =f P mn + 2G 2 cos共zncos2− 2G兲
Radius of fillet at the sectionF: Bending moment arm application at the tiphFe:
F=f P+ KS2 rwn1rwn0cos rwn1+rwn0 −KS hFe mn =1
2
关
共cos␥e− sin␥etg␣Fen兲 den mn兴
−1 2关
zncos共
3−兲
+ G cos− f P mn兴
Bending moment arm application at the tiphFe
hFe= rbn1 cos␣Fen
−nF Analysis of the geometric relations shown in Figs. 9 and
13 leads to the following equation from which an auxiliary anglecan be calculated in an iterative procedure:
where:
KS=rwn0cos−rRn0cos共Rn0−兲
basic rim thickness sR= 2.0*mn, the maximum tooth-root stress
computed in the model with rim thickness of magnitudei*s
R,
re-spectively. The basic finite element model used for all further FEM strength computations, i.e., the model with rim thickness defined asi*sR= 1.0*sR= 2.0*mn, is shown in Fig. 2, and the
cor-responding 2D plane stress finite element model is shown in Fig. 1.
Absolute values of the computed differences ⌬eff共*1 ,*i兲 are
shown in Fig. 8. From the simulations results it follows that the maximum difference in the maximum tooth-root stresses between the investigated models fori艌0.75, which is equivalent with con-dition sR艌1.5*m
n, is less than 2% 共Fig. 8兲. That difference
reaches appox. 20% at the end of fillet fori= 4.0*s
R. The
differ-ence of 20% occurs in that case, however, in the areas where the effective stresses are more than three times smaller than the maxi-mum effective tooth-root stress. As far as the maximaxi-mum tooth-root stresses at the critical section are concerned, the absolute values of the computed differences ⌬eff共*1 ,*i兲 for i= 0.6*sR and i
= 0.5*s
R reach approx. 8% and 16%, respectively共Fig. 8兲. From
the conducted analysis it follows, that the rim effect takes place for i⬍0.75. Therefore, influence of rim thickness in developed FEM models used for further computations, i.e., models with i
= 1.0, on the maximum tooth-root stress is negligible.
Distributions and magnitudes of effective stress at tooth root in 2D and 3D isoparametric models are almost the same共Figs. 6 and 7兲. In all models the critical sections were located very close to each other共abscissas of local maxima in Fig. 6兲. The models built of 3D 20-node isoparametric and eight-node brick finite elements are a more realistic representation of real gears than the 2D finite element models. However, the effective stresses at tooth root com-puted for the 2D plane stress model differ not more than 5% from the effective tooth-root stresses computed for the 3D models of the whole gear. Moreover, increasing two times and four times the basic thickness of gear rim changes the maximum tooth-root stresses less than 2%.
In all 2D and 3D finite element models generally isoparametric quadrilateral or brick finite elements with very regular rule-based mesh were used. They give more flexibility in precise modeling of the gear shape, at least in the case of rule-based meshes, which is very important in precise modeling of tooth flank and fillet. They also give more flexibility in modeling of strength properties, be-cause they use higher order shape functions than simple tetrahe-dral elements关16,17兴. The triangle and tetrahedral elements were omitted, as their linear shape functions are too primitive to cor-rectly model curvilinear geometry and stresses as compared to the quadrilateral and brick elements, respectively.
From the comparison of results obtained for the various finite element models of gears it follows that application of the precise 2D plane stress finite element models for the analysis of tooth root strength, especially its maximum magnitudes and location of criti-cal section in spur gears is justified. Analysis of tooth root stress of helical gears requires 3D models. However, as it follows from results obtained for the 3D finite element models of the whole gear and three-tooth segment共Figs. 6 and 7兲, simulations of the three-tooth segment are sufficiently accurate for computations of the local tooth-root stresses at the root of loaded tooth. The de-tailed results of the 3D finite element simulations of helical gears are given in Sec. 4.
Generally, it is important to mention that both analyzed stan-dards, i.e., ISO and AGMA, clearly indicate the finite element method as one of the most precise methods for computations of tooth strength. Therefore, considering the approach given in the ISO and AGMA standards, and considering the obtained simula-tions results, it can be concluded that:共1兲the developed 2D finite element plane stress models represent tooth-root strength of spur gears with good accuracy, and, thus they will be used in this paper; and共2兲in the case of helical gears, the 3D models will be used.
3 Determination of Geometric and Strength Param-eters and Factors
3.1 Loads.In both standards tooth-root stresses are calculated for the unit nominal load. The load in the plane of action normal to the tooth flank is converted to the nominal tangential load at the reference diameterFt共ISO standard兲or to the transmitted
tangen-tial load at the operating pitch diameterFwt共AGMA standard兲—
Table 1.
3.2 Critical Section. In both standards it is assumed that maximum stress at tooth root occurs at the critical section, which Fig. 13 Determination of parameters of the critical section:
sFn, hFe, andF, according to the ISO standard „top…and ac-cording to the AGMA standard„bottom…
is determined in two different ways specific for each standard 共Fig. 9 and Table 2兲.
The magnitudes of the angleFbased on the ISO and AGMA
standards, and calculated for different parameter values of the manufactured gears and generating tools as well as for different load cases, are shown in Figs. 10–12.
The anglesF calculated on the basis of the ISO and AGMA
standards are compared with the angles representing location of the critical section determined with the use of the finite element method关16,17兴in ADINA关42兴. For this purpose tooth forms were precisely modeled with fine mesh consisting of eight-node plane stress isoparametric finite elements. Suitable automatic analysis of the results, focused on searching for location of the maximum stresses at tooth root, allowed determination of magnitudes of the angleF共i.e., slope of the line tangent to the fillet at the point of
the computed maximum stress兲 for a wide range of considered spur gears models.
Figure 10 presents results of computations performed for gear-ings with different number of teethz1 generated with the same rack. According to the AGMA standard the angleFgrows with
increasing number of gear teethz1共Fig. 10兲. In the case when the number of teeth of generated gearz1varies in the range具17, 101典 and load is applied at the HPSTC the angle F increases from
F= 24 deg toF= 29.2 deg. When the same load is applied at the
tooth tip the angle F increases from F= 13.2 deg to F
= 16.2 deg. Also in these cases, according to the ISO standard, the angle F is constant and equals 30 deg independently from the number of gear teeth.
Figure 11 contains results of computations of the angleFmade
for gears generated with gear tools with different number of teeth
z0. Similarly to the case of racks, according to the ISO standard
the angleFis constant and equals 30 deg independently from the number of teeth of the tool and from the location of applied load.
According to the AGMA standard, this angle decreases slightly with the growing numberz0and in the case of load applied at the HPSTC it equals approximately 29 deg which is very close to the value assumed in the ISO standard. On the other hand, in the case of load applied at the tip, the angleFis almost twice less and equals approximately 16 deg. Results obtained with the use of the finite element method significantly differ from the ones calculated with consideration of both ISO and AGMA standards共see Table 3兲. In the cases of load applied at the HPSTC the anglesFvaried in the range 具44.25 deg, 47.25 deg典 and in the cases of load ap-plied at the tip the angles F varied in the range
具36.0 deg, 38.8 deg典. Different magnitudes of the angle F
be-tween tooth center line and tangent to fillet at the critical pointF
calculated in accordance with the ISO and AGMA standards for different values of the normal modulemnare shown in Fig. 12.
3.3 Parameters of the Critical Section.The following pa-rameters of the critical section共Figs. 9 and 13兲are necessary in order to calculate stress at tooth root: tooth-root chord at the criti-cal sectionsFn; tooth-root fillet radius of the critical sectionFand bending moment arm application at the tooth tiphFe.
The differences between the ISO and AGMA standards in de-termination of location of the critical section causes that for the same parameters of gearings and generating tools the parameters of the critical section can significantly differ from each other. This further results in differences in calculated stresses. The selected parameters are calculated in accordance with the ISO and the AGMA standards and are compared in Figs. 14–17.
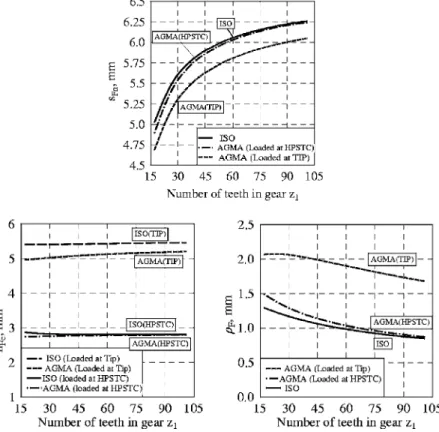
Figure 14 shows the parameters of the critical section for gear-ings with various number of teethz1generated with rack and Fig.
15 shows the parameters for gearings generated with gear tools with various number of teethz0. In all examples the parameters Fig. 14 Influence of the number of gear teethz1on parameters of the critical
section:sFn,hFe,Faccording to the ISO, AGMA for load applied at the tip„Tip…, and at the HPSTC; main parameters of the rack„generating tool…and gear are the same as in Fig. 10
were computed for load applied at the highest point of single tooth contact共HPSTC兲and for load applied at the tip共Tip兲.
In the case of gears generated with rack and loaded at the HP-STC, results of calculations of the parameterssFn, hFe, F
per-formed in accordance with the ISO standard are close to the cor-responding results obtained on the basis of the AGMA standard 共Figs. 14 and 15兲.
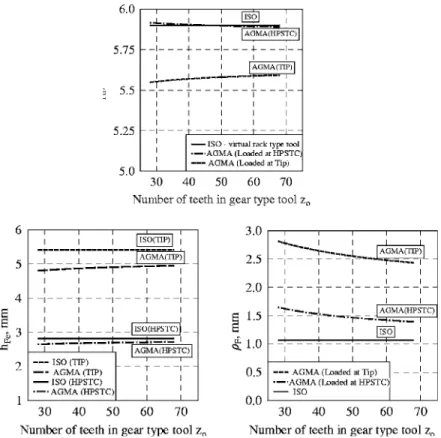
Slightly bigger differences occur between the results for load applied at the tip. In the case of gears generated with gear tools, the differences are more significant, especially, for load applied at the tip. It follows from the fact that according to the ISO standard the calculations are made not for real gear tool used in gear manu-facturing but for a virtual rack with the same reference tooth form.
Therefore, calculations made in accordance with the ISO standard do not consider either influence of the number of teeth of the tool
z0or a sharpening range of the tool共in the case of gear tool each sharpening of the tool induces changes in parameters of the tool and changes in some parameters of the generated gear—Fig. 16兲. Calculations made for gears with different magnitudes of the normal modulemnshow that all parameters of the critical section
are nearly proportional to the normal module共Fig. 17兲.
3.4 Coefficients Used in Computational Procedures.In or-der to calculate nominal tooth-root stresses in accordance with both the ISO and AGMA standards, it is necessary to calculate certain coefficients, which take into account profile of the fillet 共parameters of the critical section兲, complex stress state in tooth root and concentration of stresses caused by a geometric notch 共fillet at tooth root兲. Methods of calculation of these coefficients are given in Table 4.
In both standards, calculations for the helical gearings are per-formed the same way as in the case of spur straight tooth gearings with the virtual number of teethzn. An influence of the helical tooth trace on tooth-root strength is additionally taken into ac-count by related coefficients. In the ISO standard it is a helix angle factorY共Table 4兲. In the AGMA standard the formula for the bending strength geometry factorYJconsiders the load sharing ratiomN共in the case of spur gearsmN= 1.0兲 and the formula for
the tooth form factorYconsidersandw, i.e., helix angle at the
reference cylinder and helix angle at the operating pitch cylinder, respectively共Table 4兲.
3.5 Load Factors.The stresses at tooth root result from real loads transmitted in gear transmission and not from nominal ones. Therefore, both ISO and AGMA standards consider the corre-sponding load factors共Table 5兲. These factors take into account increase of stresses due to errors arising in gear transmission Fig. 15 Influence of the number of teethz0of the gear tool on parameters
of the critical section:sFn,hFe,Faccording to the ISO, AGMA for load ap-plied at the tip„Tip…and at the HPSTC; main parameters of the gear tool „generating tool…and gear are the same as in Fig. 11
Fig. 16 Influence of the range of sharpening of gear tool„ pa-rameter u… on parameters of the critical section: sFn, hFe, F according to the AGMA standard for load applied at the HPSTC „left…, the range of sharpening of gear tool„right…; main param-eters of the gear tool„generating tool…, and the gear in section 0-0 are the same as in Fig. 11
manufacturing, due to internal and external dynamic loads and non-uniform distribution of loads in gear transmission. The stan-dards contain suitable formulas or tables based on which one can determine values of the load factors.
3.6 Stress at Tooth Root.Stress at tooth root is considered in both ISO and AGMA standards as a representative parameter in the evaluation of root strength of gear. First-nominal tooth-root stress FO is calculated for the nominal load and for the assumed form of the fillet and parameters of the critical section. Then, the stress is recalculated with the use of the load factors 共Table 5兲to get local tooth-root stressF共Table 6兲.
The objective of this work is to compare influence of tooth geometry共resulting from applied method of gear generation and from parameters of the tools兲on the tooth-root strength, according to both the ISO and AGMA standards. Therefore, in all computa-tions the load factors 共Table 5兲 were not taken into account, as they do not introduce any new information as far as the analysis of influence of tooth geometry on tooth-root strength is considered. 4 Analysis of Tooth-Root Stresses According to the ISO and AGMA Standards and FEM
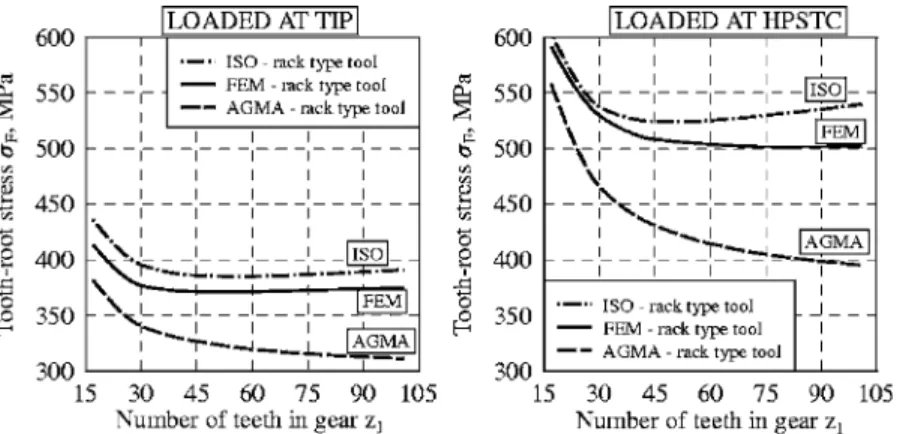
Stresses calculated for various models of gears in accordance with the ISO and AGMA standards as well as based on the FEM models developed in the ADINA关42兴environment, are compared in Figs. 18–25. Results of computations made for gears with dif-ferent number of teethz1generated with racks are shown in Fig. 18. Similarly, as in the case of parameters calculations of the critical section given in Sec. 3.3, computations of tooth-root stress were made for two load cases: for load applied at the highest point of single tooth contact and for load applied at the tip, respectively. Figure 19 presents stresses calculated for gears manufactured with gear tools for various number of teethz0, Figure 20 shows
stresses calculated for gear manufactured with one exemplary gear tool, but with different magnitudes of parameterurelated to the geometric effect of tool sharpening. In the ISO standard any real gear tool is replaced with a related virtual rack. Therefore, tooth-root stresses calculated in accordance with this standard are con-stant, i.e., they do not depend on the parametersz0andu.
Influence of some other important geometric parameters of gears, like normal pressure angle␣n, addendum modification co-efficientx1, helix angle at the reference cylinder1, and normal
module mn on magnitude of tooth-root stress are given in Figs. 21–25, respectively.
The models of helical gears were built of 3D 20-node isopara-metric and eight-node brick finite elements. They represented three teeth segments of gears with load applied to the central tooth in the most unfavorable case共assuming no misalignments in gear axes兲of load distributed along the diagonal line of contact passing through the tip corner of tooth flank. The boundary conditions reflected the ones shown in Fig. 1, and were applied on corre-sponding boundary surfaces of the 3D models of gear segments. Distributions of the effective stresses along tooth line passing through critical sections in various FEM models of helical gears with different helix anglesand along fillet in various transversal sections of helical gear with helix angle= 17 deg are shown in Fig. 24.
In all performed computations, tooth-root stresses obtained ac-cording to the ISO standard were greater than the tooth-root stress calculated according to the AGMA standard. The difference was bigger in the case of load applied at the tip than in the case of load applied at the HPSTC. Stresses computed with the use of the finite element method were in between, i.e., were greater than stresses according to the AGMA and smaller than stresses according to the ISO standard.
Comparison of locations of the critical section and the angle Fig. 17 Influence of the normal modulemnon parameters of the critical
sec-tion:sFn,hFe,Faccording to the ISO and AGMA standards for load applied at the tip„Tip…, and at the HPSTC; main parameters of the rack„generating tool… and gear are the same as in Fig. 12
Table 4 Computational coefficients
ISO AGMA
Tooth form factor YF: Tooth form factor Y:
This factor considers influence of shape of tooth at the tooth-root stress. This shape is defined in computational procedure by the parameters of the critical section
This factor considers influence of shape of tooth at the tooth-root stress. This shape is defined in computational procedure by the parameters of the critical section
YF=6共hFe/mn兲cos␣Fen 共sFn/mn兲2cos␣n Y= coswcos cos␣Fen cos␣wn
关
6hFe sFn2 Ch −tg␣Fen sFn兴
where:␣Fen-load angle;␣n-normal pressure angle at thepitch cylinder.
where:␣Fen-load angle;␣wn-operating normal pressure angle;-helix angle at the reference cylinder;
w-operating helix angle;Ch-helix factor.
Helix angle factor Y: Helix factor Ch:
This factor considers difference in stresses at tooth root between helical gear and virtual spur gear with straight teeth used for calculations
The helix factorChis calculated in the following way:-for spur gearsCh= 1.0
-for conventional helical gears Y= 1 −  120 Ch= 1 1 −
关
100共
1 − 100兲兴
0.5where:=arctg共tgsin␣n兲
Stress correction factor YS: Stress correction factor Kf:
This factor considers complex stress state at tooth root and stress concentration caused by the fillet共geometric notch兲
This factor considers complex stress state at tooth root and stress concentration caused by the fillet共geometric notch兲 YS=共1.2+ 0.13L兲qs a Kf=H+
共
sFn F兲
L共
sFn hFe兲
Mwhere:L=sFn/hFe; where:H= 0.331− 0.436␣n;
qs=sFn/共2F兲; L= 0.324− 0.492␣n;M= 0.261+ 0.54␣n a=关1.21+ 2.3/L兴−1 Bending strength geometry factor Y
J: This factor is calculated from the equation
YJ=YC KfmN
where:C-helical overlap factor共for spur and conventional helical transmissionsC= 1.0兲;mN- load sharing ratio共for spur gearsmN= 1.0; for helical gears mN=b/Lmin兲;b-effective face width;Lmin-minimum
length of contact lines.
Table 5 Load factors
ISO AGMA
KA- application factor: considers variations of external loads acting on gear transmission in relation to the nominal load共Table 1兲;
Ko- overload factor; Kv- dynamic factor;
KH- load distribution factor; Kv- dynamic factor: considers internal dynamic loads
caused by vibrations of pinion and gear;
KS- size factor: considers influence of size of gearing on tooth-root stress;
KF- face load factor共root stress兲: considers possible
non-uniform distribution of load along contact line;
KB- rim thickness factor关33兴. KF␣-transverse load factor共root stress兲: considers
distribution of load between the pairs of teeth in contact, including non-uniform distribution of load along path of contact关27兴.
Table 6 Stress at tooth root
ISO AGMA
Nominal tooth-root stressF0关27兴: Local tooth-root stressF关33,34兴
F0= Ft bmn YFYSY F=FtKoKvKS 1 bmt KHKB YJ
Local tooth-root stressF: where:mt-transverse module
between tangent to fillet and tooth center line computed according to the ISO and AGMA standards as well as according to the pre-cise finite element analysis is shown in Fig. 26.
Different locations of critical section at tooth root is caused by the fact that ISO and AGMA standards use different methods to determine critical section. This leads to different magnitudes of critical section parameters, such as: hFe, sFn, F,. Additionally,
both standards determine these parameters by using different for-mulas. Varying locations of critical section are the main reason of differences in tooth-root stresses, which can be seen in Figs. 18–23.
In the case of gears manufactured with racks, stresses computed with the use of the finite element method were closer to the results of the ISO standard. In the cases of gears manufactured with gear tools, stresses computed with the use of the finite element method were closer to the results of the AGMA standard. Absolute differ-ences in stresses calculated in accordance with the ISO and AGMA standards diminish with growing normal modulemn共Fig. 25兲.
5 Summary and Conclusions
This paper conducts a comprehensive analysis of the geometri-cal parameters and their impact on gear performance as described by the ISO关27兴and AGMA关29–37兴standards with FEM compu-tations conducted by the authors. Furthermore, the presented
analysis leads to suggestions and recommendations which can be used in future preparation of gear standards. The presented com-parative analysis is important for modern design and manufactur-ing of gears conducted globally at various locations. Current trends in engineering globalization necessitate revisiting various normalized standards to determine their common fundamentals and best approaches needed to develop “best practices” in auto-motive, aerospace and other industries关1,2,48,49兴. This can lead to both reduction in redundancies and also cost containment re-lated to needed adjustments between manufacturers for missing part interchangeability and performance due to incompatibility of different standards. Also, currently many manufacturers are faced with the necessity of obtaining certificates of their products in Europe, USA, or in Asia.
Therefore, in this paper methods of evaluation of tooth-root strength according to the ISO and AGMA standards are compared by matching:共i兲formulas used in both standards;共ii兲estimation of critical section location共determined by the angleFbetween tooth centerline and tangent to fillet at the critical point F兲, and共iii兲 parameters of the critical section and tooth-root stresses. Calcula-tions were performed for gears generated with racks and gear tools for various combinations of main parameters of gear geom-etry and tools used for manufacturing as well as for different locations of load application. Stresses determined in accordance with the ISO and AGMA standards are compared with results of Fig. 18 Influence of the number of gear teethz1on tooth-root stressF
ac-cording to the ISO standard, AGMA standard, and FEM: for load applied at the tip Fbn/b= 250 N / mm „left… and for load applied at the HPSTC Fbn/b = 500 N / mm„right…; main parameters of the rack„generating tool…and gear are the same as in Fig. 10
Fig. 19 Influence of the number of teethz0of the gear tool on tooth-root stressFaccording to the ISO standard, AGMA standard, and FEM: for load applied at the tip„left…and for load applied at the HPSTC„right…; main pa-rameters of the gear tool„generating tool…and gear are the same as in Fig. 11; magnitude of load is the same as in Fig. 18
related finite element analysis of the gears. Conclusions following from the performed analysis can be grouped in these categories.
1. Strength of helical gears. In both standards tooth-root strength analysis is performed for virtual straight tooth spur gearing with virtual number of teethzn.
2. Strength of gears manufactured with racks. In the ISO, standard calculations are performed for rack with assumed standard basic rack tooth profile. In the AGMA, standard calculations are made for virtual gear tool with the same standard basic rack tooth profile and very large number of teeth共z0= 10.000兲.
3. Strength of gears manufactured with gear tools. In the ISO standard real gear tool is replaced with virtual rack with the same standard basic rack tooth profile. This significantly simplifies calculations though it may lead to incorrect results in parameters of the critical section and in tooth-root stress 共tooth profiles generated with gear tools and racks can sig-nificantly differ from each other兲. In the AGMA standard calculations are done for real gear tool.
4. Location of the critical section. Methods of determination of the critical section are different in the ISO standard and in the AGMA standard. This leads to magnitudes of the angle
Fbetween tooth centerline and tangent to fillet at the
criti-cal point F and the parameters of the critical section:sFn,
hFe, and F. In the case of load applied at the HPSTC the differences are relatively small. However, in the case of load applied at the tip the differences are meaningful.
5. Tooth-root stress. In both standards, evaluation of tooth-root strength is performed based on maximum stress at tooth root on the stretched side of the tooth. It is assumed that the Fig. 20 Influence of the range of sharpening of gear tool„parameter u… on
tooth-root stressFaccording to the ISO, AGMA, and FEM: for load applied at the tip„left…and for load applied at the HPSTC„right…; main parameters of the gear tool„generating tool…and the gear in section 0-0 are the same as in Fig. 11; magnitude of load is the same as in Fig. 18
Fig. 21 Influence of the normal pressure angle␣non tooth-root stressFaccording to the ISO, AGMA, and FEM: for load applied at the tip; main parameters of the gear:mn= 2.75,z1 = 45,s1= 4.265,1= 0 deg; main parameters of the rack„ gener-ating tool…: s0= 4.320, fP= 0.18mn; magnitude of load is the same as in Fig. 18
Fig. 22 Influence of the addendum modification coefficientx1 on tooth-root stressFaccording to the ISO, AGMA, and FEM: for load applied at the tip; main parameters of the gear: mn
= 2.75,␣n= 20 deg,1= 0 deg; main parameter of the rack„ gen-erating tool…:fP= 0.18mn; magnitude of load is the same as in Fig. 18
Fig. 23 Influence of the helix angle1on tooth-root stressF according to the ISO, AGMA, and FEM for load applied at the tip; main parameters of the gear: mn= 5.0, z1= 24,␣n= 20 deg, magnitude of distributed load passing through the tip corner of helical tooth flankFbn/b= 274 N / mm
maximum stress occurs in the critical section of the tooth. Differences in tooth-root stresses calculated according to the ISO and AGMA standards共Figs. 18–25兲are caused by ap-plication of different formulas for tooth form factor and stress correction factor 共Table 4兲. Those coefficients are computed in both standards using the same parameters of critical section. However, in the formula defining tooth form factor, Y in AGMA, there exists an additional component tg␣Fen/sFn, which does not exist in the corresponding for-mula for tooth form factorYFin the ISO standard. Formulas
for stress correction factor共YSaccording to ISO andKf
ac-cording to AGMA兲differ, first of all, in applied exponents 共Table 4兲. As a result of that, even in the case when compu-tations are made for load applied at the HPSTC共for which case differences in both location and parameters of critical section determined according to ISO and AGMA standards are insignificant - Figs. 10–12, 14, 15, and 17兲, computed tooth-root stresses differ from each other. Those differences in tooth-root stresses calculations according to the ISO and AGMA standards are bigger in the case when computations are conducted for load applied to tooth tip than to HPSTC. This is caused by the fact that considered ISO and AGMA standards differently determine both location and parameters of critical section共Fig. 9兲. In all considered cases tooth-root stresses calculated in accordance with the ISO were bigger
than corresponding results according to the AGMA. At the same time, the difference in tooth-root stress was much big-ger in the case of load applied at the tip than in the case of load applied at the HPSTC. Results of finite element com-putations were bigger than AGMA and smaller than ISO results. In the case of gears generated with racks stresses computed with finite elements were closer to the ISO results and in the case of gears generated with gear tools they were closer to the AGMA results.
6. Influence of geometric parameters of gearing on tooth-root strength. Both standards differ in evaluation of an in-fluence of the helix angle1, pressure angle␣1, and
adden-dum modification coefficientx1on tooth-root strength共Figs. 20–25兲.
Detailed conclusions following comparison of related formulas and results of calculations are given in corresponding sections of this paper.
Appendix
In order to enable comparison of corresponding relations be-tween considered parameters used in the ISO and AGMA stan-dards, one of them should be presented and analyzed in relation to the other. Nomenclature used in this paper follows the ISO stan-dard关27兴. Original AGMA nomenclature is given in Table 7. The Fig. 24 Distribution of the effective stresses along tooth line passing through
critical sections in various finite element models of helical gears with different helix angles„left…and along fillet in various transversal sections of helical gear with helix angle= 17 deg„right…; main parameters of the gear:mn= 5.0,
z1= 24; magnitude of distributed load passing through the tip corner of helical tooth flankFbn/b= 274 N / mm; parameter⌬used for determination of location of transversal sections of tooth is illustrated in Fig. 7 left
Fig. 25 Influence of the normal module mn on tooth-root stressFaccording to the ISO and AGMA for load applied at the tip„Tip…and at the HPSTC; main parameters of the gener-ating rack and gear are the same as in Fig. 12; magnitude of load is the same as in Fig. 18
Fig. 26 Comparison of locations of the critical section and the angle between tangent to fillet and tooth centerline computed according to the ISO „left… and AGMA„middle… standards as well as according to the precise finite element analysis„right… of the gears with the same tooth profiles; magnitude of load is the same as in Fig. 18