NEW EVIDENCE FOR THE UNITED STATES FROM THE
NATIONAL ESTABLISHMENT TIME SERIES
David Neumark, Brandon Wall, and Junfu Zhang*
Abstract—We use the National Establishment Time Series (NETS) torevisit the debate about the role of small businesses in job creation (Birch, 1987; Davis, Haltiwanger, & Schuh, 1996a). Using the NETS data, we examine evidence for the overall economy, as well as for different sec-tors. The results indicate that small firms and small establishments create more jobs, on net, although the difference is much smaller than Birch’s methods suggest. Moreover, in the recent period we study, a negative relationship between establishment size and net job creation holds for both the manufacturing and services sectors.
I. Introduction
E
VER since the provocative work of David Birch (1979, 1981, 1987), researchers have paid considerable atten-tion to the role of small businesses in job creaatten-tion.1 The central thesis of Birch’s research was that small firms are the most important source of job creation in the U.S. econ-omy.2He provided the first evidence in support of the argu-ment that small businesses are the primary engines of job growth, claiming that 66% of all net new jobs in the United States between 1969 and 1976 were created by firms with twenty or fewer employees, and 81.5% were created by firms with one hundred or fewer employees (Birch 1979, 1981). Later, Birch (1987) argued that during the period 1981 to 1985, firms with fewer than twenty employees accounted for 82% of employment growth through expan-sion and contraction of existing firms and 88.1% of overall employment growth.Birch’s argument about the important role of small busi-nesses in job creation fit perfectly with the U.S. govern-ment’s long tradition of supporting small businesses. As early as 1953, the U.S. Congress passed the Small Business
Act with the intention of aiding, counseling, assisting, and protecting the interests of small businesses. Under this act, the federal government established the Small Business Administration (SBA) to ensure that a fair proportion of government contracts went to small businesses. The SBA also makes direct loans and guarantees bank loans to small businesses, based on the perspective that assisting small businesses is important to preserve free competitive enter-prise and to maintain and strengthen the U.S. economy.3 Birch’s findings fed into this thinking and quickly became conventional wisdom.4 Since then, his findings have often been cited as justification for favorable government regula-tions, tax incentives, and support programs for small busi-nesses.5 Birch’s work appears to have had a lasting effect on U.S. policy. For example, the SBA has an Office of Advocacy (for small businesses) that still trumpets Birch’s findings in trying to help small businesses with regard to regulatory constraints, taxation, and other matters.6
Even if Birch’s results are taken at face value, the policy arguments that have been made based on the results are not so clear. Assuming small businesses indeed create a dispro-portionate share of jobs, this does not imply that the next dollar spent either indirectly on tax or regulatory relief or directly on subsidies would lead to more job creation if directed to small rather than larger businesses. About all that can be said based on Birch’s findings is that policy-makers should be cognizant of the potential to weaken an important source of job growth if policies are implemented that increase costs for small businesses (or policies are not
Received for publication March 6, 2008. Revision accepted for publica-tion August 19, 2009.
* Neumark: University of California, Irvine, Public Policy Institute of California, NBER, and IZA; Wall: Ph.D. candidate in economics at Stan-ford University and KIPP Foundation; Zhang: Clark University.
Neumark’s and Wall’s research was supported by the Kauffman Foun-dation, and our work with the national version of the National Establish-ment Time Series was made possible by a grant from the David A. Coul-ter Family Foundation to the Public Policy Institute of California. We are grateful for helpful comments received from the editor and an anonymous reviewer. All views expressed are our own and do not represent those of the Kauffman Foundation, the Public Policy Institute of California, or the David A. Coulter Family Foundation.
1See, for example, Baldwin and Picot (1995), Barnes and Haskel
(2002), Broersma and Gautier (1997), Davis, Haltiwanger, and Schuh, (1996a, 1996b), Hohti (2000), and Wagner (1995).
2There is a parallel, largely separate industrial organization literature
that asks how employment growth varies by firm size, based on what is known as Gibrat’s law, which states that firm growth rates are indepen-dent of size (Gibrat, 1931). As a behavioral conjecture proposed to explain the observed firm size distribution, Gibrat’s law has generated a large amount of research testing its validity: See the review in Sutton (1997).
3See http://www.sba.gov/aboutsba/index.html (viewed October 31,
2007).
4See Davis et al. (1996b) for many references reciting this conventional
wisdom.
5A series of legislative actions has continued the tradition of helping
small businesses since Birch’s work, including, for example, the Small Business Economic Policy Act of 1980; the Small Business Innovation Development Act of 1982; the Small Business Competitiveness Demon-stration Program Act of 1988; the Small Business Technology Transfer Act of 1992; the National Small Business Act of 1996; the Small Business Job Protection Act of 1996; the Small Business Regulatory Enforcement Fairness Act of 1996; the Small Business Reauthorization Act of 1997; the Small Business Franchise Act of 1999; the Small Business Procure-ment Competition Act of 2001; the Small Business Paperwork Relief Act of 2002; and the Small Business Health Fairness Act of 2005. In deter-mining eligibility for most of these programs, the SBA specifies size stan-dards on an industry-by-industry basis, most commonly based on number of employees, but sometimes based instead on annual receipts. The employee size thresholds range from 100 for wholesale trade to 1,500 for industries such as petroleum refineries, air transportation, and telecom-munications. See http://www.sba.gov/idc/groups/public/documents/sba_ homepage/serv_sstd_tablepdf.pdf (viewed October 31, 2007) for a com-plete list of the size standards.
6See http://www.sba.gov/advo/25ann.html and http://www.sba.gov/
advo/mission.html (viewed October 7, 2007).
The Review of Economics and Statistics, February 2011, 93(1): 16–29
implemented to counter sources of rising costs for these businesses).
In fact, however, Birch’s results have not been taken at face value; rather, his work has attracted considerable criti-cism. Brown, Hamilton, and Medoff (1990) emphasize that the number of jobs created by an employer is not the only thing that matters. They compare jobs created by small firms with those created by large firms, and argue that jobs created by small firms are less desirable because they tend to exist for a shorter period of time, pay lower wages, and have less generous fringe benefits in terms of health insur-ance, vacation, and pension plans. In addition, they argue that small firms tend to have poorer working conditions and provide less job training.7 Based on these findings, they recommend that policymakers be cautious about encoura-ging policies to help small firms. Although their argument is an important one, it is not the focus of our paper.
Second, focusing more specifically on the job creation debate, Davis et al. (1996a) criticize Birch’s calculation, which divides firms into size classes and then examines the variation in job growth across size classes. In particular, they argue that these calculations are subject to a ‘‘regression fallacy’’ that leads to upward bias in the esti-mated contribution of small firms to job growth. When they use a calculation that, they argue, is not prone to this bias, with data on the manufacturing sector from the Longitudi-nal Research Database (LRD) covering the period 1973 to 1988, they conclude that employment growth appears to have ‘‘no systematic relationship to average plant size’’ (p. 68).8
In this paper, we use a new database, the National Estab-lishment Time Series (NETS), which was constructed using the most recent waves of the Dun and Bradstreet (D&B) data. The availability of this new database provides a valu-able opportunity to revisit the Birch thesis, as well as the conclusions drawn by Davis et al. (1996a). Given that Davis et al.’s results come solely from the manufacturing sector, it is important to ask whether their conclusions apply to the overall economy and to other sectors of the economy, which we are able to do using the NETS data.9 Also, the answer to the questions addressed by this research may depend on the period studied. In particular, innovative
start-ups appeared to have played an important role in the Inter-net revolution and the boom of the new economy in the late 1990s (Audretsch & Thurik, 2001), raising the possibility that in this period (and extending beyond the manufacturing sector), new (and thus mostly small) firms contributed more to employment growth.10
Butani et al. (2006) also provide evidence on questions about comparing job growth across size classes, based on the new Business Employment Dynamics (BED) data pro-duced by the U.S. Bureau of Labor Statistics. Their focus is on comparing alternative measurement methods, although some of the evidence is complementary to ours. However, we present more evidence on a number of substantive issues relating to the size-growth relationship, such as compari-sons across industrial sectors, differences between the sta-tistics for firms and establishments, and the role of births. Moreover, our analysis highlights a new data source that is available to the research community for use without the confidentiality restrictions and other limitations on access and use that characterize research with many firm- or estab-lishment-level federal data products.11
II. Previous Research
Birch’s work prompted numerous researchers to consider his methods and to test his hypothesis in different coun-tries.12Focusing first on methods, Davis et al. (1996a) criti-cize the statistical analysis leading to Birch’s conclusions, pointing out that when businesses are classified by size for a given base year, two types of firms will ‘‘accidentally’’ fall into a smaller size category: firms that are not small but have just experienced a transitory negative shock to their employment and appear to be small for the moment, and firms that are not small but are mistakenly classified as small due to random measurement errors.13If such transi-tory shocks or random measurement errors are not highly serially correlated, both types of ‘‘small’’ firms will ‘‘grow’’ fast over the next year only because of regression to the mean. A reverse argument can be made for large firms. That is, some large firms are categorized as large only because of
7In their work, their analysis of job creation looks at firms, while their
analyses of other issues, such as wage premiums and fringe benefits, look at both firms and establishments.
8Davis et al. (1996a) report results based on both plant and firm size.
However, the results they used to refute Birch are based on plant size.
9Indeed, there are reasons to believe that growth patterns in the
manu-facturing sector may not apply to the rest of the economy. As Klepper and Graddy (1990) observed, the number of firms in an industry will grow first, then decline sharply, and level off eventually. Thus, new and mature industries tend to show different industrial structures and growth patterns. For example, one may find a large number of new (and thus small) firms in a new industry, which grow fast and contribute a large share of employment growth. On the contrary, a mature industry may be shrink-ing, and usually it is the smaller firms that exit first and thus constitute a large share of job loss. One of the most prominent features of the U.S. manufacturing sector is that its total employment (relative to the U.S. total) has been continuously declining since 1950 (Sachs & Shatz, 1994).
10Although young firms and small firms overlap a great deal, they are
conceptually distinct groups. Most research, following the tradition estab-lished by Birch, focuses on the dichotomy of small and large firms. See Neumark, Zhang, and Wall (2006) for discussion of the contribution to job growth by young and old firms.
11Indeed, in other research (e.g., Mazzolari & Neumark, 2009), it has
proven useful to be able to identify firms in the NETS. We can only spec-ulate on the directions that research on the size-growth relationship might take given the ability to identify firms. At the same time, we have little doubt that federal data sets based on administrative records (including the BED data discussed in Butani et al., 2006) are more accurate for workers covered by those records.
12Much of the latter research appeared inSmall Business Economics,
the founding of which was partly inspired by Birch’s work (Acs & Audretsch, 1989).
13As explained later (see the appendix), the NETS is not based on
administrative data, and hence measurement error can occur. Even in administrative data, of course, there can be measurement error because of clerical error or failure of the administrative definition of employment to capture all employment.
positive transitory shocks and random measurement errors. These firms tend to experience negative growth if the transi-tory shocks or the measurement errors are not strongly seri-ally correlated, leading to a downward bias in the estimated growth rate of large firms.14
To avoid this statistical pitfall, Davis et al. propose com-puting job creation and destruction rates from the base per-iodt1to periodtrelative to the average employment level in these two periods.15They argue that the regression fal-lacy fully explains the relationship between establishment size and job growth, and they find no systematic relation-ship between manufacturing plant size and employment growth when using the average instead of a base-year size measure.16They also suggest that the measurement error in the D&B data Birch used is more serious than in the LRD data, and thus the regression fallacy bias is even more severe in Birch’s results (Davis et al., 1996a).17
In response to Davis et al.’s (1996a) criticism of Birch’s findings, Davidsson, Lindmark, and Olofsson (1998) con-sider whether the regression fallacy can account for the apparent important role of small firms in job creation by attempting to estimate the bias from the regression to the mean that underlies the regression fallacy. Based on evi-dence from Swedish data, they suggest that the regression fallacy accounts for little distortion in the relationship between firm size and net job growth. Indeed, in the broader research literature on firm (or establishment) size and job creation prompted by Birch’s work, which covers many countries, analyses that use Davis et al.’s (1996a) method to avoid the regression fallacy more often than not confirm the finding that small establishments or firms con-tribute more to job growth. For example, Kirchhoff and Phillips (1988) examine the contribution of small and large firms to U.S. job growth. They find that firms with fewer than 100 employees are the major sources of net job crea-tion. In contrast, firms with more than 1,000 employees provided only 13% of all new jobs despite their 37% employment share (in 1985). Using Canadian data on the manufacturing sector, Baldwin and Picot (1995) find that net job creation by small manufacturing establishments is greater than that of large establishments. Broersma and Gautier (1997), using firm-level data for the Netherlands, find that small firms contribute more to net job creation than large ones. For the United Kingdom, Barnes and Has-kel (2002) find that small establishments contribute more to net job creation. Voulgaris, Papadogonas, and Agiomir-gianakis (2005) also find that small firms create more jobs on net, using data from Greece. On the other hand, Hohti (2000), studying data for Finland, reaches a conclusion more in line with Davis et al. (1996a)—that there is no clear relationship between establishment size and net job creation.18
One limitation of the existing literature is that much of it focuses on the manufacturing sector.19 However, findings from that sector do not necessarily apply to other industries; ample empirical evidence shows that depending on the rela-tive importance of entry cost, scale economies, industry growth, and capital intensity, the relationship between sur-vival rate and firm size varies a great deal from one industry
14In earlier work, Leonard (1986) also argues that the larger role of
small businesses in job creation is an artifact resulting from regression to the mean. Leonard (1987) reports some direct evidence consistent with regression to the mean in establishment size and suggests that it is attribu-table to real dynamics rather than measurement error. Davis et al. (1996a) and Kirchhoff and Greene (1998) point out that many studies prior to Birch (1979), which did not use longitudinal data, could have either over-stated or underover-stated job growth due to smaller firms or larger firms, depending on whether firms were on average shrinking or growing. Lack-ing establishment-level data, these pre-Birch studies typically calculated the number of new jobs in each size category as the difference between the number of jobs in the size category this year and the number of jobs in the same size category in the previous year. This procedure wrongly assumes that firms do not move between size categories. Thus, for exam-ple, in periods in which firms are on average growing, this results in over-statement of job growth in large firms because jobs created when firms grow into a larger size class are mistakenly interpreted as job creation by firms in that size class.
15Somewhat confusingly, they refer to this as the ‘‘current’’
establish-ment size measure. Davis et al. (1996a, 1996b) also define a historical average size as a weighted average of employment over all years of an establishment’s existence in the sample period, using employment as the weight. They consider this as a measure of the business establishment’s intended scale of operations. By this definition, a business is small only if it is intended to be small and thus stays small for many years. From this perspective, employment fluctuations at the business establishment level are considered mostly random, resulting from changes in demand or other market conditions. Carree and Klomp (1996) cast doubt on the usefulness of this concept of long-run firm size. First, facing changes in its environ-ment, a firm should and will continuously adjust its optimal size. Second, for young firms that just entered the market, it is impossible to know their intended long-run size. We therefore do not use this latter measure. Our ‘‘average’’ measure corresponds to Davis et al.’s ‘‘current’’ measure, as ‘‘average’’ seems a more appropriate label.
16Davis et al. also extend their criticism to similar calculations
typi-cally included in the annual SBA’sReport to the President(in the mid- to late 1980s).
17In addition to avoiding the regression fallacy, average size also is
widely used because it captures job creation and destruction symmetri-cally (e.g., Pivetz, Searson, & Spletzer, 2001). For example, suppose a firm’s number of employees is 1, 2, and 1 in three consecutive years. If we use base-year employment as the denominator to calculate the growth rate, this firm has experienced 100% job growth followed by 50% job decline. Alternatively, if we use two-year average employment as the denominator, this firm has 67% job growth (¼1/1.5) followed by 67% job decline (¼ 1/1.5). Butani et al. (2006) present yet another method of measuring the size-growth relationship, using ‘‘dynamic sizing,’’ which assumes that employment changes linearly with time, and based on this assumption allocates growth or decline that results in a firm crossing a size category partly to one category, and partly to the other.
18Some research has also documented that whereas small firms create a
large share of new jobs, they are also responsible for a large share of job loss. For example, using data on manufacturing establishments from Ger-many, Wagner (1995) finds that although net job creation rates are not systematically related to establishment size, gross job creation and destruction rates tend to be higher the smaller the establishment. Broersma and Gautier (1997), Hohti (2000), and Barnes and Haskel (2002) also find that small firms have both higher job creation and higher job destruction rates than large ones. Similar results are reported by Galla-gher, Daly, and Thomason (1991) for the United Kingdom, for the period 1985 to 1987, with small firms contributing 48% of job creation but also 43% of job destruction, although they constituted only 21% of all employ-ment in 1985. For this period, there is some evidence that small firms cre-ate more jobs on net, although the relationship is not very clear.
19See also Dunne, Roberts, and Samuelson (1989), Evans (1987), and
Hall (1987), all of which use data from the manufacturing sector; Dunne et al. study establishments, and the other two papers study firms.
to another.20Because of this difference in survival, it is nat-ural that small firms may be found to grow faster than larger ones in one industry but not in another when one examines surviving as well as exiting firms. Davidsson et al. (1998), echoing concerns raised by other researchers, questioned whether one should draw general implications regarding the behavior of small establishments or firms in job creation from the information on plant-level data from the declining manufacturing sector in the United States used by Davis et al. (1996a, 1996b). Using data from the Dutch services sector, Audretsch et al. (2004) show that firm growth in ser-vices is largely independent of firm size, in contrast to evi-dence from manufacturing. Lotti (2007) compares the pat-terns of firm entry, growth, and survival in manufacturing and services. He finds that the patterns in the services sector are qualitatively similar to the stylized facts from the manu-facturing sector, although there are some quantitative dif-ferences. For example, the positive effect of firm size on firm survival is larger in the services sector.
III. The National Establishment Time Series Database The database used in this study, the National Establish-ment Time Series (NETS), is a relatively new longitudinal file created by Walls & Associates (2003) using D&B data. In this paper, we report results based on the national NETS file covering all business establishments (including their parent headquarters) in the United States beginning in 1992 and extending through 2004.21 The unit of observation in the NETS is a business establishment, which is a business or industrial unit at a single physical location that produces or distributes goods or provides services—for example, a sin-gle store or factory. Of course, many firms own or control more than one establishment, and those establishments may be located in different geographic areas and may be engaged in different industries. The NETS data indicate whether an establishment is a stand-alone firm or a branch of a multi-establishment firm, and in the latter case, multi-establishments of the same firm can be linked by the identifier for the firm’s headquarters. We use the wordbusinessto refer generically to firms or establishments, reserving the wordfirmfor col-lections of many establishments with a common owner.
One highly desirable feature of the NETS database is that it covers essentially all firms and establishments. This reflects the fact that it is designed to capture the universe rather than a sample of establishments. Over the period 1992 to 2004 that we study, the database includes informa-tion each year on an average of about 13.1 million firms and 14.7 million establishments. In total, more than 157
million firm-year observations and 177 million establish-ment-year observations are covered in the NETS database for this period.
The earlier D&B data (from thirty years ago) that were used in Birch’s work came in for considerable criticism. In particular, Davis et al. (1996a, 1996b) assert that these data were not particularly suitable for studying job creation and destruction dynamics for two reasons. First, early D&B data gave a much higher total employment level than alternative data sources such as those from census or the Bureau of Labor Statistics (BLS). Second, the early D&B data did a poor job in terms of capturing new businesses, as documented in pre-vious research that Davis et al. cite (and discussed further in Neumark et al., 2007). However, information technology has improved dramatically during the decades since then, and data sources have changed. Consequently the quality of the D&B data may have improved substantially. For these rea-sons, we have undertaken a good deal of investigation to document and examine the quality of the NETS data in order to assess their reliability and their potential limitations, and how these limitations might affect results of various analyses. Details on the NETS data, including evaluation of their qual-ity, are given in the appendix. Overall, we find that the NETS database, like others, is not without its flaws and has both advantages and limitations. Its complete coverage of the economy annually is an advantage that we value most for our study here. To answer the question of whether small busi-nesses create more jobs, we think it crucial to examine all sec-tors of the economy instead of just the manufacturing sector that most previous research has focused on. Earlier D&B data were criticized for reporting higher aggregate employment levels and capturing the births of businesses poorly. With the NETS database, which was constructed using more recent D&B data, we find that the former is not a serious concern and the latter is largely invalid.
IV. Employer Size and Job Creation: Empirical Findings
We take two approaches to investigating whether small businesses create more jobs. First, following the tradition established by Birch (1987) and Davis et al. (1996a), we divide businesses into different size categories and examine whether there is a significant difference in net job creation rates across firm and establishment size categories. Second, we nonparametrically estimate the relationship between employment growth and firm or establishment size to avoid any potential biases or loss of information introduced by using arbitrary size boundaries.
A. Job Creation and Destruction by Employer Size
Measurement of employer size and job creation and destruction. We focus on firms but also report some results for establishments. Firm size seems a more relevant measure to study than establishment size. Indeed, government
regula-20See the long list of references cited in Audretsch et al. (2004). 21We have previously used the NETS data for California to study
busi-ness relocation (Neumark, Zhang, & Wall, 2007) and the contribution of new firms to employment growth (Neumark, Zhang, & Wall, 2006). Other work uses the NETS data to study changes in the geographic scope of firms’ operations (Kolko & Neumark, 2008) and agglomeration econo-mies in the high-tech sector (Wallace & Walls, 2004).
tions related to small businesses usually target small firms instead of small establishments.22However, some previous studies were conducted at the establishment level, so estab-lishment-level analyses are useful for drawing comparisons. It is common practice in this area to divide businesses into different size categories and then investigate the variation in net job creation across size categories (see, e.g., Birch, 1987; Davis et al., 1996a, 1996b). Following this practice, we define the size of a business in the following two ways:
Base-year size: The size of the business at the starting point of the interval over which employment growth is calculated. This is the definition Birch (1979, 1981, 1987) used, which Davis et al. criticized because it tends to overestimate the contribution of small businesses to job creation due to the regression fallacy.
Average size: The simple average of business size in base year (t1) and current year (t). This definition was proposed by Davis et al. to avoid the regression fallacy.23 Remember that the regression fallacy stems from the fact that some businesses are categorized as small only due to random measurement errors or transitory employment declines that influence measured employment on a year-to-year basis and thus will regress to the mean in a short time. Using this average size measure, one will treat a business as small only if its average size over the two-year period is below the designated cutoff. In particular, it will not be classified as small based solely on a single year’s data that place it in the small category for that year; the underlying assumption is that random measurement errors and transitory employment declines do not last two years. It is important to note that using this average size defini-tion, one can find a less important role of small businesses in job creation than using the base-year definition even if regression to the mean does not exist. Consider an example in which every business grows with a positive rate and the measurement is always accurate. By construction, there will be no bias due to the regression fallacy in the calculation of job creation using the base-year size definition. However, the average size definition will still give a lower job creation rate among small businesses than the base-year size defini-tion because the fastest-growing businesses, even if they start small, will be less likely to be categorized as small under the average size definition. Therefore, although calcu-lations based on average size tend to mitigate the potential biases from the regression fallacy, we should not interpret
the difference between calculations based on these two size definitions as solely resulting from the regression fallacy.
For businesses in each size category, we use the follow-ing measures to quantify their contributions to job creation, again following Davis et al. (1996a):
Gross job creation: The sum of employment gains over all businesses whose employment level is greater than one year ago. Businesses just started are assumed to have 0 employment prior to opening, and thus this measure captures both job growth at expanding businesses and job creation by business openings.
Gross job destruction: The sum of job loss over all businesses whose employment level is smaller than one year ago. Businesses just closed are assumed to have 0 employment after closing, and thus this measure captures both job decline at contracting businesses and job loss due to business closures.
Net job creation: The difference between gross job creation and gross job destruction. Net job creation is the most relevant measure insofar as we care about growth in the number of jobs. However, it is interesting to look at gross job creation and destruction to learn how the net growth is achieved. For example, a 3% net job creation rate can be a result of either a 5% gross job creation rate net of a 2% gross job destruction rate, or a 13% gross job creation rate net of a 10% gross job destruction rate. The latter case involves much more reallocation of jobs among businesses, an issue of some importance in the macroeconomic literature.24
Main results. The first two panels in table 1 report infor-mation on job creation by firms of different sizes, using the base-year and average size definitions. The first column shows the annual average net number of jobs created in each size category from 1992 to 2004. We follow this, in the sec-ond column, by showing average annual employment in each size category. The third column reports the ratio of the two (in percentage terms), scaling average net job creation by the amount of employment in the size category. This pro-vides one measure of the rate at which jobs are created in each size category. The fourth column reports an alternative calculation of the job creation rate, based on averaging the job creation rate from each year of the data.25As it turns out, the figures in the third and fourth columns are very similar.
When the base-year size is used, in panel I, we find that net job creation is high for the smallest firms and decreases sharply with firm size. While the average annual rate of job
22All federal agencies are required to use the business size standard
developed by the SBA to determine eligibility for federal contracts, pro-grams, and regulations specifically designated for small businesses. In this size standard,small businessis defined by either number of employ-ees or average annual receipts, and the calculation of size ‘‘includes the employees or receipts of all affiliates.’’ See http://www.sba.gov/services/ contractingopportunities/sizestandardstopics/indexguide/index.html (viewed October 7, 2007). The BLS also uses firm size when it publishes statistics on employment dynamics by employer size (Butani et al., 2006).
23As noted earlier, they call it ‘‘current’’ size.
24These gross job creation and destruction statistics calculated at the
firm or establishment level still underestimate worker reallocation. For example, within an establishment, some jobs (e.g., assemblers) may be destroyed and others (e.g., technicians) may be added, with no change in overall employment. Studying worker reallocation requires the ability to track individual workers, as in the Longitudinal Employer–Household Dynamics data (http://lehd.did.census.gov/led/, viewed October 7, 2007).
25That is, the third column reports the ratio of averages and the fourth
creation in the 0–19 category is 10.9% (using the number in the third column), it falls to about1.1% to 0.5% for firms with between 20 and 999 workers and is always negative, indicating net job loss, for firms with 1,000 or more work-ers, with rather large negative net job creation rates for large firms.26 These findings clearly suggest an important role of small firms in job creation, consistent with Birch’s (1979, 1981, 1987) findings using the same method.
The second panel in table 1 presents the results using the average size definition. Under this size definition, the rate of net job creation for small firms falls considerably to 2.9% (from 10.9%). More generally, the differences in the net job creation rate by firm size become more muted. For example, using average firm size, we find none of the large negative net job creation rates for the largest firms that we found using base-year size; indeed, the rate is negative for only one of the largest size categories, and in this case the estimate is smaller (in absolute value) than in panel I. None-theless, overall there is still a clear negative relationship
TABLE1.—JOBCREATION ANDDESTRUCTION BYFIRM ANDESTABLISHMENTSIZE, 1992–2004: ALLINDUSTRIESEXCLUDINGGOVERNMENT
Size Class
Average Net Job Creation
Average Employment
Average Net Job Creation/Average
Employment
Average Net Job Creation Ratea
I. Base-Year Firm Sizeb
0 to 19 4,179,048 38,215,617 10.9% 11.1%
20 to 49 159,450 14,389,586 1.1 1.1
50 to 99 96,482 10,325,408 0.9 0.9
100 to 249 22,107 11,037,856 0.2 0.3
250 to 499 34,820 7,365,998 0.5 0.6
500 to 999 36,366 6,851,664 0.5 0.6
1,000 to 2,499 58,454 9,670,052 0.6 0.4
2,500 to 4,999 160,780 7,155,795 2.2 2.1
5,000 to 9,999 191,036 7,084,326 2.7 2.6
10,000 to 24,999 341,387 9,431,762 3.6 3.5
25,000 to 49,999 301,039 7,600,407 4.0 3.9
50,000 or more 299,311 14,267,256 2.1 2.0
II. Average Firm Sizec
0 to 19 1,132,487 39,304,785 2.9% 2.9%
20 to 49 308,704 14,480,245 2.1 2.2
50 to 99 178,759 10,287,322 1.7 1.8
100 to 249 212,421 11,084,215 1.9 2.0
250 to 499 149,733 7,428,853 2.0 2.1
500 to 999 133,398 6,974,588 1.9 2.0
1,000 to 2,499 171,130 9,750,853 1.8 1.8
2,500 to 4,999 87,721 7,220,647 1.2 1.3
5,000 to 9,999 101,459 7,111,482 1.4 1.5
10,000 to 24,999 16,799 9,398,609 0.2 0.1
25,000 to 49,999 35,658 7,455,097 0.5 0.5
50,000 or more 169,731 14,231,233 1.2 1.3
III. Base-Year Establishment Sizeb
0 to 19 6,829,153 45,003,636 15.2% 15.4%
20 to 49 546,477 20,967,053 2.6 2.6
50 to 99 581,445 16,992,400 3.4 3.4
100 to 249 859,541 19,896,321 4.3 4.2
250 to 499 668,198 11,480,730 5.8 5.7
500 to 999 659,923 9,496,506 6.9 6.8
1,000 to 2,499 1,018,858 10,891,797 9.4 9.2
2,500 to 4,999 441,553 5,305,761 8.3 8.3
5,000 or more 490,234 4,792,636 10.2 10.3
IV. Average Establishment Sizec
0 to 19 1,213,084 46,461,808 2.6% 2.7%
20 to 49 309,182 21,185,626 1.5 1.5
50 to 99 179,353 17,054,487 1.1 1.1
100 to 249 120,325 19,843,990 0.6 0.7
250 to 499 12,651 11,446,607 0.1 0.1
500 to 999 60,299 9,534,934 0.6 0.5
1,000 to 2,499 102,151 10,493,875 1.0 1.0
2,500 to 4,999 43,803 5,131,225 0.9 0.9
5,000 or more 66,851 4,455,035 1.5 1.7
a
Equal to the average across years of the ratio of net job creation to total employment within a size category.
b
Equal to the number of employees in the initial year of the interval over which net job creation is calculated.
c
Equal to the average number of employees in the initial year and the following year of the interval over which net job creation is calculated. As a result, the smallest size category when we use average firm or establishment size is 0.5, since a firm or establishment with 0 employment in both years would not be in the sample.
between the net job creation rate and firm size.27The net job creation rate declines fairly monotonically with size, although there is some evidence of a higher net job creation rate for the largest firms (50,000 or more).
Comparing panels I and II in table 1, we do see evidence consistent with the regression fallacy. By the logic of the Davis et al. ideal measurement of firm size, the base-year size definition tends to greatly overestimate net job creation by the smallest firms and underestimate net job creation by the largest firms. This is reflected by our results, which show that net job creation at the smallest firms is much lower using the average firm size as opposed to the base-year firm size definition. However, our results in panel II suggest that Birch’s conclusion is still valid—just to a lesser extent than his methods suggest.
Much of the evidence in Davis et al.’s work focuses on establishments rather than firms, so in the bottom two panels of table 1 we report similar calculations by establishment size category. The evidence on net job creation by establish-ment size is qualitatively similar. Using the base-year size categories, in panel III, the net job creation rate clearly decreases with establishment size. Total jobs at establish-ments with nineteen or fewer employees grow by 15.2% annually. Establishments in all other size categories show a negative net job creation rate. Again, the differences are muted considerably when using the average size definition (see panel IV). Under this size definition, the rate of net job creation for the smallest establishments falls sharply to 2.6% (from 15.2%). The same rate for the largest establishments becomes much higher (1.5%, in contrast to the 10.2% calculated using the base-year size definition). However, there is still an overall negative relationship between the net job creation rate and establishment size, with only establish-ments with fewer than 500 workers creating jobs and estab-lishments in higher size categories losing jobs.
The results in table 1 are different from the findings in Davis et al. (1996a, 1996b). In particular, looking at estab-lishments, Davis et al. find that once they use the average size definition instead of the base-year size definition, the important role of small businesses in job creation that Birch (1979, 1981, 1987) emphasized completely disappears, and there is instead either no relationship or a positive relation-ship between net job creation and establishment size.28In contrast, we still find that small establishments create more jobs even if the average size definition is used, although the results are less striking. And the results are similar for firm size, which may be more relevant to the question of public
policy. Therefore, these findings point to the importance of avoiding the regression fallacy in estimating the size-growth relationship. However, there still seems to be some truth to Birch’s original conclusion regarding the important role of small businesses in job creation.
In table 2, we report information on gross job creation and destruction at the firm level.29As noted earlier, we do not observe simultaneous job creation and job destruction at the same establishment. We do not measure simultaneous job creation and destruction at different establishments belonging to the same firm. Nonetheless, the across-firm reallocation measures are of interest in light of the policy debate about the role of small firms in job creation, in which those who argue that small firms create a dispropor-tionate share of jobs sometimes fail to point out that they also destroy a disproportionate share of jobs.30
As reported in table 2, when the base-year size is used, we find that the smallest firms do create a disproportionate share of jobs.31This is perhaps most easily seen by comparing the third and fifth columns of panel I. Firms with fewer than twenty workers create 51.1% of the total increase in employ-ment at firms that grow, yet they account for only 26.7% of total employment. Firms in all other size categories have a gross job creation share (third column) smaller than their employment share (fifth column). On the other hand, the smal-lest firms account for only a slightly disproportionate share of job destruction, as shown by a comparison of the fourth and fifth columns in panel I (28.9% of gross job destruction, rela-tive to a 26.7% employment share). Finally, the relationship between gross job creation or destruction and firm size is not monotonic, as the smaller firms outside the smallest category have relatively low gross job creation and destruction rates.
Of course, the same regression to the mean fallacy can drive the findings for gross job creation and destruction. Panel II, which uses the average firm size measure, leads to differences with respect to two findings. First, the smallest firms still generate a disproportionate share of gross job creation (35.1%, relative to a 27.2% employment share), although the imbalance is less extreme. On the other hand, there is stronger evidence that the smallest firms also gener-ate a disproportiongener-ate share of gross job destruction (33.9%, relative to the 27.2% employment share). Second, the gross job creation and gross job destruction rates for the largest firms are now much more in balance than suggested by the estimates in panel I, which helps account for the
27Relative to the differences in the estimates under the base-year size
definition, these differences in growth rates among average size cate-gories seem small. However, since these are annual growth rates, the dif-ferences are still quite substantial.
28See their table 4.2. Just to clarify, this positive relationship emerges
for their ‘‘current’’ size measure, which we label ‘‘average establishment size.’’ The correlation between net job growth and the ranking of this size category is 0.75, and the correlation between net job growth and the mid-point of the size category (using 7,500 for the 5,000 or more category) is 0.46.
29We treat the firm as the unit of analysis. We compute jobs created at
firms that grew and jobs destroyed at firms that shrank, and then sum these within size categories to obtain gross job creation and destruction by size category.
30See de Rugy (2005) for numerous examples. We could, in principle,
compute gross creation and destruction at the establishment level and aggregate up to the firm. However, this treats single- and multi-establishment firms asymmetrically and is less closely related to the pol-icy debate. (Moreover, this would still fail to capture within-establishment job reallocation and would hence be difficult to interpret.)
31We report these results for firms only; the results are qualitatively
more moderate changes in net job creation rates with size that we reported in table 1 using the average size measure.
Sensitivity and robustness analysis. We have conducted a series of analyses to assess the sensitivity and robustness of the main results. The results of some of these analyses are reported in tables 3 and 4, and others are discussed in the text. In panel I of table 3, we report results for firms, always using the average size definition. For comparison purposes, the first column of panel I shows the baseline net job creation rates across firm size categories (reproducing the fourth column of panel II in table 1).
First, we explore the sensitivity of the results to using a longer (two-year instead of one-year) interval over which to measure job creation. Measures of employment dynamics are potentially sensitive to the interval length. This is parti-cularly true of gross flows. For example, as the interval length increases, the share of gross job creation due to births has to increase, as does the share of gross job destruc-tion due to deaths. However, there are no necessary impli-cations for net job creation, either overall or by firm size. The results in the second column of panel I, which are annualized net job creation rates calculated using growth over two-year intervals, are very similar to the baseline esti-mates in the first column, indicating net job creation rates that are highest for the smallest firms and decline nearly monotonically with firm size, again with the exception of the largest size category.
In the third column, we revert to one-year intervals but look at net job creation excluding births, to see whether the faster rate of job creation at small businesses is driven only by births or also holds for existing small firms. The results are rather striking and indicate that if we exclude births, the net job crea-tion rate is slowest at the smallest firms. It is clearly of interest to understand the sources of the overall faster rate of job crea-tion among smaller firms. However, the evidence that it comes from births should not be interpreted as undermining the view that small firms create more jobs or as suggesting that policies directed at helping small firms are misplaced. With regard to the first point, the estimates simply reflect the fact that firm births tend to result, in the short run, in small firms rather than big firms. Since small firms also die at a higher rate, if we omitted deaths, we would find the opposite result. With regard to policy, there is no reason to presume that policies aimed at helping small businesses are not as responsible or more responsible for business births as for the growth of existing small businesses. Even if these policies do not directly lead to births of new businesses, any forward-looking entrepreneur would take account of the benefits made available to small firms in deciding whether to start a new company, because new firms are originally small and most remain small.
Next, we turn to some results on establishments—the unit of analysis emphasized in Davis et al. (1996a). Given that these authors used the LRD data, which cover only the manufacturing sector, their results could be unique to man-ufacturing. We therefore replicated our baseline
calcula-TABLE2.—RATES ANDSHARES OFGROSSJOBCREATION ANDDESTRUCTION BYFIRM, 1992–2004: ALLINDUSTRIESEXCLUDINGGOVERNMENT
Size Class
Average Gross Job Creation
Rate
Average Gross Job Destruction
Rate
Average Share of Gross Job Creation
Average Share of Gross Job
Destruction
Average Employment
Share
I. Base-Year Firm Sizea
0 to 19 20.3% 9.2% 51.1% 28.9% 26.7%
20 to 49 5.7 6.8 5.5 8.1 10.1
50 to 99 6.1 7.0 4.2 6.0 7.2
100 to 249 7.8 7.5 5.7 6.7 7.7
250 to 499 8.7 8.1 4.2 4.9 5.1
500 to 999 9.3 8.7 4.3 4.8 4.8
1,000 to 2,499 9.3 9.7 6.1 7.5 6.7
2,500 to 4,999 8.2 10.4 3.9 6.0 5.0
5,000 to 9,999 8.1 10.7 3.8 6.1 4.9
10,000 to 24,999 7.2 10.6 4.4 8.1 6.6
25,000 to 49,999 5.5 9.4 2.8 5.7 5.3
50,000 or more 4.3 6.3 4.0 7.2 9.9
II. Average Firm Sizeb
0 to 19 13.4% 10.4% 35.1% 33.9% 27.2%
20 to 49 8.6 6.5 8.4 7.8 10.0
50 to 99 7.7 6.0 5.3 5.0 7.1
100 to 249 9.2 7.2 6.7 6.5 7.7
250 to 499 10.1 8.0 4.9 4.8 5.1
500 to 999 11.5 9.5 5.3 5.3 4.8
1,000 to 2,499 11.6 9.8 7.5 7.7 6.7
2,500 to 4,999 11.5 10.2 5.5 5.9 5.0
5,000 to 9,999 11.5 10.0 5.5 5.6 4.9
10,000 to 24,999 10.2 10.4 6.4 7.9 6.5
25,000 to 49,999 7.3 6.8 3.6 4.1 5.2
50,000 or more 6.2 5.0 5.9 5.5 9.8
Note: All rates and shares are calculated in each year and then averaged over the years 1992–2004.
a
Equal to the number of employees in the initial year of the interval over which net job creation is calculated.
b
Equal to the average number of employees in the initial year and the following year of the interval over which net job creation is calculated. As a result, the smallest size category when we use average firm or establishment size is 0.5, since a firm or establishment with 0 employment in both years would not be in the sample.
tions for manufacturing establishments only; for compari-son purposes, we also did this for services establishments. The results are shown in the second and third columns of panel II in table 3 (the first column reproduces the baseline establishment-level results). The results for the manufactur-ing sector are a bit different from the baseline results usmanufactur-ing all industries. First, manufacturing establishments in all size categories except the smallest lose jobs, which contrasts with the baseline and services sector results that only estab-lishments with 500 or more employees lose jobs, but is con-sistent with the fact that manufacturing has been a declining sector. Second, compared to the baseline results and the ser-vices sector, the relationship between size and growth is not as clear for manufacturing establishments. It is true that only the smallest establishments gain jobs on net and the largest establishments lose the most jobs. But in the inter-mediate categories, the relationship is not monotonic. Nonetheless, the results indicate that the net job creation rate declines with establishment size in the manufacturing sector as well.32Therefore, these findings suggest that for
the more recent sample period we study, the conclusions that Davis et al. reached do not apply to firms overall, estab-lishments overall, or estabestab-lishments in either the manufac-turing or the services sector.
Finally, we explored a number of other measurement issues in the NETS data. First, as documented in Neumark et al. (2007) and discussed in the appendix, a considerable share of employment data in the NETS is not actual but imputed. To a large extent, this occurs when the raw D&B files from which the NETS is constructed are missing obser-vations on establishments; for example, this can occur when there is a delay in detecting a new establishment, and D&B picks up an establishment that indicates it was born a year or two earlier, in which case the data are backfilled in the NETS.33 The NETS database always indicates whether a particular employment number is imputed, making it possi-ble to check whether our main result is robust to the use of imputed employment data. We were interested in exploring the potential consequences of this imputation for the
size-TABLE3.—ALTERNATIVEFIRM-LEVEL ANDESTABLISHMENT-LEVELANALYSES, NETJOBCREATIONRATES BYAVERAGEFIRM ORESTABLISHMENTSIZE, 1992–2004: ALLINDUSTRIESEXCLUDINGGOVERNMENT
I. Firms
Size Classa Baseline Results
Use Two-Year Changes Instead of
One-Year Changes (Annualized)b Omitting Birthsc
0 to 19 2.9% 2.7% 7.6%
20 to 49 2.2 2.0 1.3
50 to 99 1.8 1.6 0.1
100 to 249 2.0 1.7 0.1
250 to 499 2.1 1.8 0.3
500 to 999 2.0 1.6 0.1
1,000 to 2,499 1.8 1.5 0.3
2,500 to 4,999 1.3 1.1 0.6
5,000 to 9,999 1.5 1.0 1.1
10,000 to 24,999 0.1 0.3 0.2
25,000 to 49,999 0.5 0.2 0.5
50,000 or more 1.3 1.3 1.3
Number of observations 157,040,590 74,592,611 140,845,181
II. Establishments
Size Classa Baseline Results Manufacturing Sectord Services Sectord
0 to 19 2.7% 0.6% 3.8%
20 to 49 1.5 0.6 2.0
50 to 99 1.1 0.9 1.3
100 to 249 0.7 1.0 0.8
250 to 499 0.1 0.6 0.2
500 to 999 0.5 1.3 0.3
1,000 to 2,499 1.0 2.0 0.8
2,500 to 4,999 0.9 1.4 0.8
5,000 or more 1.7 3.8 0.6
Number of observations 176,893,094 9,526,547 98,330,915
a
This is average employer size, defined as the average number of employees in the initial year and the following year of the interval over which net job creation is calculated. See the earlier comments regarding this calculation from the notes to tables 1 and 2.
b
We retain only even-numbered years to avoid overweighting the observations that are not at the end points of the sample period.
cThe smallest size class for this column should also be 0.5 to 19 employees. Although we omit observations in which employment is 0 in the base year, we can have a firm with 1 employee in the base year and 0
employees in the subsequent year.
dWe treat the 2% of the establishments whose NAICS code changed over time as belonging to the industry in which they are classified for the most number of years. In the event that an establishment is classified
in two industries for an equally long period of time, the more recent of the two industries is chosen.
32The correlation between net job growth and the ranking of size
cate-gory is0.86, and the correlation between net job growth and the mid-point of the size category (using 7,500 for the 5,000 or more category) is
0.87.
33This is by far the most common reason for imputation. In general,
once an establishment shows up in the NETS, data in subsequent years are actual rather than imputed. However, the NETS also uses imputation when the D&B data for a particular year are suspect, based on compari-sons with prior and following years.
growth relationship. Given that the NETS data are at the establishment level, we do this analysis for establishments rather than firms.34In particular, we redid the calculations dropping establishments with imputed employment data. This is carried out in four ways: (1) dropping an establish-ment if its employestablish-ment is imputed in every year, (2) drop-ping an establishment if its employment is imputed in more than 50% of years, (3) dropping an establishment if its employment is imputed in more than 25% of years, and (4) dropping an establishment if its employment is imputed in any year.
Overall, as reported in table 4, unless the data exclusion criterion is extremely stringent, the results resemble the baseline results. When we drop the establishments with all, more than half, or more than one-quarter imputed employ-ment data, the results still indicate that small establishemploy-ments have higher net job creation rates and the net job creation rate declines with size. Only when establishments with any imputed data are dropped is there no longer an indication that net job creation is higher at smaller establishments; however, this last analysis uses a sample that is very restric-tive, dropping 73% of the observations. It is reassuring that the main result does not disappear even when many obser-vations with imputed data are dropped. It is also not entirely surprising that the results are affected by the stringent cri-terion of dropping observations with any imputed data. Neumark et al. (2007) show that imputation is most com-mon for early observations on new establishments, so that imposing a restriction of no imputed data might generate a nonrandom sample that, for example, excludes small new establishments in certain industries that tend not to be picked up right away by D&B.
As also documented in Neumark et al. (2007), the distri-bution of employment numbers in the NETS data tends to
be disproportionally concentrated on multiples of 10 or 100. We consider this a sign that some of the employment data have been rounded. Naturally we are concerned that the higher net job creation rates of small establishments may be an artifact of rounded employment data, although there is no obvious reason that rounding would create bias in this direction. We have investigated the problem of rounded employment data in two ways.35First, we drop the establishments that seem most likely to have rounded employment numbers. Specifically, we exclude an estab-lishment from our calculation if its employment is a multi-ple of 10 or 100 in every year. The results are quite similar to the baseline, showing a monotonically decreasing rate of net job creation with establishment size. Second, instead of dropping establishments that may be reporting rounded data, we consider ways in which the employment data might have been rounded and artificially round all employ-ment data in the same way. We then recalculate net job creation rates across establishment size groups using the artificially rounded data. The idea is that if our results are affected by systematic differences in which establishments have rounded employment data, then the results from the artificially rounded data are likely to be significantly differ-ent from our baseline results. The results, however, were insensitive to this artificial rounding.36 In all cases, the results still indicated that small establishments have higher net job creation rates, and as in the baseline results, only establishments with fewer than 500 employees were net job
TABLE4.—ROBUSTNESS OFESTABLISHMENT-LEVELRESULTS TOIMPUTATION, 1992–2004: ALLINDUSTRIESEXCLUDINGGOVERNMENT
Size Classa
Baseline Results
Drop Any Establishment with Employment
Imputed in Every Year
Drop Any Establishment with Employment Imputed
in More Than 50% of Years
Drop Any Establishment with Employment
Imputed in More Than 25% of Years
Drop Any Establishment with Employment Imputed
in Any Year
0 to 19 2.7% 2.3% 2.4% 1.3% 1.8%
20 to 49 1.5 1.6 1.7 1.3 0.1
50 to 99 1.1 1.2 1.4 1.1 0.1
100 to 249 0.7 0.7 0.9 0.7 0.2
250 to 499 0.1 0.2 0.4 0.1 0.8
500 to 999 0.5 0.5 0.3 0.7 1.5
1,000 to 2,499 1.0 1.0 0.6 1.0 1.5
2,500 to 4,999 0.9 1.0 0.5 0.7 1.0
5,000 or more 1.7 1.8 1.9 2.2 2.7
Number of observations 176,893,094 147,628,784 119,493,862 79,938,410 47,322,873
a
This is average establishment size, defined as the average number of employees in the initial year and the following year of the interval over which net job creation is calculated. See the earlier comments regarding this calculation from the notes to tables 1 and 2.
34In principle, one could define employment for a given firm and a
given year as imputed if data for any establishment in the firm in that year are imputed. However, in such cases, the imputation may cover a very small share of the firm’s employment.
35These results are not reported in tables, but are available from the
authors on request.
36We artificially rounded the employment data in four ways: (1) round
every employment number to the nearest multiple of 10; (2) round every em-ployment number down to the nearest multiple of 10; (3) round every employment number up to the nearest multiple of 10; and (4) round every employment number to the nearest multiple of 10 if it is under 100, and to the nearest multiple of 100 otherwise. All of these methods except the third resulted in substantially fewer observations because of small establishments that had their data rounded to 0.
creators, while establishments in all larger groups were esti-mated to destroy jobs on net.
B. Job Creation and Employer Size: Nonparametric Estimation
In the previous section, we followed existing research by dividing firms or establishments into different size cate-gories to examine the relationship between the net job crea-tion rate and employer size. The choice of the size bound-aries—while consistent with the ones used in the existing literature—is nevertheless arbitrary.37 The particular employer size-class boundaries that are chosen could obscure the relationship between employer size and the employment growth rate. In order to check the robustness of this relationship and offer point estimates for the com-plete range of firm or establishment sizes, we estimate the employment growth rate for every size using a nonpara-metric locally-weighted regression.38 Since the regression fallacy criticism also applies to these regression analyses, we use the average establishment size instead of the base-year size as our independent variable.
To visualize the nonparametric regression results, we plot the estimated mean net job creation rate against average size. Note that the number of jobs and its change are neces-sarily integers; the smallest unit is 1. When firm or estab-lishment size is close to 0, even a one-unit change (the
smallest possible nonzero growth or decline) in total employment amounts to very large growth or decline in per-centage terms. Therefore, the variance of the job growth rate is many times larger when firm or establishment size is close to 0. Although this is essentially an artifact of the data at the individual firm or establishment level, it obscures the picture of the relationship between the job growth rate and size. As a result, if we plot the relationship over the whole range of firm or establishment sizes, it always appears that the change in job growth rate is very large at the smallest sizes and indiscernible beyond that. Similarly, if we extend the figure to the largest possible size, its shape is hard to discern. To show the relationship more clearly, therefore, in each figure we present results for more restricted ranges: 5 to 50,000 employees for firms and 5 to 5,000 employees for establishments.
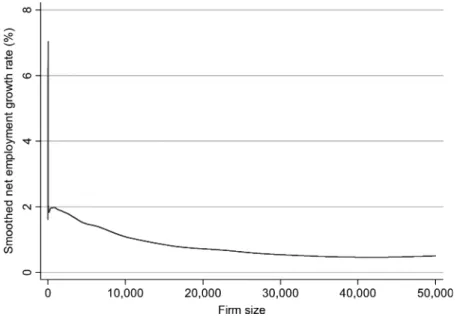
Figure 1 shows the results for firms and figure 2 for establishments.39As shown in figure 1, the net job creation rate clearly declines with firm size throughout most of the range of firm sizes except at the high end of the range (which is consistent with what was reported in table 1).40 For establishments, paralleling the analysis in table 3, we also estimated the relationship using the manufacturing and services sectors separately. For the whole sample, figure 2
FIGURE1.—NETJOBCREATIONRATE VERSUSFIRMSIZE(10% BANDWIDTH): FIRMSBETWEEN5AND50,000 EMPLOYEES
37Davis et al. (1996a) note that the choice of size-class boundaries is
one of the factors that influence the magnitude of the bias associated with the regression fallacy.
38Other researchers have estimated regressions of firm growth on firm
size; see, for example, Chesher (1979) and Audretsch et al. (2004). Fari-nas and Moreno (2000) use a nonparametric approach that is similar to ours, although there are some differences in the estimation, and their model is estimated using panel data on only about 2,200 manufacturing firms in Spain over a five-year period.
39To reduce the computational burden, we first create a mean net job
creation rate and an associated frequency weight for each unique value of firm or establishment size. Then we compute the locally weighted smoothed means; we use a 10% bandwidth kernel and tricubic weights, taking account of the weighting of the means. Other methods could be used to reduce the number of calculations, such as using a subsample of observations or evaluating the relationship at a limited number of points. We believe our method is preferable because it uses all the data and because there is an uneven support, with far more observations on small firms or establishments than on large ones. See Neumark, Wall, and Zhang (2008) for details.
40In this figure, we otherwise use the data the same way as in panel II
shows that the net job creation rate decreases monotonically with establishment size. The differences between the two subsamples are clear. The services sector results are almost indistinguishable from the results using the whole sample. For the manufacturing sector, the size-growth relationship is more irregular and exhibits an increasing rate of net job creation over much of the size range up to around 400 employees. Nonetheless, net job creation declines with size. In addition, as noted earlier, the manufacturing sector shows job declines across almost the entire range of estab-lishment size.
V. Conclusion
It has long been debated whether small businesses create more jobs than larger ones. The debate attracts a great deal of attention in both academia and the media because it has implications for policymaking. David Birch’s book (1987) was probably the most prominent catalyst for this debate, arguing that small businesses play a much more important role in job creation than larger businesses do—a view that quickly became the conventional wisdom. Yet this work was criticized, most notably by Davis et al. (1996a), who argued that Birch’s findings are essentially a result of a flawed methodology applied to some unsuitable data.
Using newly available data on firms and establishments for the whole U.S. economy, we revisit the issue of business size and job creation. The data are drawn from the NETS database, which was recently constructed using raw data collected by D&B. Our evaluation of the NETS data in separate work suggests that these data are rather reliable and a clear improvement on early versions of the D&B data used by David Birch in the 1970s and 1980s. We analyze
these data using two methods: one based on size classes, but following the methods of Davis et al. to avoid the regression fallacy that they argue plagued Birch’s work; and the other a nonparametric method that does not need to define arbitrary employer size categories.
Like Birch, we find that small firms (and small establish-ments as well) create more jobs. At the same time, we con-firmed that Davis et al.’s concern regarding Birch’s methods is well grounded, and the base-year size definition Birch used results in much higher net job creation rates for small firms or establishments. However, when we use the method that Davis et al. proposed to avoid the regression fallacy, we still find that small firms and establishments create more jobs, although the difference is smaller than Birch originally suggested. Moreover, in more direct contrast to the results in Davis et al. (1996a), we also find that the relationship between establishment size and job creation is negative in the manufacturing sector. Thus, at least for the recent period we study, there appears to be a robust finding that small businesses do create more jobs.
REFERENCES
Acs, Zoltan J., and David B. Audretsch, ‘‘Editors’ Introduction,’’Small Business Economics1:1 (1989), 1–5.
Audretsch, David B., Luuk Klomp, Enrico Santarelli, and A. Roy Thurik, ‘‘Gibrat’s Law: Are the Services Different?’’Review of Industrial Organization24:3 (2004), 301–324.
Audretsch, David B, and Roy Thurik, ‘‘What’s New about the New Econ-omy? Sources of Growth in the Managed and Entrepreneurial Economies,’’Industrial and Corporate Change10:1 (2001), 267– 315.
Baldwin, John, and Garnett Picot, ‘‘Employment Generation by Small Producers in the Canadian Manufacturing Sector,’’Small Business Economics7:4 (1995), 317–331.
FIGURE2.—NETJOBCREATIONRATE VERSUSESTABLISHMENTSIZE(10% BANDWIDTH): ESTABLISHMENTSBETWEEN5AND5,000 EMPLOYEES, OVERALL, MANUFACTURING,ANDSERVICES