AUSTRALIAN JOURNAL OF BASIC AND
APPLIED SCIENCES
ISSN:1991-8178 EISSN: 2309-8414 Journal home page: www.ajbasweb.com
Open Access Journal
Published BY AENSI Publication
© 2016 AENSI Publisher All rights reserved
This work is licensed under the Creative Commons Attribution International License (CC BY). http://creativecommons.org/licenses/by/4.0/
To Cite This Article: Tantri Bararoh., Improving Financial Performance through Ratios Indicators. Aust. J. Basic & Appl. Sci., 10(8): 45-52, 2016
Improving Financial Performance through Ratios Indicators
Tantri Bararoh
Wijaya Kusuma University, Accounting Department, Economic Faculty, Jl. Dukuh Kupang XXV / 54 Surabaya (062 - 31 5677577), Indonesia
Address For Correspondence:
Tantri Bararoh, Wijaya Kusuma University, Accounting Department, Economic Faculty, Jl. Dukuh Kupang XXV / 54 Surabaya (062 - 31 5677577), Indonesia
Tel: (062 - 31 5677577); E-mail: [email protected]
A R T I C L E I N F O A B S T R A C T Article history:
Received 12 January 2016 Accepted 4 April 2016 Available online 11 April 2016
Keywords:
EPS, Book to Market, CAR, ROE, and NPM.
This study objective is is to examine and analyze the effect of book to market ratio and CAMEL ratio on financial performance of banking industry which is listed on Indonesia Stock Exchange. Data used is secondary data of 20 banking for period 2010-2014. Total 100 unit data are analyzed by multiple regressions. Research results show that Banking conditions in Indonesia is health in accordance with CAMEL ratio standards issued by BI. IFRS convergence impact on banking industry does not only happen in Indonesia, but also in European banking equally incorporated in G20 countries. Not all variables affect the financial performance of EPS. Variables that affect EPS are book to market, CAR, ROE, and NPM.
INTRODUCTION
Globalization is advancing the world development and affects on a wide range of fields. The increasing globalization in economic field appears with agreement between countries to create an international standard reporting form that applies equally in all countries as well as high quality and can be applied globally. International Financial Reporting Standard (IFRS) is a financial reporting standards issued by International Accounting Standards Board (IASB) and answer to an agreement between countries in reporting of international standards. One by one country in world began to adopt IFRS (Sianipar and Marsono, 2013). This proves that convergence of financial reporting standards towards IFRS already inevitable by countries in world. IFRS has been adopted by many countries including the European Union countries, Africa, Asia, Latin America and Australia (Budiono et. al., 2015).
IFRS convergence shows some changes in banking regulations. Banking regulatory reform has been a concern since the G20 leaders summit Washington 2006 due to bank's health is essential to maintaining the health and resilience of national and global financial system. G20 leaders show their commitment to complete the agenda of implementation of Basel II by end of 2012 and started implementation of Basel III in January 2013. The role of bank capital and liquidity is seen as essential so that every member of G20 requested to meet the recommendations of Basel Committee on Banking Supervision (BCBS) on international banking standards. With implementation of framework of international banking standards, Indonesian banking industry is expected to create a healthier bank, more able to survive the crisis and increasingly competitive in global financial industry (www.kemenkeu.go.id).
Investors are helped because they can understand latest real value of a corporate entity. Latest real value is also considered highly relevant and assists the auditor in making the right decisions in a company. Barth et al. (2006) argues that as principle-based IFRS standards could further enhance the value relevance of accounting information. It is able to assist investors in making investment decisions. Besides the model of rational expectations Ewert and Wagenhofer (2005) showed that IFRS earnings to reflect the economic performance of a company. Before deciding to invest in shares in a company, often times the investors also pay attention book to market ratio. Book to market ratio is the ratio between the book value per share by stock market value. The book value per share strongly reflects the company's value, and value of company is reflected in economic value of its net assets (Fitriati, 2010).
The banking industry is one of institutions that have a major role in economic activity (Dahliawati and Febrianto, 2012). Banking has its own characteristics compared with other industry. This can be seen in balance of banking industry has a large number of obligations that, given the bank institution where customers entrust their wealth become stored in bank. The main targets become achieved by bank is a benefit to cover losses that may arise out of calculation of bank management (Dahliawati and Febrianto, 2012). CAMEL ratio assesses the performance and health of a financial institution used them. According to Dictionary of Banking Institute Indonesia (1999), CAMEL is an aspect that most affect the soundness of financial institutions. CAMEL consists of five criteria: capital, assets, management, earnings (profitability) and liquidity.
Profitability Assessment is considered essential to make Indonesian banking sound, strong and efficient. At end of June 2005, Bank Indonesia (BI) again announced the Anchor Bank is a high profitability can be seen from a minimum of 1.5% ROA (Rachmadhani, 2006). Earning Per Shares (EPS) become one important component in company's internal performance.
Based on background of problem, a problem which can be formulated in this study is weather book to market ratio and CAMEL ratio affect on financial performance of banking industry listed on Indonesia Stock Exchange? Goals become achieved in this study is to examine and analyze the effect of book to market ratio and CAMEL ratio on financial performance of banking industry which is listed on Indonesia Stock Exchange.
Theory And Hypotheses:
Ratio analysis is a number that indicates the relationship between the elements in financial statements by comparing the elements of balance sheet, income statement items, elements of balance sheet and income statement, as well as financial ratios issuers are one and financial ratios others expressed in mathematical form is simple, and is used to determine the financial health and progress of company (Samson, 2006: 143; Sugiono, 2009: 86). Sourced from the report, financial ratios can be structured to meet a variety of purposes and may be selected in accordance with ratio of group interests of various parties, both for investors, creditors, and management companies.
Book to Market Ratio:
Book to market ratio is needed by investors because the book to market a high ratio can become an indicator that company is still undervalued. When an enterprise is undervalued, it can be said that company is in less good condition so it is less able to provide benefits for investor’s investment (Fitriati, 2010). According to Ang (1997), book to market ratio is a ratio used as an indicator to measure the company performance through its market price. Theoretically, book to market ratio had a negative effect on stock returns. In other words the higher book to market ratio of a company create lower stock returns. Book to market ratio can be formulated as follows (Damodaran, 2002):
Book to Market = Equity Book Value Volume Stocks x Closing Value)
Camel Ratio:
Banking dictionary (Institute of Bankers Indonesia), second edition of 1999, defines CAMEL as an aspect that most affect the financial condition of banks, which also affect the health of banks. CAMEL is a standard that became the object of bank examinations conducted by bank supervisors. CAMEL ratio value is calculated by following indicators, namely:
A. CAR (Capital Adequacy Ratio):
CAR is the ratio to shows how much the total assets of financial institutions contain risks (credit, investments, securities, bills on other banks) who part financed from its own capital in addition to obtaining funds from outside the bank. This ratio can be formulated as follows (Circular Letter No. 3 / 30DPNP dated December 14, 2001):
This ratio measures the management capabilities of financial institutions in determining the amount of fixed assets and inventory owned by bank concerned to capital. The higher ratio means that capital owned bank is insufficient to support the fixed assets and inventory so that possibility of a bank in error will be even greater. This ratio can be formulated as follows (Circular Letter No. 3 / 30DPNP dated December 14, 2001):
Fixed Assets to Equity Ratio = (Fix Assets + Inventory) / Capital x 100%.
ROA (Return on Assets):
This ratio is used to measure the ability of financial institutions management to make profit (profit before tax) from the average of total assets of financial institution concerned. The larger the ROA shows greater the level of profit achieved of financial institutions so that possibility of a financial institution in problematic conditions getting smaller. Profit before tax is net income from operations before tax. While the average total assets is the average volume of business or assets. This ratio is defined as follows (Circular Letter No. 3 / 30DPNP dated December 14, 2001):
ROA = Profit Before Tax / Average Assets x 100%
ROE (Return on Equity):
This ratio is used to measure the management performance of financial institutions in managing the available capital to generate profit after tax. The larger the ROE sows greater the profit achieved of financial institutions so that probability of a bank in less problematic conditions. Profit after tax is the net profit from operations after taxes while the average total equity is the average core capital owned by financial institutions, calculation of core capital is based on provisions of applicable minimum capital liabilities. This ratio is defined as follows (Circular Letter No. 3 / 30DPNP dated December 14, 2001):
ROE = Profit After Tax / Average Equity x 100%
NPM (Net Profit Margin):
This ratio is used to measure the ability of bank's management in managing its productive assets to generate net interest income. Net interest income is derived from interest income minus interest expense. The greater this ratio, increase in interest income on earning assets managed by bank so that possibility of a bank in error is getting smaller. This ratio is defined as follows (Circular Letter No. 3 / 30DPNP dated December 14, 2001):
NPM = Net Interest Income / Assets Earning x 100%
ROA (Operating Expenses to Operating Income Ratio):
This ratio is often called the efficiency ratio to measure the ability of financial institution management in controlling operating expenses to get income. The smaller this ratio means more efficient operational costs incurred by financial institutions so that possibility of a financial institution in problematic conditions getting smaller. The operational costs are calculated based on sum of total interest expense and total other operating expenses. Operating income is the sum of total interest income and total other operating income. This ratio is defined as follows (Circular Letter No. 3 / 30DPNP dated December 14, 2001):
ROA = Operating Expenses / Operating Income x 100%
LDR (Loan to Deposit Ratio):
This ratio is used to assess the liquidity of a bank by dividing the number of loans granted by bank to deposit. Higher ratio show lower ability of bank's liquidity that possibility of a bank in error even greater. Loans receivable excluding loans to other banks, while for deposits are demand deposits, savings deposits, time deposits, certificates of deposit. This ratio can be formulated as follows (Circular Letter No. 3 / 30DPNP dated December 14, 2001):
LDR = Total Credit / Total Deposits x 100%
Earning Per Shares (EPS):
Nurhasanah (2014) explains that a high EPS has high attractiveness for investors. The higher the value of EPS shows higher company's ability to deliver higher profits to investors. According Tandelin (2010: 373), EPS is the net income that is ready become distributed to shareholders divided by company shares? Low ratio means the company does not produce a good performance by taking into account income. Low revenue because sales are not smooth or high cost. Higher ratio means the company has been established (Harahap, 2007).
EPS = Net Income / Number of Common Stock
Hypothesis:
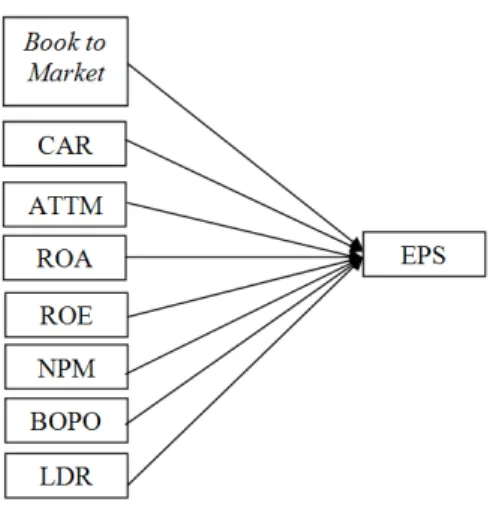
Based on theory presented above, hypothesis of this study can be presented below. H1: Book-to-market ratio significantly affect on EPS.
H3: ATTM significantly affect on EPS. H4: ROA significantly affect on EPS. H5: ROE significantly affect on EPS. H6: NPM significantly affect on EPS. H7: BOPO significantly affect on EPS. H8: LDR significantly affect on EPS.
Fig. 1: Analysis Model.
Research Methodology: Population and sample:
Design research is quantitative research with hypothesis testing. The study population was all company in banking industry are listed on Indonesia Stock Exchange (IDX) in 2010 - 2014. Sampling method is the judgment sampling method, which is one form of purposive sampling by sampling a predetermined based on intent Research by criteria:
1. The company is listing at Indonesia Stock Exchange for 2010-2014 and its financial statements are presented in Rupiah.
2. Companies with the audited financial statements. 3. Company report has complete data with study variables.
Population data used during 2010-2014 amounted to 41 companies. Referring to criteria established acquired 20 companies in sample. Total data unit is 100 (20 x 5 years)
Research Variables: A. Book to Market Ratio:
Book value provides a measurement of relatively stable as compared to market price because it can become benchmark for other companies who are in one sector (Darusman, 2012). Book to market ratio can be formulated as follows (Damodaran, 2002):
Book to Market = Equity Book Value / (Volume Stocks x Closing Value)
B. CAR:
CAR is the ratio of performance to measure the adequacy of bank capital owned banks to support the assets that contain or produce a risk, such as loans (Harjanti, 2011: 34). This ratio shows how much all of assets of banks that contain risks (credit, investments, securities, bills on other banks) is also financed by own capital of bank, in addition to obtaining funds from sources outside the bank, such as public funds, loans (debt), and others (Dendawijaya, 2001: 122).
CAR = Total Capital x 100%
Total Weighted Assets based on Risk
C. Fixed Assets to Equity Ratio:
This ratio measures the management capabilities of financial institutions in determining the amount of fixed assets and inventory owned by bank concerned to capital. Higher ratio means that capital owned bank insufficient to support the fixed assets and inventory so that possibility of a bank in error will be even greater. This ratio can be formulated as follows (Circular Letter No. 3 / 30DPNP dated December 14, 2001):
D. ROA:
This ratio is used to measure the ability of bank management to get profit as a whole over a certain period (Dendawijaya, 2001: 120). According to Hanafi (2000: 83), ROA is the ratio that measures a company's ability to generate profits by using total assets (wealth) of company after adjusting for expenses.
ROA = Profit Before Tax / Average Assets x 100%
E. ROE:
ROE is an indicator to measure the bank's ability to obtain net income related to dividend payments. According Munawir (2007: 240) ROE is the ratio between the net profits after tax with their own capital.
ROE = Profit After Tax / Average Equity x 100%.
F. NPM:
According to Sari and Ghozali (2011), NPM is a comparison of net interest income to average earning assets. Net interest income derived is from interest income minus interest expense. Productive assets are taken into account is interest bearing assets.
NPM = Net Interest Income / Assets Earning x 100%
G. BOPO:
According to Susanto and NJIT (2012), ROA is used to measure the level and distribution of bank in carrying out operational activities. Operational costs are incurred by bank in carrying out their daily activities include: salaries, marketing costs, interest charges. While operating income is the income received by bank obtained through credit in form of interest rates (Prasanjaya and Ramnatha, 2013).
ROA = Operating Expenses / Operating Income x 100%
H. LDR:
LDR is the credit to total deposits as an indicator of amount of third party funds are distributed in form of credit (Ma'rufah, et al. 2013). Cashmere (2011: 290) states that LDR is a ratio to measure the composition of amount of loans compared to amount of public funds and own capital employed.
LDR = Total Credit / Total Deposits x 100%
2. Dependent Variable:
The dependent variable is the variable that effect d the independent variable. The dependent variable in this study is EPS. According to Dewi and Suryana (2013), EPS is an indicator that is most often considered by investors before making an investment decision because all the results that can be achieved by company can provide a direct impact on amount of benefits in accordance with number of shares owned.
EPS = Net Income / Number of Common Stock
Analysis And Discussion: Hypothesis testing:
Multiple linear regressions is used to analyze a linear relationship between two or more independent variables and dependent variable. This analysis determine the direction of relationship between the independent and dependent variables weather each independent variable associated positively or negatively.
Computer calculations with application of SPSS 20.0 (Statistical Program for Social Science) is follows below.
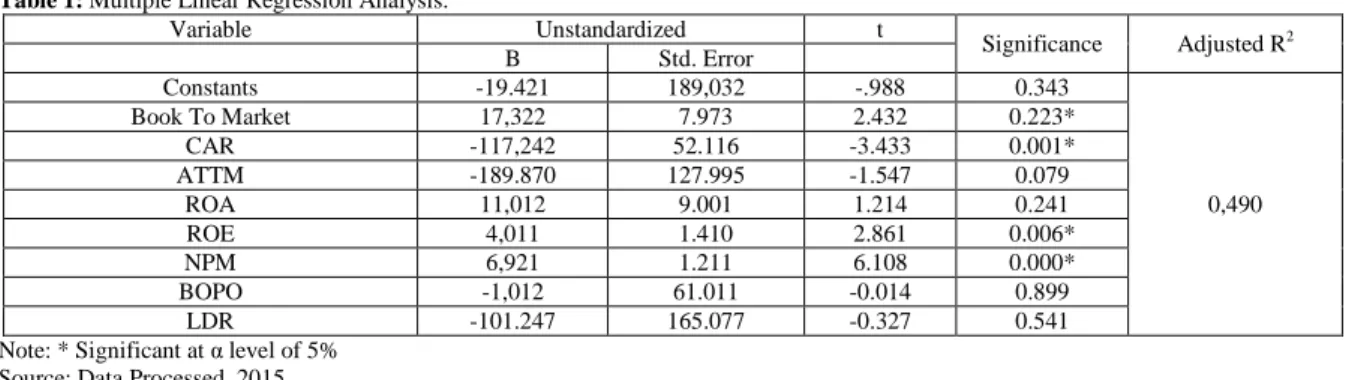
Table 1: Multiple Linear Regression Analysis.
Variable Unstandardized t
Significance Adjusted R2
B Std. Error
Constants -19.421 189,032 -.988 0.343
0,490
Book To Market 17,322 7.973 2.432 0.223*
CAR -117,242 52.116 -3.433 0.001*
ATTM -189.870 127.995 -1.547 0.079
ROA 11,012 9.001 1.214 0.241
ROE 4,011 1.410 2.861 0.006*
NPM 6,921 1.211 6.108 0.000*
BOPO -1,012 61.011 -0.014 0.899
LDR -101.247 165.077 -0.327 0.541
Note: * Significant at α level of 5%
Source: Data Processed, 2015
EPS = -19.421+ 17,322BTM – 173,539CAR – 189,870ATTM + 11,012ROA + 4,011ROE + 6,921NPM – 1,012BOPO – 101,247LDR
Adjusted R values in Table 1 indicates that Book to Market, CAR, ATTM, ROA, ROE, NPM, ROA and LDR can explain 49% of EPS variation while the rest 51% is explained by other variables outside this research.
B. Significance test F:
Test results shows value of F significance 0.001. With value of Significance below 0.05. IT means the Book to Market, CAR, ATTM, ROA, ROE, NPM, ROA and LDR simultaneously have a significant effect on EPS. The worthy models meet Goodness of Fit condition.
c. Significance test t:
1. Effect of book to market ratio on EPS:
Book to market value analysis shows the value of regression coefficient has significance 0,003 and positive. Book to market ratio effect on EPS, it is seen from the significant value 0,003≤ 0.05. This shows that book to market ratio is a ratio that reflects the market value of a stock. Higher the book to market value means higher the EPS value of a company. It is supported by a study of Leong, Pagani, and Zaima (2009) who found a high book to market value ratio affect on EPS and high return. Prasetiono (2012) also shows positive effect book to market ration on portfolio return.
2. The effect of CAR on EPS:
CAR analysis shows the significance value of 0.001 with a regression coefficient is negative. CAR affect on EPS, this can be seen from the significant value of 0.001 ≤ 0.05. CAR is the ratio of financial related to banking capital where the amount of capital a bank will have an effect on whether or not a bank is able to efficiently carry out its activities. If the capital owned by bank is able to absorb losses that cannot be avoided, then the bank can manage its operations efficiently, so that wealth of bank (shareholder) is expected become increased and vice versa (Muljono, 1999).
3. Effect of Fixed Assets to Equity Ratio on EPS:
Analysis result show Fixed Assets to Equity Ratio indicate insignificant value of 0.079 with a regression coefficient is negative. Fixed Assets to Equity Ratio has no effect on EPS due to insignificant value of 0.079> 0.05. This result support Dahliawati Febrianto (2012) which states that ATTM has no effect on EPS. The higher Fixed Assets to Equity Ratio means of capital owned bank is insufficient to support the fixed assets, so that possibility of bank in greater problematic conditions.
4. Effect of ROA on EPS:
ROA analysis result show insignificant value of 0.079 at coefficient of 0.241 with a regression coefficient is positive. ROA has no effect on EPS. ROA is an asset for a profit turnaround. But for banking conditions to note that investors should be careful because the component containing the assets on balance sheets of risky assets given appropriate levels of credit risk to each asset item and credit risk inherent in each asset item by a conversion factor.
5. Effect on EPS ROE:
ROE analysis result show significance value of 0.006 with a regression coefficient is positive. ROE affect on EPS, this suggests that this study supports the research Kurniawan (2014) that ROE has an effect on EPS. ROE shows the efficiency usage of its own capital. The higher ratio shows that position of owner of company is getting stronger and got a rate higher profit shares.
6. Effect of NPM on EPS:
NPM analysis result shows the significance value of 0.000 with a regression coefficient is positive. NPM affect on EPS. NPM ratio has a positive correlation with net income, where the higher the value of this ratio indicates higher the net profit of company (Muljono, 1999). Research by Meythi (2005) stated that increase in NPM affect the increased profits earned by bank.
7. Effect of BOPO on EPS:
BOPO is the ratio between the total operating costs to total operating revenue. ROA analysis result shows significance value of 0.899 with a regression coefficient is negative. BOPO has no effect on EPS, due to significant value 0.899> 0.05. Results of this study is consistent with Bahtiar Usman (2003) which shows that all independent variables on CAMEL ratios showed no significant effect on bank profits.
LDR analysis result shows significance value of 0.541 with negative regression coefficient. LDR has no effect on EPS, it is evident from the significant value 0.541> 0.05. LDR has no effect on EPS because it illustrates how far the bank's ability to repay the withdrawal of funds by depositors by relying on loans as a source of liquidity. The higher this ratio gives indication of low capacity of bank's liquidity.
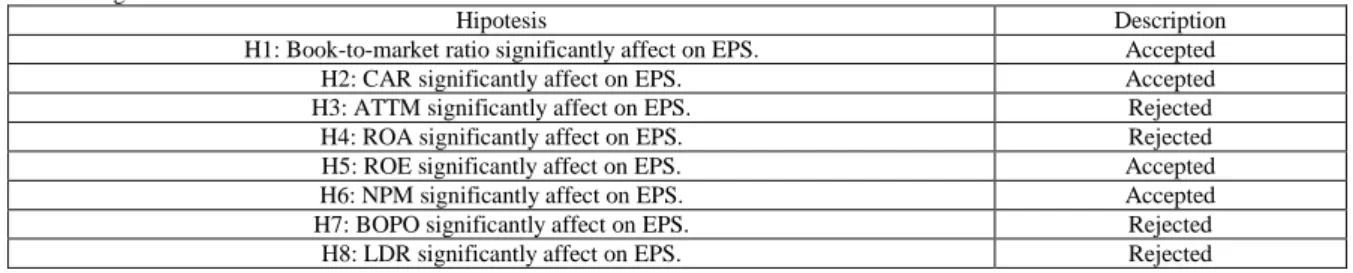
Table 2: Significance t test.
Hipotesis Description
H1: Book-to-market ratio significantly affect on EPS. Accepted
H2: CAR significantly affect on EPS. Accepted
H3: ATTM significantly affect on EPS. Rejected
H4: ROA significantly affect on EPS. Rejected
H5: ROE significantly affect on EPS. Accepted
H6: NPM significantly affect on EPS. Accepted
H7: BOPO significantly affect on EPS. Rejected
H8: LDR significantly affect on EPS. Rejected
Source: Data Processed, 2015
Conclusions And Suggestions:
Banking conditions in Indonesia is health in accordance with CAMEL ratio standards issued by BI. IFRS convergence impact on banking industry does not only happen in Indonesia, but also in European banking equally incorporated in G20 countries. Not all variables affect the financial performance of EPS. Variables that affect EPS are book to market, CAR, ROE, and NPM.
Limitations of this study is to only use the data banking companies listed on Stock Exchange in 2010 to 2014, thereby generalizing the results of study is limited to banks listed in Indonesia Stock Exchange in 2010 until 2014 that a member of research sample. Future research should use a sample of companies that more and longer time span so that more accurate test results.
REFERENCES
Ang, Robert, 1997. Buku Pintar Pasar Modal Indonesia. Jakarta: Mediasoft Indonesia.
Bahtiar Usman, 2003. Analisis Rasio Keuangan Dalam Memprediksi Perubahan Laba Pada Bank-Bank di Indonesia. Media Riset Bisnis dan Manajemen, 3(1): 59-74
Ball, Ray, 2005. International Financial Reporting Standards (IFRS): Pros and Cons for Investors. Diunduh dari www.papers.ssrn.com/sol3/papers.cfm? abstract_id=929561.
Budiono, Stephanie and Tantri Baroroh, Lilik Pirmaningsih, 2015. Analisis Pengaruh Book To Market ratio Dan Rasio Camel Terhadap Kinerja Keuangan Industri Perbankanyang Terdaftar di BEI Pada Periode Sebelum dan Sesudah Konvergensi IFRS. Universitas Wijaya Kusuma: Tesis tidak dipublikasikan
Barth, 2006. International Accounting Standards and Accounting Quality. Diunduh dari Journal of Accounting Research, 46:467-498.
Dahliawati, A., M.M. Dan Febrianto, 2012. Analisis Pengaruh Capital Adequency Ratio (CAR) dan
Aktiva Tetap Terhadap Profitabilitas (ROA) Pada PT Bank “X Syariah Periode 2009- 2011. Diunduh dari
http://download.portalgaruda.org.
Damodaran, Aswath, 2012. Investment Valuation Tools and Techniques for Determining The Value Of Any
Asset. Second Edition. Germany: Willey Finance.
Darusman, Dery, 2012. Analisis Pengaruh Firm Size, Book to Market, Price Earning Ratio, dan Momentum Terhadap Return Portofolio Saham. Diunduh dari http://eprints.undip.ac.id.
Dendawijaya, Lukman, 2009. Manajemen Perbankan. Edisi Kedua. Jakarta: Ghalia Indonesia.
Dewi, P.D.A., I.G.N.A. Dan Suaryana, 2013. Pengaruh EPS, DER, dan PBV Terhadap Harga Saham. Diunduh dari e-Jurnal Akuntansi Universitas Udayana.
Ewert, R., A. Wagenhofer, 2005. Economic Effects of Tightening Accounting Standards to Restrict Earnings Management. Diambil dari The Accounting Review, halaman, 1101–1124.
Fitriati, I.R., 2010. Analisis Hubungan Distress Riskm Firm Sizem dan Book To Market Ratio Dengan Return Saham. Diunduh dari http://eprints.undip.ac.id.
Hanafi, M.H. Dan A. Halim, 2000. Analisis Laporan Keuangan. Yogyakarta: AMK YKPN. Harahap, S.S., 2007. Analisis Kritis Atas Laporan Keuangan. Jakarta: PT Raja Grasindo Persada.
Institut Bankir Indonesia, 1999. Kamus Perbankan Indonesia. Jakarta: Institut Bankir Indonesia. Jakarta: Djambatan.
Kasmir, 2011. Manajemen Perbankan. Edisi Revisi. Jakarta: PT Raja Grafindo Persada.
Kementrian Keuangan Republik Indonesia, 2012. Mengukur Implementasi Reformasi Regulasi Finansial di G20. Diunduh dari www.kemenkeu.go.id.
Muljono, Teguh Pudjo,1999. Analisa Laporan Keuangan untuk Perbankan.
Munawir, S. ,2004. Analisa Laporan Keuangan. Edisi Keempat. Yogyakarta: Liberty.
Nugrohadi, A.P., E.N.A. Dan Yuyetta, 2014. Implementasi IFRS Terhadap Kinerja Keuangan. Diunduh dari http://ejournals1.undip.ac.id.
Prasanjaya, Yogi Dan I.W. Ramantha, 2013. Analisis Pengaruh Rasio CAR, BOPO, LDR, dan Ukuran
Perusahaan terhadap Profitabilitas Bank yang Terdaftar di BEI. Diunduh dari E-Jurnal Akuntansi
Universitas Udayana. ISSN 2302-8556, 4(1).
Prasetiono, D.D., 2012. Analisis Pengaruh Firm Size , Book to Market Ratio, Price Earning Ratio, dan Momentum Terhadap Return Portofolio Saham. Universitas Diponegoro. Journal of Management, 1: 212-225.
Rachmadhani, Rachmat, 2006. Analisis Faktor – Faktor yang Mempengaruhi Permodalan Bank. Diunduh dari www.academia.edu
Samsul, M., 2006. Pasar Modal dan Manajemen Portofolio. Jakarta: Erlangga.
Sari, E.K., H.I.G. Dan Ghozali, 2011. Analisis Pengaruh CAR, NPL, BOPO, NIM, LDR, dan Pemenuhan PPAP Terhadap Kinerja Perbankan (Studi Kasus Pada Bank Umum di Indonesia). Diunduh dari e-Jurnal Akuntansi Universitas Diponegoro.
Sianipar, G.A.E.M., Dan Marsono, 2013. Analisis Komparasi Kualitas Informasi Akuntansi Sebelum
dan Sesudah Pengadopsian Penuh IFRS di Indonesia. Diunduh dari
http://eprints.undip.ac.id/39684/1/SIANIPAR.pdf.
Sugiono, A., 2009. Manajemen Keuangan untuk Praktisi Keuangan. Jakarta: Grasindo.
Susanto, Y.K., F.N. Dan Njit, 2012. Penentu Kesehatan Perbankan. Diambil dari Jurnal Bisnis dan Akuntansi, 14(2): 105-116.