5
VIII
August 2017
International Journal for Research in Applied Science & Engineering Technology (IJRASET)
ISSN: 2321-9653; IC Value: 45.98; SJ Impact Factor:6.887 Volume 5 Issue VIII, August 2017- Available at www.ijraset.com
A Robust Approach for the Assessment of
Upgraded Random Forest and Decision Stump
Classification Algorithms in Data Mining System
K. Thulasiram1, S. Ramakrishna2
1Research Scholar, 2Professor, Department of Computer Science, Sri Venkateswara University,
Abstract: Data mining is a process to extract information from database which is critic but has possible value. Data mining techniques comprise of association, classification, prediction, clustering etc. Classification algorithms are used to classify huge volume of data and deliver exciting results. It is a novel data analysis technology and has extensively useful in the areas of finance, insurance, government, transport and national defense. Data classification is an essential part in data mining and the classification process holds various approaches. The common classification model contains decision tree, neutral network, genetic algorithm, rough set, statistical model, etc. In this research we have proposed and deliberated a new algorithm namely Upgraded Random Forests, which is applied for the classification of hyper spectral remote sensing data. Here we consider them for classification of multisource Sensor Discrimination data. The Upgraded Random Forest approach becomes a great attention for multisource classification. The methodology is not only nonparametric but it also delivers a way of estimating the significance of the individual variables in the classification.
Keywords: Data Mining, Classification, Random Forest, Upgraded RF, Decision Stump and Naïve Bayes, etc.
I. INTRODUCTION
The advent of Data Mining is facilitated the extraction of significant data from large volume of raw data. However in recent years, this field has gained lot of attention by research schools and industries. Data mining has shown its applicability in various domains such as transportation, health care, education and many more. It makes use of various classifications algorithms, clustering and association techniques. There are various classification algorithms that are utilized by data mining and these include Decision Tree, Neural Networks, K-Nearest Neighbor and many more [2]. It has shown tremendous growth the last few years and already proven analytical capabilities in various fields like, Retail: Market Basket Analysis, Customer Relationship Management (CRM), Medical Domain, Health Care Sector, Web Mining, Telecommunication Sector, Bioinformatics and Finance. DM techniques have a wide scope of applicability in the field of disease diagnosis and prognosis and hidden biomedical and health care patterns. The KDD process includes selection of relevant data; it’s processing, transforming processed data into valid information and then extracting hidden information/pattern from it [6, 8]. The KDD process can be categorized as:
A. Selection
It includes selecting data relevant for the task of analysis from the database.
B. Pre-Processing
In this phase we remove noise and inconsistency found in data and combine multiple data sources.
C. Transformation
In this phase transformation of data takes place into appropriate forms to perform mining operations.
D. Data Mining
This phase includes applying data mining algorithm appropriate for extracting patterns.
E. Interpretation/Evaluation
International Journal for Research in Applied Science & Engineering Technology (IJRASET)
ISSN: 2321-9653; IC Value: 45.98; SJ Impact Factor:6.887 Volume 5 Issue VIII, August 2017- Available at www.ijraset.com
II. LITERATURE REVIEW ON CLASSIFICATION ALGORITHMS A. Classification
Classification techniques are supervised learning methods are most widely used tin data mining to classify the data in raw data, a value is assigned to each item in set of data to group them in a class ,these classifier models are mathematical techniques which are used to classify the data [5,7]. Classification techniques as decision tree, Bayesian classification, neural networks, support vector machine, association based classification.
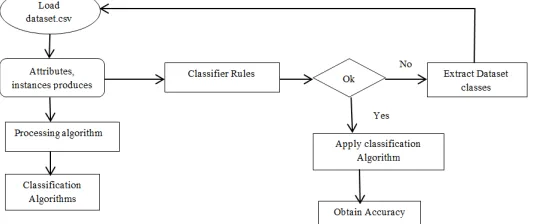
[image:3.612.174.441.206.318.2]There are several algorithms for data classification such as Random Forest, J48, Naïve Bayes and Decision Stump classifiers [9,11]. With classification, the structural model shown in Figure: 1 can be designed and applied algorithms for their process.
Fig. 1 Procedure and Approach of the Implementation of Algorithm
1) Random Forest Algorithm: The Random Forest classification algorithm creates multiple CART-like trees, each trained on a bootstrapped sample of the original training data. The output of the classifier is determined by a majority vote of the trees. In training, the Random Forest algorithm searches only across a randomly selected subset of the input variables to determine a split. The number of variables is a user-defined parameter (often said to be the only adjustable parameter in Random Forest), but the algorithm is not sensitive to it. The default value is set to the square root of the number of inputs [4]. By limiting the number of variables used for a split, the computational complexity of the algorithm is reduced, and the correlation between trees is also decreased. Finally, the trees are not pruned, further reducing the load.
2) J48: J48 is an open source Java application of the C4.5 algorithm. In order to classify a new item, it first wants to generate a decision tree based on the attribute values of the existing training data [1]. So, whenever it meets a set of items (training set) it recognizes the attribute that classifies the several instances most clearly. This feature that is able to tell us most about the data instances so that we can classify them the best is said to have the highest information gain [12,13]
3) Naïve Bayesian: The Naïve Bayesian classifier is based on Bayes’ theorem with independence assumptions between predictors. Bayesian reasoning is applied to decision making and inferential statistics that deals with probability inference. It is used the knowledge of prior events to predict future events [3]. It builds, with no complicated iterative parameter estimation which makes it particularly useful for very large datasets. Bayes theorem offers the way of computing the posterior probability, P(c|x), from P(c), P(x), and P(x|c) .Naive Bayes classifier accept that the effect of the value of a predictor(x) on a given class(c) is independent of the values of other predictors. This assumption is called as class conditional independence.
P(c/x) =
( )
( )
P(c/x) is the posterior probability of class (target) given predictor (attribute). P(c) is the prior probability of class.
P(x/c) is probability of predictor specified class. P(x) is the prior probability of predictor class.
4) Decision Stump: Let x = (x1, x2, …, xn)
Decision Stump hi,t If xi≥ t then class =1 else class = −1
International Journal for Research in Applied Science & Engineering Technology (IJRASET)
ISSN: 2321-9653; IC Value: 45.98; SJ Impact Factor:6.887 Volume 5 Issue VIII, August 2017- Available at www.ijraset.com
5) Algorithm: For each xi in the training set: Step 1: Sort values then eliminate replicas.
Step 2: Build candidate thresholds t below min value, above max value and midway between successive features Step 3: For every hi,t, calculate error on training set.
Step 4: Return hi,t that maximizes .
| − ℎ, |
Run Adaboost for T iterations, with L being the decision-stump learning algorithm is defined.
Step 5: Decision stump ht is learned using training data designated from current dissemination at time t. Coefficient αt is consideredby running ht on all training data.
Step 6: If a decision stump using feature xi is preferred on iteration, eliminate it from group of features for the following iteration. Step 7: Finally, next T iterations, run ensemble classifier H on experiment data.
III. PROPOSED METHODOLOGY A. Tree Selection Method
The significant problem of tree selection technique is how to estimate the accuracy of every tree. We used the out-of bag accuracy as a measure to estimate the rank of a tree. In the random forest building model proposed by Breiman, the bagging method is used to make a sequences of training data subsets, which are then used these training subsets to construct trees. In every tree, the training data subset used to produce the tree is called in-of-bag (IOB) data, and the data subset molded by the remaining data is called out-of-bag (OOB) data. Since OOB data is not used to construct trees, it can be used to test the OOB accuracy of each tree and moreover, this OOB accuracy can be used to estimate the importance of the tree. Given a tree classifier hk(IOBk) constructed from the kth training data subset IOB
k and assuming there are n instances in the whole training dataset D. For each di∈D, we explain the OOB accuracy of the tree hk(IOBk) as
= ( ( ) ; ∈ )
( ∈ ) …………(1)
Where I(.) is an indicator function. According to formula (1), the larger the OOBAcck is, the better a tree is. We then sort all the trees by the descending order of their OOB accuracies, and select the top ranking 80% trees to build the random forest. Such tree selection process can generate a population of “good” trees.
B. Upgraded Random Forest Algorithm 1) Input
D: the training data set,
A: the feature space {A1, A2,...,AM}, Y: the feature space {y1, y2,...,yq}, K: the number of trees,
m: the size of subspaces.
2) Output: An Upgraded Random Forest
3) Technique:
Step 1: for i=1 to K do
Step 2: draw a bootstrap sample in-of-bag data subset IOBi and out-of-bag data subset OOBi from the training data set D; Step 3: hi(IOBi) = createTree(IOBi);
Step 4: create a new node η using createTree( ); Step 5: if stopping criteria is met then
Step 6: return η as a leaf node; Step 7: else for j=1 to j=M do
Step 8: compute the informativeness measure corr(Aj,Y) by Equation (1); Step 9: end for
Step 10: compute feature weights {w1, w2,...,wM};
Step 11: use the feature weighting method to randomly select m features;
International Journal for Research in Applied Science & Engineering Technology (IJRASET)
ISSN: 2321-9653; IC Value: 45.98; SJ Impact Factor:6.887 Volume 5 Issue VIII, August 2017- Available at www.ijraset.com
Step 13: call createTree() for each split; Step 14: end if
Step 15: return η;
Step 16: use out-of-bag data subset OOBi to calculate the out-of bag accuracy OOBAcci of the tree classifier hi(IOBi) by Equation; Step 17: end for
Step 18: sort all K trees classifiers in their OOBAcc descending order;
Step 19: select the top 80% trees with high OOBAcc values and combine the 80% tree classifiers into an upgraded random forest μ; Function createTree first creates a new node. Then, it tests the stop criteria to decide whether to return to the upper node or to split this node. If splitting this node, it uses the feature weighting method to randomly select m features as a subspace for node splitting. These features are used as candidates to produce the best split to partition the node. For each subset of the partition, createTree is called again to create a new node under the current node. If a leaf node is created, it returns to the parent node. This recursive process continues until a full tree is generated. Compared with Breiman’s method, there are two changes for building an upgraded random forest model. The first change is the way to select the feature subspace at each node. Breiman uses simple random sampling method. For very high dimensional image data, the subspace must be set large in order to contain informative feature. This will increase computation burden. With the feature weighting method, we can still use Breiman’s formula |log2 (M) +1| to specify the subspace size. The second change is that tree selection method is added. This method is further optimizing upgraded random forest model.
In this algorithm, input parameters are the training data set, the feature space, the class feature, the number of trees in the random forest and the size of subspaces. The output is an Upgraded Random Forest model. The classification algorithm development is described with steps below.
Steps 1-5 are the loop for building K decision trees. In the loop, Steps 2-9 samples the training data with the bootstrap method to generate an in-of-bag data subset for building a tree classifier, and generate an out-of-bag data subset for testing the tree classifier on out-of-bag accuracy. Steps 10-15 calls the recursive function createTree() to build a tree classifier. Steps 16-17 uses out-of-bag data subset to calculate the out-of-bag accuracy of the tree classifier. Step 5 after the loop, Step 18 sorts all built tree classifiers in their out-of-bag accuracies descending order. Step 19 selects the top 80% trees with high out-of-bag accuracy values and combines the 80% tree classifiers into an Upgraded Random Forest model. In practice, 80% is sufficiently enough to achieve good results.
IV. EXPERIMENTAL RESULTS
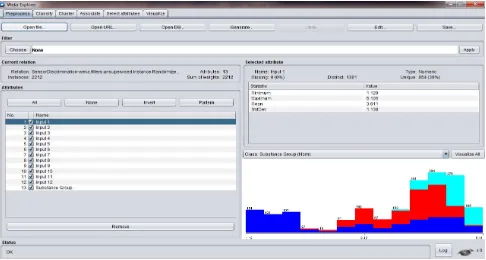
[image:5.612.185.428.587.717.2]In this experiment we used WEKA as a data mining tool to classify data, analyze and determining the prediction accuracy of different data mining algorithms. In this experiment the accuracy of different algorithms has been analyzed and we designed a new algorithm called Upgraded Random Forest, it is the best suitable algorithm having better classification accuracy. In this research work, authors have suggested the techniques which are best suited to predict classes of cases given in Sensor Discrimination dataset using classification accuracy of the proposed algorithm. The experiment has been conducted with Sensor Discrimination dataset available on UC Irvine Machine Learning Repository. Authors have implemented various classification algorithms on this dataset using WEKA tool [10], developed by Machine Learning Group at the University of Waikato. The dataset used for analysis purpose having total 2212 instances and 12 attributes and one class attribute. Authors have implemented various algorithms using data mining tool for experimental analysis purpose. The experimental result with the dataset is as follows.
International Journal for Research in Applied Science & Engineering Technology (IJRASET)
[image:6.612.180.433.90.278.2]ISSN: 2321-9653; IC Value: 45.98; SJ Impact Factor:6.887 Volume 5 Issue VIII, August 2017- Available at www.ijraset.com
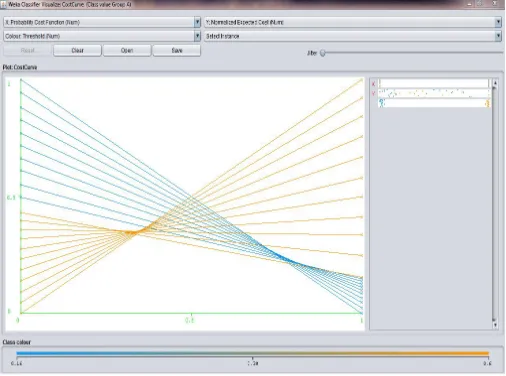
Fig. 3 Visualize Cost Curve using Decision Stump Algorithm
Fig. 4 Result of the Decision Stump Algorithm with Sensor Discrimination Dataset
International Journal for Research in Applied Science & Engineering Technology (IJRASET)
[image:7.612.182.430.90.229.2]ISSN: 2321-9653; IC Value: 45.98; SJ Impact Factor:6.887 Volume 5 Issue VIII, August 2017- Available at www.ijraset.com
[image:7.612.67.540.260.717.2]Fig. 6 Visualize Cost Curve using Upgraded Random Forest Algorithm
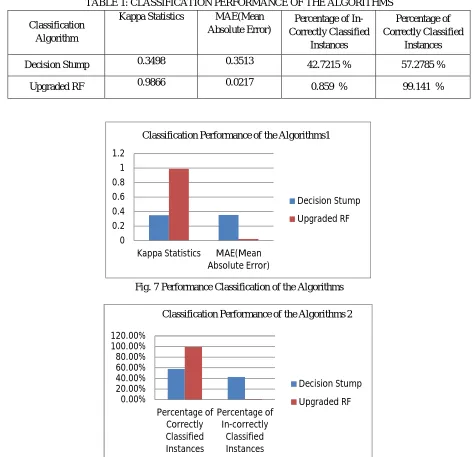
TABLE 1: CLASSIFICATION PERFORMANCE OF THE ALGORITHMS
Classification Algorithm
Kappa Statistics MAE(Mean
Absolute Error)
Percentage of In-Correctly Classified
Instances
Percentage of Correctly Classified
Instances
Decision Stump 0.3498 0.3513 42.7215 % 57.2785 %
Upgraded RF 0.9866 0.0217 0.859 % 99.141 %
Fig. 7 Performance Classification of the Algorithms
Fig. 8 Performance Classification of the Algorithms 0 0.2 0.4 0.6 0.8 1 1.2
Kappa Statistics MAE(Mean Absolute Error)
Classification Performance of the Algorithms1
Decision Stump Upgraded RF 0.00% 20.00% 40.00% 60.00% 80.00% 100.00% 120.00% Percentage of Correctly Classified Instances Percentage of In-correctly Classified Instances
Classification Performance of the Algorithms 2
Decision Stump
International Journal for Research in Applied Science & Engineering Technology (IJRASET)
ISSN: 2321-9653; IC Value: 45.98; SJ Impact Factor:6.887 Volume 5 Issue VIII, August 2017- Available at www.ijraset.com
V. CONCLUSION
In this paper we have analyzed the impact of decision tree algorithms that which are trained on the Sensor Discrimination dataset from the UCI Machine Learning Repository. We have evaluated the performance of decision tree classification algorithms on the dataset and compared the accuracies of the same. The experimental results demonstrated that our Upgraded Random Forests generated with proposed method indeed reduced the generalization error and improve test accuracy classification performance. The Upgraded Random Forest classification algorithm creates multiple CART-like trees, each trained on a bootstrapped sample of the original training data. The output of the classifier is determined by a majority vote of the trees. This is combined with the fact that the random selection of variables for a split seeks to minimize the correlation between the trees in the ensemble, results in error rates that have been compared while being much lighter. Also the computation time is recorded to bring out the efficiency of the classifier. The accuracy measures of Decision Stump in the classification performance is 57.2785 %, this is very less. But our Proposed Upgraded Random Forest algorithms are evaluated using 10 folds cross validation. Our findings suggest with necessary results that the Upgraded Random Forest decision tree algorithm generates 99.141% accuracy in classification with least computational complexity.
REFERENCES
[1] Gaganjot Kaur “Improved J48 Classification Algorithm for the Prediction of Diabetes” International Journal of Computer Applications (0975 – 8887) Volume 98 – No.22, July 2014.
[2] G.J. Briem, J.A. Benediktsson, J.R. Sveinsson. “Multiple Classifiers Applied to Multisource Remote Sensing Data.” IEEE Trans. On Geoscience and Remote Sensing. Vol. 40. No. 10. October 2002.
[3] G. Subbalakshami et al., “Decision Support in Heart Disease System using Naïve Bayes”, IJCSE, Vol. 2 No. 2, pp. 170-176, ISSN: 0976-5166, 2011. [4] L. Breiman, “Random Forests,” Machine Learning, Vol. 40. No. 1. 2001.
[5] R. Duda, P. Hart and D. Stork. Pattern Classification, 2nd edition. John Wiley, New York, 2001.
[6] S. Ramya , Dr. N. Radha, “Diagnosis of Chronic Kidney Disease Using Machine Learning Algorithms”, International Journal of Innovative Research in Computer and Communication Engineering, pp. 812-820 Vol 4, issue 1, ISSN: 2320-9798, 2016.
[7] S. J. Preece, J. Y. Goulermas and L. P. J. Kenney, “A comparison of feature extraction methods for the classification of dynamic activities from accelerometer data,” IEEE Trans. Biomed. Eng., vol. 56, no. 3, pp. 871–879, Mar. 2009.
[8] S. Liu, R. Gao, D. John, J. Staudenmayer, and P. Freedson, “Multi-sensor data fusion for physical activity assessment,” IEEE Transactions on Biomedical Engineering, vol. 59, no. 3, pp. 687-696, March 2012.
[9] Sunil Joshi and R. C. Jain., “A Dynamic Approach for Frequent Pattern Mining Using Transposition of Database”, In proc of Second International Conference on Communication Software and Networks IEEE., p498-501. ISBN: 978-1-4244-5727-4, 2010.
[10] T. Garg and S.S Khurana, “Comparison of classification techniques for intrusion detection dataset using WEKA,” In IEEE Recent Advances and Innovations in Engineering (ICRAIE), pp. 1-5, 2014.
[11] V.Karthikeyani, “Comparative of Data Mining Classification Algorithm (CDMCA) in Diabetes Disease Prediction” International Journal of Computer Applications (0975 – 8887) Volume 60– No.12, December 2012.
[12] Dr.K.Suresh Kumar Reddy, Dr.M.Jayakameswaraiah, Prof.S.Ramakrishna, Prof.M.Padmavathamma, “Development Of Data Mining System To Compute The Performance Of Improved Random Tree And J48 Classification Tree Learning Algorithms”, International Journal of Advanced Scientific Technologies, Engineering and Management Sciences (IJASTEMS), Volume.3, Special Issue.1, Page 128-132, ISSN: 2454-356X, March 2017.