R E S E A R C H
Open Access
Impairment of renal function using hyperoncotic
colloids in a two hit model of shock: a
prospective randomized study
Tim Philipp Simon
1*, Tobias Schuerholz
1, Lars Hüter
2, Michael Sasse
3, Florian Heyder
3, Wolfgang Pfister
4and
Gernot Marx
1Abstract
Introduction:One of the therapeutic essentials in severe sepsis and septic shock is an adequate fluid replacement to restore and maintain circulating plasma volume, improve organ perfusion and nutritive
microcirculatory flow. The type of solution to be used as a fluid replacement remains under discussion. The aim of the study was to evaluate the effects of clinically used fluid replacement solutions on renal function and inflammatory response.
Methods:A total of 23 anesthetized and ventilated female German Landrace pigs were investigated over 19 hours using a two-hit model that combined hemorrhagic and septic shock. The septic shock was induced using an Escherichia coliladen clot placed into the abdominal cavity. Infusions of 6% hydroxyethylstarch 130/0.42 in acetate (6% HES 130), 4% gelatin in acetate (4% gelatin) and 10% hydroxyethylstarch 200/0.5 in saline (10% HES200) compared to Ringer’s acetate (RAc) were used for fluid replacement to maintain a central venous pressure of 12 mmHg. Ringer’s acetate was also used in the sham-treated group (SHAM).
Results:At study end the cardiac output (10% HES200 143 ± 48 ml/kgBW; 6% HES130 171 ± 47 ml/kgBW; RAc 137 ± 32 ml/kgBW; 4% gelatin 160 ± 42 ml/kgBW), as well as mean arterial pressure did not differ between groups. N-acetyl-beta-D-glucosamidase was significantly higher in the hydroxyethylstarch 200 (157 ± 115 U/g creatinine;P< 0.05) group compared to hydroxyethylstarch 130 (24 ± 9 U/g creatinine), Ringer’s acetate (2 ± 3 U/g creatinine) and SHAM (21 ± 15 U/g creatinine) at the study’s end. Creatinine significantly increased by 87 ± 84 percent of baseline in the 10% HES200 group compared to RAc and 6% HES130. We demonstrated in the histology of the kidneys a significant increase in osmotic-nephrosis like lesions for 4% gelatin compared to RAc, 6% HES130 and SHAM. Urine output was lowest in the 10% HES200 and 4% gelatin group, however not significantly.
Interleukin(IL)-6 levels were significantly elevated in the 10% HES200 group (3,845 ± 1,472 pg/ml) two hours after sepsis induction compared to all other groups (6% HES130 1,492 ± 604 pg/ml; RAc 874 ± 363 pg/ml; 4% gelatin 1,623 ± 1,242 pg/ml).
Conclusions:Despite similar maintenance of macrocirculation 6% hydroxyethylstarch 130/0.42 and Ringer’s acetate significantly preserve renal function and attenuate tubular damage better than 10% hydroxyethylstarch 200/0.5 in saline.
* Correspondence: [email protected]
1
Department of Intensive Care and Intermediate Care, RWTH University Hospital Aachen, Pauwelsstrasse 30, 52074 Aachen, Germany Full list of author information is available at the end of the article
Introduction
In severe sepsis and septic shock, adequate fluid replace-ment is one of the essential therapeutic requirereplace-ments to restore and maintain circulating plasma volume in order to improve organ perfusion and nutritive microcircula-tory flow [1]. It has been shown that early goal-directed fluid resuscitation in patients with severe sepsis and sep-tic shock is associated with improved outcome [2]. Recently, updated international guidelines indicate that there is no robust evidence favoring either colloids or crystalloids for fluid replacement in patients with sepsis or septic shock [3].
The question of which type of solution to use as a fluid replacement remains controversial [4]. In Europe, mostly artificial colloid solutions are used on the basis of gelatin and hydroxyethyl starches (HES). Adverse effects of col-loid administration on renal function have spurred ongoing research into the pathological mechanisms [5].
In critical ill patients, acute renal dysfunction fre-quently deteriorates to renal failure due to hypovolemia, hypoxia, hypoperfusion and toxicity of drugs (for exam-ple, anti-infectives), as well as endothelial damage indu-cing pro-inflammatory response finally resulting in organ dysfunction. Thus, the evaluation of colloid asso-ciated effects in this context is difficult. Interestingly, the data on gelatin are limited.
Schortgen and colleagues showed that in severe sepsis and septic shock patients, there was no survival benefit and a higher rate of renal failure when using 6% HES 200/0.6-0.66 as compared to gelatin [6]. The negative impact of 10% HES 200/0.5 as compared to modified Ringer’s lactate (RL) on renal function in severe septic/ septic shock patients was also demonstrated in a recent randomized VISEP (efficacy of fluid substitution and insulin therapy in severe sepsis) trial [7].
A large prospective observational study including over 3,000 critically ill patients showed that in a length of ICU stay of more than 24 hours, sepsis, heart failure and haematological cancer were all significantly asso-ciated with the need for dialysis or haemofiltration ther-apy, but fluid replacement with HES was not [8].
So far, almost all colloids are dissolved in 0.9% NaCl or in 5% glucose. The use of these colloids may be asso-ciated with undesirable electrolyte disturbances or even acid-base derangements [9]. In experimental septic shock, fluid resuscitation using a balanced HES prepara-tion resulted in significantly improved survival as com-pared with saline-based resuscitation [10].
Recent developments include the introduction of new formulations and newly available HES and gelatin pro-ducts. HES in acetate with a low molecular weight (130 kD) and other balanced solutions have been developed. The profiles of these solutions appear to be useful for
clinical situations where large amounts of fluid replace-ment solutions are administered [11].
Previously, we found that 10% HES 200/0.5 was asso-ciated with a significantly elevated inflammatory response in tubular monocytes. This pronounced pro-inflammatory effect of 10% HES 200/0.5 compared with 6% HES 130/0.42 caused more tubular damage than 6% HES 130/0.42 and RL [12].
Based on our ex vivo experiment we investigated effects of fluid solutions on renal function and inflam-matory response in a porcine two-hit model that com-bines hemorrhagic and septic shock. We selected the commonly used balanced solutions 6% HES 130/0.42 in RAc and 4% modified gelatin in RAc, 10% HES 200/0.5 in 0.9% NaCl compared to Ringer’s acetate (RAc).
Materials and methods Animals
Female German Landrace pigs (n= 23; mean 28.1 ± 1.7 SD kg body weight (BW)) were used and standard proce-dures for laboratory animal care were followed. This study was approved by the institutional and local com-mittee on the care and use of animals (Thüringer Lande-samt für Lebensmittelsicherheit und Verbraucherschutz, Bad Langensalza, Germany).
General anesthesia and surgical procedures
Animals were premedicated via intramuscular adminis-tration of ketamin and midazolam. Thereafter, general anesthesia was induced by intravenous injection of pro-pofol (3 to 4 mg/kg BW) and the animals were orally intubated and placed in the supine position. General anesthesia was maintained with an infusion of propofol and sufentanil. Controlled pressure mode ventilation was chosen to ventilate the animals with an inspiratory oxy-gen fraction of 0.4, an inspiratory/expiratory ratio of 1:2, positive end-expiratory pressure (PEEP) set to 5 and a tidal volume of 8 to 10 ml/kg BW. Respiratory rate was set with the aim to maintain a PaCO2of 35 to 46 mmHg.
The core body temperature was kept at above 37.5°C with the use of a warming blanket. A transpulmonary thermodilution catheter, central venous line and the pul-monary artery catheter were placed as we described in detail in former papers [4]. None of the infusion systems were heparinized. In all animals, a midline laparotomy was performed and the left renal artery was exposed and a Transonic Doppler flow probe (Transonic Systems, Ithaca, NY, USA) was placed around the vessel to mea-sure blood flow of the left renal artery (RBF).
Escherichia coli fibrin clot
forming units (CFU) per kg/BW. The clot was made from a sterile solution of porcine fibrinogen (Sigma-Aldrich Inc., St. Louis, MO, USA) (final volume was adjusted to the pig’s weight). The clot was formed by adding thrombin from bovine plasma to the fibrinogen and E. coli solution and incubating for 30 minutes at room temperature.
Hemodynamics
All intravascular pressure measurements were refer-enced to mid-chest level and values were obtained at end expiration. Mean arterial pressure (MAP), central venous pressure (CVP), mean pulmonary artery pressure (MPAP) and pulmonary artery occlusion pressure (PAOP) were recorded from calibrated pressure transdu-cers (Edwards Lifesciences, Irvine, CA, USA) and values obtained at end-expiration.
Intrathoracic blood volume (ITBV) was calculated by the mean transit time approach (transpulmonary thermo dilution technique) using a PiCCO® System (PULSION Medical Systems SE, Munich, Germany).
Cardiac output (CO) was determined by thermodilu-tion with a CO computer (Vigilance®; Edwards Life-sciences Ltd, Newbury, UK).
Systemic oxygen delivery (DO2), oxygen extraction
ratio (OE) and consumption (VO2) were calculated from
hemoglobin, oxygen saturation, PaO2and cardiac output
according to standard formulae.
Laboratory
Blood gas analyses were measured using a standard blood gas oximetry system (ABL 625; Radiometer, Copenhagen, Denmark) with a co-oximeter. Sodium, potassium, chloride, creatinine and hematocrit (Hct) were determined using standard laboratory techniques. We calculated the anion gap with the formula: anion gap = ((Na+)+(K+))-((Cl-)+(HCO3-)).
Colloid osmotic pressure (COP) was analyzed using a membrane colloid oncometer with a 20 kD semi-perme-able membrane (BMT 921, Delta-Pharma, Pfullingen, Germany). From urine specimen, N-acetyl- beta-D-glu-cosamidase (NAG; analyzed by a spectrophotometric method; Hoffmann-La Roche, Basel, Switzerland), an approved sensitive marker of lysosomal tubular damage [10], was measured. Creatinine clearance was measured as an estimate of glomerular filtration rate (ClCrea = Ucrea × Uvol/Pcrea × duration of urine collection per-iod; where Ucrea = urine creatinine concentration; Uvol = urine volume during the collection period; Pcrea = serum creatinine concentration). The duration of urine collection period was 240 minutes.
Cumulative fluid balance was calculated as fluid input minus urinary output during the entire study period.
Body weight of animals was measured directly before experimentation.
Flowmetry
Left renal arteries were identified close to their origins at the aortas. A pre-calibrated ultrasonic transit time flow probe (Transonic Systems Inc., Ithaca, NY, USA) was placed around the vessels and connected to an ultrasound blood flow meter (T207; Transonic Systems Inc.).
Cytokines
Levels of interleukin 6 (IL-6), interleukin 10 (IL-10) and tumor necrosis factor alpha (TNF-a) in plasma were assessed by an enzyme-linked immunosorbent assay using commercially available kits specific for pigs (IL-6; IL-10; TNF-a: BioSource, Solingen, Germany). Measure-ments were made according to the manufacturer’s guidelines and blood samples were collected additionally two and four hours after sepsis induction.
Histological analysis
Biopsies of the kidney were taken directly after euthana-sia of the animals, fixed in 4% formaldehyde and embedded in paraffin. Sections (4 μm) were cut and stained with hematoxylin and eosin (H&E). Renal mor-phology was assessed semiquantitatively using the fol-lowing four criteria of tubulointerstitial renal injury: acute tubular necrosis (ATN), that is, dilatation of tubuli with flattening or loss of the tubular epithelium, intersti-tial bleeding (IBl), glomerulo sclerosis (GSl) and osmo-tic-nephrosis like lesions (OL) of the tubuli (see also Additional files 1, 2, 3). One experienced investigator blinded to the groups scored each variable using a semi-quantitative scoring system (0 to 4) for each criterion in 20 randomly sampled visual fields per animal: 0 (absent), 1 (0 to 25%), 2 (25 to 50%), 3 (50 to 75%) or 4 (more than 75%) [10].
Experimental protocol
AG, Bernburg, Germany) (n= 5), 10% HES with a mole-cular weight of 200 kD and a molar substitution of 0.5 in 0.9% sodium chloride (HES 200) (Infukoll®, Serum-werke Bernburg AG AG, Bernburg, Germany) (n = 5), compared to a non-shock, sham-operated control group (SHAM,n = 3) receiving RAc. Fluid replacement was performed while maintaining baseline MAP for six hours. In addition, four hours after cessation of the hemorrhagic shock, the blood collected during hemor-rhagic shock was retransfused.
Six hours after hemorrhagic shock, the infected clot was placed into the abdominal cavity to induce septic shock. SHAM group received a non-infected clot.
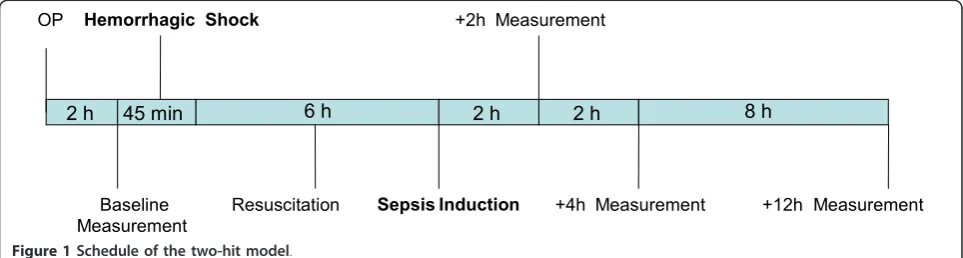
Two hours after the induction of septic shock, the hemodynamic treatment scheme aimed at maintaining a CVP of 12 mmHg was initiated. Fluid therapy during this second shock was the identical randomized solution that was administered during hemorrhagic shock; hence, each animal received only one study solution. CVP was measured continuously and a gradual continuous fluid resuscitation was carried out. After induction of sepsis, animals were treated for another 12 h. Measurements were performed at baseline, before induction of septic shock (6 h after resolution of hemorrhagic shock) and 12 h after induction of septic shock (Figure 1).
Statistical analysis
Data were analyzed using SPSS 16.0 for Windows (IBM Statistics, Ehningen, Germany) and all results are pre-sented as mean ± standard deviation (SD). After verify-ing normal data distribution (skewness < 1.5) [13], effects of fluid replacement solution were statistically analyzed by analysis of variance (ANOVA) for repeated measurements. Bonferroni’s correction was applied for multiple comparisons, following ANOVA for each single time point. Differences were considered significant at P < 0.05. Data are presented at baseline (BL), 6 h after hemorrhagic and before septic shock (SL) and 12 h after sepsis induction (12 h sepsis).
A three-fold increase in beta-NAG was regarded as clinically relevant. A total sample size of at least 23
animals was necessary in order to achieve a power of at least 80%.
Results
In all animals, study protocol was completed. All ani-mals reached the predefined target in hemorrhagic shock and fluid resuscitation. There were no differences in blood loss between the groups.
Hemodynamics
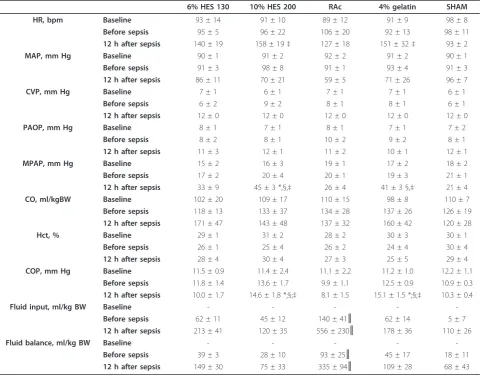
Hemodynamic parameters are summarized in Table 1. Baseline values were comparable in all groups. Twelve hours after sepsis induction CO, as well as MAP, CVP and PAOP, did not differ between groups. MPAP increased significantly in the HES200 group 12 h after sepsis induction compared to the RAc, 6% HES130 and SHAM group (Table 1).
Fluid balance and laboratory
Treatment with RAc led to a significantly higher fluid input and fluid balance in the RAc group as compared to all other groups after 12 h of sepsis. The degree of Hct was similar in all groups at baseline and 12 h after induction of sepsis (Table 1). COP was significantly higher in 10% HES200 and 4% gelatin group after 12 h of sepsis compared to 6% HES130 and RAc (Table 1).
Inflammation
The inflammatory response was enhanced in all septic groups two hours after sepsis induction. IL-6 (Figure 2) was significantly higher in the 10% HES200 group com-pared to all other groups two hours after sepsis induc-tion and TNF-a increased significantly in the 10% HES200 group (4,122 ± 1,417 pg/ml; P < 0.05) com-pared to all other groups (6% HES130 1,199 ± 1,237 pg/ ml; 4% gelatin 1,939 ± 1,691 pg/ml; RAc 1,101 ± 498 pg/ml; SHAM 285 ± 385 pg/ml) two hours after sepsis induction (Table 2).
IL-10 was significantly elevated after 12 h of sepsis in the 10% HES200 group compared to 6% HES130, RAc and SHAM (Table 3).
2 h 45 min 6 h 2 h
2 hOP
Baseline Measurement
Hemorrhagic
Shock
Sepsis Induction
+2h Measurement
+4h Measurement
8 h
[image:4.595.57.539.596.725.2]+12h Measurement Resuscitation
Systemic oxygenation
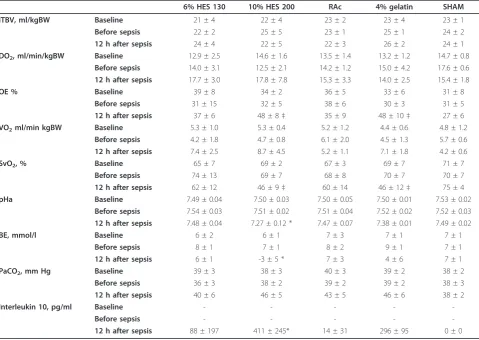
Results of systemic oxygenation are summarized in Table 3. SvO2was comparable at baseline in all groups.
Twelve hours after sepsis induction a significantly lower SvO2 was observed in the 4% gelatin and 10% HES200
group compared to SHAM (Table 3). Oxygen extraction ratio (OE) increased significantly in the 4% gelatin and 10% HES200 group compared to SHAM.
Renal function and histology
Electrolyte levels at baseline were comparable in all groups (Table 4). There were no differences in sodium levels between groups. Chloride levels were significantly lower in the 4% gelatin group compared to 10% HES200 and RAc after 12 h of sepsis.
Serum creatinine (as percent of baseline, a negative value means creatinine is decreasing compared to
baseline) was significantly higher in the 10% HES200 group compared to RAc and 6% HES130 12 h after sep-sis, and creatinine clearance was significantly lower in the 10% HES200 and the 4% gelatin group compared to 6% HES130 and SHAM 12 h after sepsis. Urine output at study end was lower in the 10% HES200 group com-pared to all other groups (Table 4).
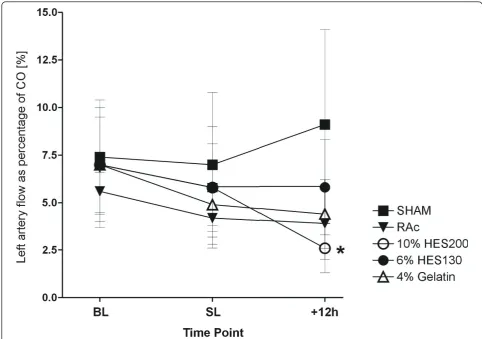
The renal artery flow of the left kidney as percentage of CO 12 h after sepsis was lower, but not significant, in the 10% HES200 group compared to all other septic groups, and significantly lower compared to the SHAM group (Figure 3).
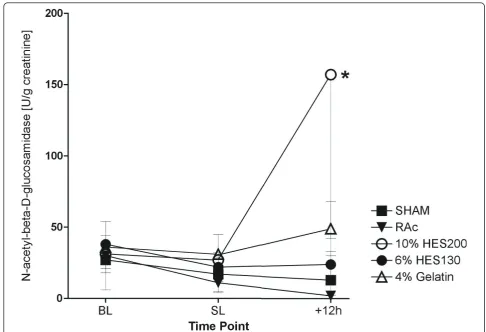
[image:5.595.58.545.100.477.2]Baseline values of NAG in urine (in units per gram creatinine (U/g creatinine)) were comparable in all groups. Fluid replacement with 10% HES200 led to a significantly higher NAG at study end compared to 6% HES130, RAc and SHAM (Figure 4).
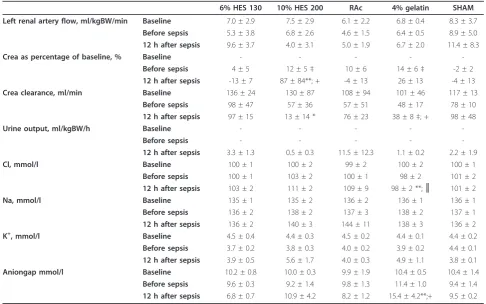
Table 1 Hemodynamic parameters and fluid balance
6% HES 130 10% HES 200 RAc 4% gelatin SHAM
HR, bpm Baseline 93 ± 14 91 ± 10 89 ± 12 91 ± 9 98 ± 8
Before sepsis 95 ± 5 96 ± 22 106 ± 20 92 ± 13 98 ± 11
12 h after sepsis 140 ± 19 158 ± 19‡ 127 ± 18 151 ± 32‡ 93 ± 2
MAP, mm Hg Baseline 90 ± 1 91 ± 2 92 ± 2 91 ± 2 90 ± 1
Before sepsis 91 ± 3 98 ± 8 91 ± 1 93 ± 4 91 ± 3
12 h after sepsis 86 ± 11 70 ± 21 59 ± 5 71 ± 26 96 ± 7
CVP, mm Hg Baseline 7 ± 1 6 ± 1 7 ± 1 7 ± 1 6 ± 1
Before sepsis 6 ± 2 9 ± 2 8 ± 1 8 ± 1 6 ± 1
12 h after sepsis 12 ± 0 12 ± 0 12 ± 0 12 ± 0 12 ± 0
PAOP, mm Hg Baseline 8 ± 1 7 ± 1 8 ± 1 7 ± 1 7 ± 2
Before sepsis 8 ± 2 8 ± 1 10 ± 2 9 ± 2 8 ± 1
12 h after sepsis 11 ± 3 12 ± 1 11 ± 2 10 ± 1 12 ± 1
MPAP, mm Hg Baseline 15 ± 2 16 ± 3 19 ± 1 17 ± 2 18 ± 2
Before sepsis 17 ± 2 20 ± 4 20 ± 1 19 ± 3 21 ± 1
12 h after sepsis 33 ± 9 45 ± 3 *,§,‡ 26 ± 4 41 ± 3 §,‡ 21 ± 4
CO, ml/kgBW Baseline 102 ± 20 109 ± 17 110 ± 15 98 ± 8 110 ± 7
Before sepsis 118 ± 13 133 ± 37 134 ± 28 137 ± 26 126 ± 19
12 h after sepsis 171 ± 47 143 ± 48 137 ± 32 160 ± 42 120 ± 28
Hct, % Baseline 29 ± 1 31 ± 2 28 ± 2 30 ± 3 30 ± 1
Before sepsis 26 ± 1 25 ± 4 26 ± 2 24 ± 4 30 ± 4
12 h after sepsis 28 ± 4 30 ± 4 27 ± 3 25 ± 5 29 ± 4
COP, mm Hg Baseline 11.5 ± 0.9 11.4 ± 2.4 11.1 ± 2.2 11.2 ± 1.0 12.2 ± 1.1
Before sepsis 11.8 ± 1.4 13.6 ± 1.7 9.9 ± 1.1 12.5 ± 0.9 10.9 ± 0.3
12 h after sepsis 10.0 ± 1.7 14.6 ± 1.8 *;§;‡ 8.1 ± 1.5 15.1 ± 1.5 *;§;‡ 10.3 ± 0.4
Fluid input, ml/kg BW Baseline - - - -
-Before sepsis 62 ± 11 45 ± 12 140 ± 41║ 62 ± 14 5 ± 7
12 h after sepsis 213 ± 41 120 ± 35 556 ± 230║ 178 ± 36 110 ± 26
Fluid balance, ml/kg BW Baseline - - - -
-Before sepsis 39 ± 3 28 ± 10 93 ± 25║ 45 ± 17 18 ± 11
12 h after sepsis 149 ± 30 75 ± 33 335 ± 94║ 109 ± 28 68 ± 43
Hemodynamics and Fluid balance in the five groups. Data are presented as mean ± SD at baseline, 6 h after hemorrhagic shock and before sepsis induction (before sepsis) and 12 h after sepsis induction. BW, body weight; CO, cardiac output; COP, colloid osmotic pressure; CVP, central venous pressure; Hct, hematocrit; HR, heart rate; MAP, mean arterial pressure; MPAP, mean pulmonary artery pressure; PAOP, pulmonary artery occlusion pressure.
The histological analyses are presented in Table 5. They showed a significant increase in OL for 4% gelatin compared to RAc, 6% HES130 and SHAM. ATN was significantly higher in 10% HES200 compared to SHAM. Also IBl was significantly higher in 10% HES200 com-pared to RAc, 6% HES130 and SHAM. There was a non- significant increase in GSl in the 10% HES200 group compared to all other groups (Table 5).
Discussion
The most important result of the present study is that in pigs after hemorrhagic and consecutive septic shock,
6% HES 130/0.42 in RAc and RAc solution are more effective in preserving renal function. Furthermore, we demonstrated a significant higher NAG and ATN indi-cating a more pronounced tubular damage using hyper-oncotic 10% HES 200/0.5 in 0.9% saline.
Hemodynamics
In macro-circulation there were no differences between the fluid replacement solutions tested. There were sig-nificant differences in oxygen extraction and SvO2 between 10% HES200 and 4% gelatin compared to SHAM and no differences between septic groups.
Time Point
BL
SL
+2h
+4h
+12h
In
terl
eu
kin
6
[pg/
ml]
0
2000
4000
6000
8000
6% HES130 10% HES200 RAc 4% Gelatin SHAM
§
[image:6.595.58.541.88.407.2]#
Figure 2Interleukin 6 levels over study period. Data are presented as mean ± standard deviation in pg/ml at baseline (BL), 6 h after hemorrhagic shock and before sepsis induction (SL) and 2, 4 and 12 h after sepsis induction *P≤0.05 vs. 6% HES130, RAc und SHAM § =P≤
0.05 vs. all other groups.
Table 2 TNF-alevels
6% HES 130 10% HES 200 RAc 4% gelatin SHAM
BL 131 ± 57 176 ± 92 172 ± 56 270 ± 214 226 ± 146
Before sepsis 183 ± 93 255 ± 241 125 ± 57 325 ± 210 95 ± 83
2 h after sepsis 1,199 ± 1,239 4,122 ± 1,216* 1,101 ± 498 1,938 ± 1,691 285 ± 386
4 h after sepsis 665 ± 384 2,396 ± 2,656 501 ± 215 746 ± 851 251 ± 364
12 h after sepsis 280 ± 75 673 ± 618 252 ± 64 437 ± 83 400 ± 326
[image:6.595.55.540.636.713.2]Renal function
Sepsis is often associated with impaired renal function. The effect of HES infusion on renal function in sepsis patients has spurred ongoing research on the underlying pathology.
Schortgen and colleagues showed HES to be an inde-pendent risk factor for acute renal failure in severe sep-sis [6]. The methodology of this study has been questioned, although it was randomized and controlled [9,14]. Recently, in a German multicenter randomized controlled trial (efficacy of fluid substitution and insulin therapy in severe sepsis (VISEP) study), it was shown that the use of 10% HES 200/0.5 compared with lactated Ringer’s solution (RL) in patients with severe sepsis or septic shock is associated with an increased need for renal replacement therapy. Furthermore, the cumulative dosage of 10% HES200/0.5 was significantly correlated with the need for renal replacement therapy [7]. In con-trast, a recent large prospective observational study of over 3,000 critically ill patients, showed that in those patients with an ICU stay of more than 24 hours, sepsis,
heart failure and hematological cancer were all signifi-cantly associated with the need for dialysis or hemofil-tration therapy, but fluid replacement with HES was not [14]. Comparing this result with the data of the VISEP study, one important difference is the total amount of administered HES. In the VISEP study, patients received HES for up to 21 days with a median cumulative dose of 70.4 ml/kg (interquartile range: 33.4 to 144.2 ml/kg), whereas in the observational study, the median total amount of HES per patient was lower (1,000 ml, inter-quartile range: 500 to 2,250 ml corresponding to a cumulative dose of less than 15 ml/kg).
[image:7.595.58.538.100.440.2]These data as well as the results of our study on HES and renal function suggest that the degree of functional impairment might depend on the HES formulation used. In our study, in comparison to 6% HES130 and RAc, the use of 10% HES200 was associated with a sig-nificant lower creatinine clearance and higher creatinine levels. Furthermore, significantly higher NAG levels in the urine indicated a higher degree of tubular damage in this group.
Table 3 Measured and calculated parameters of oxygenation, hemodynamics, inflammation and acid-base metabolism
6% HES 130 10% HES 200 RAc 4% gelatin SHAM
ITBV, ml/kgBW Baseline 21 ± 4 22 ± 4 23 ± 2 23 ± 4 23 ± 1
Before sepsis 22 ± 2 25 ± 5 23 ± 1 25 ± 1 24 ± 2
12 h after sepsis 24 ± 4 22 ± 5 22 ± 3 26 ± 2 24 ± 1
DO2, ml/min/kgBW Baseline 12.9 ± 2.5 14.6 ± 1.6 13.5 ± 1.4 13.2 ± 1.2 14.7 ± 0.8
Before sepsis 14.0 ± 3.1 12.5 ± 2.1 14.2 ± 1.2 15.0 ± 4.2 17.6 ± 0.6
12 h after sepsis 17.7 ± 3.0 17.8 ± 7.8 15.3 ± 3.3 14.0 ± 2.5 15.4 ± 1.8
OE % Baseline 39 ± 8 34 ± 2 36 ± 5 33 ± 6 31 ± 8
Before sepsis 31 ± 15 32 ± 5 38 ± 6 30 ± 3 31 ± 5
12 h after sepsis 37 ± 6 48 ± 8‡ 35 ± 9 48 ± 10‡ 27 ± 6
VO2ml/min kgBW Baseline 5.3 ± 1.0 5.3 ± 0.4 5.2 ± 1.2 4.4 ± 0.6 4.8 ± 1.2
Before sepsis 4.2 ± 1.8 4.7 ± 0.8 6.1 ± 2.0 4.5 ± 1.3 5.7 ± 0.6
12 h after sepsis 7.4 ± 2.5 8.7 ± 4.5 5.2 ± 1.1 7.1 ± 1.8 4.2 ± 0.6
SvO2, % Baseline 65 ± 7 69 ± 2 67 ± 3 69 ± 7 71 ± 7
Before sepsis 74 ± 13 69 ± 7 68 ± 8 70 ± 7 70 ± 7
12 h after sepsis 62 ± 12 46 ± 9‡ 60 ± 14 46 ± 12‡ 75 ± 4
pHa Baseline 7.49 ± 0.04 7.50 ± 0.03 7.50 ± 0.05 7.50 ± 0.01 7.53 ± 0.02
Before sepsis 7.54 ± 0.03 7.51 ± 0.02 7.51 ± 0.04 7.52 ± 0.02 7.52 ± 0.03
12 h after sepsis 7.48 ± 0.04 7.27 ± 0.12 * 7.47 ± 0.07 7.38 ± 0.01 7.49 ± 0.02
BE, mmol/l Baseline 6 ± 2 6 ± 1 7 ± 3 7 ± 1 7 ± 1
Before sepsis 8 ± 1 7 ± 1 8 ± 2 9 ± 1 7 ± 1
12 h after sepsis 6 ± 1 -3 ± 5 * 7 ± 3 4 ± 6 7 ± 1
PaCO2, mm Hg Baseline 39 ± 3 38 ± 3 40 ± 3 39 ± 2 38 ± 2
Before sepsis 36 ± 3 38 ± 2 39 ± 2 39 ± 2 38 ± 3
12 h after sepsis 40 ± 6 46 ± 5 43 ± 5 46 ± 6 38 ± 2
Interleukin 10, pg/ml Baseline - - - -
-Before sepsis - - - -
-12 h after sepsis 88 ± 197 411 ± 245* 14 ± 31 296 ± 95 0 ± 0
Data are presented as mean ± SD at baseline, 6 h after hemorrhagic shock and before sepsis induction (before sepsis) and 12 h after sepsis induction. BW, body weight; DO2, systemic oxygen delivery; HES, hydroxyethylstarch; ITBV, intrathoracic blood volume; OE, oxygen extraction ratio; PaCO2, arterial CO2; pHa, arterial
Our results are in line with a recent pharmacokinetic study of healthy volunteers demonstrating that repeated administration of 6% HES 130/0.42 shows no accumula-tion compared to 10% HES 200/0.5 [15].
However, injury mechanisms remain unclear but the oncotic force of the fluid replacement solutions seems also to be important. When the oncotic pressure exceeds the hydraulic pressure of glomerular filtration it may suppress urine output [16]. Furthermore, glomeru-lar filtration of hyperoncotic molecules from colloids causes hyper viscose urine and a stasis of tubular flow, resulting in obstruction of tubular lumen [17]. Recently, the occurrence of renal adverse events after resuscitation of shock in 822 ICU patients using crystalloids, hypoon-cotic (gelatin and 4% albumin) and hyperonhypoon-cotic col-loids (HES and dextran), and hyperoncotic 20% albumin was investigated in an observational multicenter cohort study [18]. The occurrence of renal adverse events was more frequent in both hyperoncotic groups compared to crystalloids and isooncotic colloids, suggesting that the hyperoncocity was more relevant than the nature of the product itself. Also in our study, the COP was sig-nificantly higher in the 10% HES200 and 4% gelatin
groups after 12 h of sepsis compared to 6% HES130 and RAc. This might be one of the potential reasons for the pronounced kidney injury in the 10% HES200 group. However, as isooncotic 6% HES 130/0.42 (in vitroCOP 37.8 mmHg) and hyperoncotic 10% HES 200/0.5 (in vitro COP 80 to 85 mmHg) were compared, it cannot be differentiated whether the oncotic force, the molecu-lar weight, the degree of momolecu-lar substitution, molecumolecu-lar size, the solvent for colloid solution, or a combination of these were determining factors of the HES-induced adverse effects on renal function and structure.
HES is partly eliminated by the reticuloendothelial sys-tem, and a dose dependent uptake in macrophages, endothelial and epithelial cells was detected [19]. Addi-tionally, tissue deposition of HES was found in the kid-neys. The HES containing vacuoles in the kidneys are called osmotic-like lesions (OL). This tissue deposition of HES seems to be transitory and dose-dependent [19,20]. In our investigation we found OL elevated in all colloid groups achieving a significant level in the 4% gelatin group.
[image:8.595.54.541.99.403.2]In the renal histological analysis, we found in the 10% HES200 group significantly elevated acute tubular
Table 4 Renal perfusion and function
6% HES 130 10% HES 200 RAc 4% gelatin SHAM
Left renal artery flow, ml/kgBW/min Baseline 7.0 ± 2.9 7.5 ± 2.9 6.1 ± 2.2 6.8 ± 0.4 8.3 ± 3.7
Before sepsis 5.3 ± 3.8 6.8 ± 2.6 4.6 ± 1.5 6.4 ± 0.5 8.9 ± 5.0
12 h after sepsis 9.6 ± 3.7 4.0 ± 3.1 5.0 ± 1.9 6.7 ± 2.0 11.4 ± 8.3
Crea as percentage of baseline, % Baseline - - - -
-Before sepsis 4 ± 5 12 ± 5‡ 10 ± 6 14 ± 6‡ -2 ± 2
12 h after sepsis -13 ± 7 87 ± 84**; + -4 ± 13 26 ± 13 -4 ± 13
Crea clearance, ml/min Baseline 136 ± 24 130 ± 87 108 ± 94 101 ± 46 117 ± 13
Before sepsis 98 ± 47 57 ± 36 57 ± 51 48 ± 17 78 ± 10
12 h after sepsis 97 ± 15 13 ± 14 * 76 ± 23 38 ± 8‡; + 98 ± 48
Urine output, ml/kgBW/h Baseline - - - -
-Before sepsis - - - -
-12 h after sepsis 3.3 ± 1.3 0.5 ± 0.3 11.5 ± 12.3 1.1 ± 0.2 2.2 ± 1.9
Cl, mmol/l Baseline 100 ± 1 100 ± 2 99 ± 2 100 ± 2 100 ± 1
Before sepsis 100 ± 1 103 ± 2 100 ± 1 98 ± 2 101 ± 2
12 h after sepsis 103 ± 2 111 ± 2 109 ± 9 98 ± 2 **;║ 101 ± 2
Na, mmol/l Baseline 135 ± 1 135 ± 2 136 ± 2 136 ± 1 136 ± 1
Before sepsis 136 ± 2 138 ± 2 137 ± 3 138 ± 2 137 ± 1
12 h after sepsis 136 ± 2 140 ± 3 144 ± 11 138 ± 3 136 ± 2
K+, mmol/l Baseline 4.5 ± 0.4 4.4 ± 0.3 4.5 ± 0.2 4.4 ± 0.1 4.4 ± 0.2
Before sepsis 3.7 ± 0.2 3.8 ± 0.3 4.0 ± 0.2 3.9 ± 0.2 4.4 ± 0.1
12 h after sepsis 3.9 ± 0.5 5.6 ± 1.7 4.0 ± 0.3 4.9 ± 1.1 3.8 ± 0.1
Aniongap mmol/l Baseline 10.2 ± 0.8 10.0 ± 0.3 9.9 ± 1.9 10.4 ± 0.5 10.4 ± 1.4
Before sepsis 9.6 ± 0.3 9.2 ± 1.4 9.8 ± 1.3 11.4 ± 1.0 9.4 ± 1.4
12 h after sepsis 6.8 ± 0.7 10.9 ± 4.2 8.2 ± 1.2 15.4 ± 4.2**;+ 9.5 ± 0.2
Data are presented as mean ± SD at baseline, 6 h after hemorrhagic shock and before sepsis induction (before sepsis) and 12 h after sepsis induction. BW, body weight; Cl, chloride; Crea, creatinine; K+
, potassium; Na, sodium.
necrosis and interstitial bleeding compared to the other groups, indicating tubular injury, thereby explaining the increased NAG and reduced creatinine clearance.
In anex vivo renal perfusion model, the administra-tion of HES 130 and HES 200 soluadministra-tions induced a sig-nificant decrease in diuresis and creatinine clearance compared with Ringer’s lactate (RL). Interestingly, 10% HES 200/0.5 was associated in this experimental setting with significant elevated inflammatory response in tubu-lar monocytes. This pronounced pro-inflammatory effect of 10% HES 200/0.5 compared with 6% HES 130/0.42 caused more tubular damage than 6% HES 130/0.42 and RL [12]. In our present in vivo study, 10% HES200 in comparison to 6% HES130, 4% gelatin and RAc induced higher inflammatory response as suggested by higher Il-6, IL-10 and TNF-a levels, which is in accordance with our previous data. This increased inflammatory response in the 10% HES200 group may be another explanation for the pronounced kidney injury. In line with these findings, Murugan et al. demonstrated a context between elevated immune response and kidney injury [21].
Lv et al. showed in endotoxaemic rats that 6% HES200 in comparison to 0.9% saline reduced the intestinal production of proinflammatory cytokines, including TNF and IL-6 [22].
The acetate seems not to play a role in the inflamma-tory modulation. Davies et al. found in a study of 30 adult patients undergoing cardiopulmonary bypass for elective cardiac surgery that the use of acetate buffered prime solutions for cardiopulmonary bypass result in supra-physiological concentrations of acetate. Nonethe-less, there was no difference in interleukin-6 release compared to bicarbonate-balanced fluid [23].
Hoffmannet al. demonstrated that HES 130 is effec-tive to prevent LPS-induced leukocyte adherence, to attenuate LPS-induced capillary perfusion failure, and to reduce LPS-induced macromolecular leakage indicating even an anti-inflammatory potential of HES 130 [24].
Balanced solutions and acid-base balance
[image:9.595.55.538.88.427.2]knowledge, the present study is the first one to investi-gate balanced fluid replacement solutions in a two-hit model of hemorrhagic and septic shock. Resuscitation using RAc in experimental hemorrhagic shock could attenuate acidosis better than 0.9% saline solution, resulting in an improved survival rate [25]. Kellumet al. demonstrated in septic rats that the use of a balanced Hextend solution in comparison with 0.9% saline solu-tion was associated with improved acid balance and even survival [10]. In line with Kellums data, we found that using 6% HES 130/0.42 in RAc and RAc resulted in
significantly less negative base excess than resuscitation using 10% HES 200/0.5 in 0.9% saline. The administered amount of the latter was less compared to RAc. This result indicates that solvent for colloid solutions may be of relevance in resuscitation of shock in order to avoid further acid-based derangements. Interestingly, we could not find any differences in the concentration of chloride and sodium in the blood, except for a significantly lower chloride level in the 4% gelatin group at study end, most likely due to the fact that 4% gelatin contains less chlor-ide than RAc (4% gelatin 85 mmol/l; RAc 112 mmol/l). This is also reflected in a significantly higher calculated anion gap in the 4% gelatin group; the anion gap did not change in all other groups compared to baseline. Thus, the use of 0.9% saline as a solvent was not asso-ciated with unwanted electrolyte disturbances in our model.
[image:10.595.53.540.87.419.2]Furthermore, it was not possible to prevent metabolic acidosis in the 10% HES 200 group with no change in the anion gap compared to baseline. The metabolic acidosis in the 10% HES 200/0.5 group may be in part explained by the elevated chloride levels (111 ± 2 Figure 4N-acetyl-beta-D-glucosamidase in urine as a marker of lysosomal tubular damage. Data are presented as mean ± standard deviation in Units per gram creatinine at baseline (BL), 6 h after hemorrhagic shock and before sepsis induction (SL) and 12 h after sepsis induction * =P≤0.05 vs. 6% HES130, RAc und SHAM.
Table 5 Histopathological scoring of kidneys
6% HES 130 10% HES 200 RAc 4% gelatin SHAM
Ol 1.0 ± 0.9 1.5 ± 1.0 0.3 ± 0.3 2.6 ± 0.5* 0.5 ± 0.0
ATN 1.8 ± 1.1 2.2 ± 0.4‡ 0.8 ± 0.3 2.6 ± 0.5‡** 0.3 ± 0.6
IBl 0.4 ± 0.5 1.6 ± 0.9* 0.3 ± 0.5 0.6 ± 0.4 0.0 ± 0.0
GSl 1.3 ± 1.0 1.4 ± 0.5 0.6 ± 0.3 1.1 ± 0.5 0.7 ± 0.3
[image:10.595.58.290.631.696.2]mmol/l) due to the carrier solution. In addition, acetate is metabolized to HCO3- in the other solutions and is
acting as a bufferin situ.
Limitations
A limitation of our model may be the experimental duration of 19 hours. On the other hand, Riverset al. have shown that early goal-directed fluid resuscitation in patients with severe sepsis and septic shock provides significant benefits related to outcome in the first six hours after admission to an accident and emergency hospital (A&E) [2].
We chose CVP as our target for the infusion of the fluid replacement solutions according to the Surviving Sepsis Campaign: International guidelines for manage-ment of severe sepsis and septic shock [3]. Nevertheless there are several studies in critically ill patients [26,27] suggesting that ITBV is a valuable preload indicator. In our study, the data of ITBV suggest sufficient fluid sta-tus until the end of the experiment.
Another potential confounding factor may be gender differences in the inflammatory response and survival in sepsis [28]. Ovariectomized mice had a higher death rate than proestrus mice after cecal ligation and puncture [29]. This potential difference could not be addressed in our study because we used female pigs only.
Conclusions
Despite similar maintenance of macrocirculation 6% hydroxyethylstarch 130/0.42 and Ringer’s acetate signifi-cantly preserve renal function and attenuate tubular damage better than 10% hydroxyethylstarch 200/0.5 in saline.
Key messages
• After resuscitation there was no difference in sys-temic hemodynamics comparing the investigated solutions.
• Ten percent HES 200/0.5 induced significant increased tubular damage compared to Ringers’s acetate and 6% HES 130/0.42.
•Ten percent HES 200/0.5 induced significant renal impairment compared to Ringers’s acetate and 6% HES 130/0.42.
Additional material
Additional file 1: Histological analysis of an animal kidney treated
with 10%HES200. The Sections (4μm) were cut and stained with
hematoxylin and eosin. Osmotic-nephrosis like lesions are widespread and marked with an arrow. Original magnification: × 200.
Additional file 2: Histological analysis of an animal kidney SHAM
treated. The Sections (4μm) were cut and stained with hematoxylin and
eosin. Osmotic-nephrosis like lesions are very rare. Original magnification: × 200.
Additional file 3: Histological analysis of an animal kidney treated
with10% HES200. The Sections (4μm) were cut and stained with
hematoxylin and eosin. Interstitial bleeding are marked with an arrow. Original magnification: × 200.
Abbreviations
10% HES200: 10% hydroxyethylstarch 200/0.5 in saline; 4% gelatin: 4% gelatin in acetate; 6% HES 130: 6% hydroxyethylstarch 130/0.42; ATN: acute tubular necrosis; BL: baseline; BW: body weight; CFU: colony forming units; CO: cardiac output; COP: colloid osmotic pressure; CrCl: Creatinine clearance; CVP: central venous pressure; DO2, systemic oxygen delivery; GSl: glomerulo
sclerosis; Hct: hematocrit; HES: hydroxyethyl starch; Ibl: interstitial bleeding; IL-10: Interleukin 10; IL-6: Interleukin 6; ITBV: Intrathoracic blood volume; MAP: mean arterial pressure; MPAP: mean pulmonary artery pressure; NAG: N-acetyl- beta-D-glucosamidase; OE: oxygen extraction ratio; OL: osmotic-nephrosis like lesions; PAOP: pulmonary artery occlusion pressure; PEEP: positive end-expiratory pressure; Rac: Ringer’s acetate; RBF: Renal blood flow; RL: Ringer’s lactate; SD: standard deviation; SHAM: sham-treated group;
TNF-α: tumor necrosis factor alpha; VISEP: efficacy of fluid substitution and insulin therapy in severe sepsis.
Acknowledgements
We are indebted to Barbara Schmidt and Miriam Reutelshöfer for their excellent technical assistance.
This work was financed by a restricted grant fromf Serumwerke Bernburg, Bernburg, Germany. This grant was used for animal and material purchase. The authors were totally independent from Serumwerke Bernburg and had full control of all primary data. The study solutions were also provided by Serumwerke Bernburg.
Author details
1Department of Intensive Care and Intermediate Care, RWTH University
Hospital Aachen, Pauwelsstrasse 30, 52074 Aachen, Germany.2Department of Intensive Care, Central Hospital Bad Berka, Robert-Koch-Allee 9, 99437 Bad Berka, Germany.3Department of Anesthesiology and Intensive Care Medicine, University of Jena, Erlanger Allee 101, 07747 Jena, Germany.
4Department of Microbiology, Friedrich-Schiller University of Jena, Erlanger
Allee 101, 07747 Jena, Germany.
Authors’contributions
TPS made substantial contributions to the conception and design of the study, acquisition of data, analysis and interpretation of data, and wrote the manuscript. TS participated in the design of the study, performed statistical analysis and helped to draft the manuscript. LH, MS and FH made substantial contributions to the design of the study and the acquisition of data. WP made substantial contributions to conception and design of the study and provided the bacterial clots. GM made substantial contributions to conception and design of the study, interpretation of data and wrote the manuscript. All authors read and approved the final manuscript for publication.
Competing interests
This investigation was funded by a restricted grant from Serumwerke Bernburg, Bernburg, Germany. Serumwerke Bernburg holds the patents of several resuscitation solutions. TPS has received travel grants from BBraun and Serumwerke Bernburg. LH has received lecture fees from BBraun. GM has received honoraria for consulting or lecturing, and restricted research grants from the following companies: BBraun, Edwards Life Sciences, Serumwerke Bernburg, Hutchinson Technology, Baxter. All the other authors declare that they have no competing interests.
Received: 12 May 2011 Revised: 3 November 2011 Accepted: 25 January 2012 Published: 25 January 2012
References
1. Imm A, Carlson RW:Fluid resuscitation in circulatory shock.Crit Care Clin
2. Rivers E, Nguyen B, Havstad S, Ressler J, Muzzin A, Knoblich B, Peterson E, Tomlanovich M, Early Goal-Directed Therapy Collaborative Group:Early goal-directed therapy in the treatment of severe sepsis and septic shock.N Engl J Med2001,345:1368-1377.
3. Dellinger RP, Levy MM, Carlet JM, Bion J, Parker MM, Jaeschke R, Reinhart K, Angus DC, Brun-Buisson C, Beale R, Calandra T, Dhainaut JF, Gerlach H, Harvey M, Marini JJ, Marshall J, Ranieri M, Ramsay G, Sevransky J, Thompson BT, Townsend S, Vender JS, Zimmerman JL, Vincent JL, International Surviving Sepsis Campaign Guidelines Committee; American Association of Critical-Care Nurses; American College of Chest Physicians; American College of Emergency Physicians; Canadian Critical Care Society; European Society of Clinical Microbiology and Infectious Diseases; European Society of Intensive Care Medicine; European Respiratory Society; International Sepsis Forum; Japanese Association for Acute Medicine; Japanese Society of Intensive Care Medicine; Society of Critical Care Medicine; Society of Hospital Medicine; Surgical Infection Society; World Federation of Societies of Intensive and Critical Care Medicine:Surviving Sepsis Campaign: international guidelines for management of severe sepsis and septic shock: 2008.Crit Care Med2008,36:296-327. 4. Marx G:Fluid therapy in sepsis with capillary leakage.Eur J Anaesthesiol
2003,20:429-442.
5. Marx G, Hüter L, Schuerholz T:Impact of hydroxyethylstarch on renal function. The current status.InYearbook of Intensive Care and Emergency Medicine.Edited by: Vincent J-L. Berlin, Heidelberg, New York: Springer Verlag; 2009:533-543.
6. Schortgen F, Lacherade JC, Bruneel F, Cattaneo I, Hemery F, Lemaire F, Brochard L:Effects of hydroxyethylstarch and gelatin on renal function in severe sepsis: a multicentre randomised study.Lancet2001, 357:911-916.
7. Brunkhorst FM, Engel C, Bloos F, Meier-Hellmann A, Ragaller M, Weiler N, Moerer O, Gruendling M, Oppert M, Grond S, Olthoff D, Jaschinski U, John S, Rossaint R, Welte T, Schaefer M, Kern P, Kuhnt E, Kiehntopf M, Hartog C, Natanson C, Loeffler M, Reinhart K:Intensive insulin therapy and pentastarch resuscitation in severe sepsis.N Engl J Med2008,
358:125-139.
8. Sakr Y, Payen D, Reinhart K, Sipmann FS, Zavala E, Bewley J, Marx G, Vincent JL:Effects of hydroxyethyl starch administration on renal function in critically ill patients.Br J Anaesth2007,98:216-224. 9. Sümpelmann R, Witt L, Brütt M, Osterkorn D, Koppert W, Osthaus WA:
Changes in acid-base, electrolyte and hemoglobin concentrations during infusion of hydroxyethyl starch 130/0.42/6:1 in normal saline or in balanced electrolyte solution in children.Paediatr Anaesth2010, 20:100-104.
10. Kellum JA:Saline-induced hyperchloremic metabolic acidosis.Crit Care Med2002,30:259-261.
11. Guidet B, Soni N, Della Rocca G, Kozek S, Vallet B, Annane D, James M:A balanced view of balanced solutions.Crit Care2010,14:325. 12. Hüter L, Simon TP, Weinmann L, Schuerholz T, Reinhart K, Wolf G,
Amann KU, Marx G:Hydroxyethylstarch impairs renal function and induces interstitial proliferation, macrophage infiltration and tubular damage in an isolated renal perfusion model.Crit Care2009,13:R23. 13. Pearsons ES, Please NW:Relation between the shape of population
distribution and the robustness of four simple test statistics.Biometrika
1975,62:223-241.
14. Godet G:Hydroxyethylstarch as a risk factor for acute renal failure in severe sepsis.Lancet2001,358:581, author reply 582.
15. Lehmann GB, Asskali F, Boll M, Burmeister MA, Marx G, Hilgers R, Förster H: HES 130/0.42 shows less alteration of pharmacokinetics than HES 200/ 0.5 when dosed repeatedly.Br J Anaesth2007,98:635-644.
16. Barron J:Pharmacology of cristalloids and colloids.InTransfusion Medicine and Alternative to Blood Transfusion.Edited by: NATA. Paris: R 2000:123-127. 17. Chinitz JL, Kim KE, Onesti G, Swartz C:Pathophysiology and prevention of
dextran-40-induced anuria.J Lab Clin Med1971,77:76-87. 18. Schortgen F, Girou E, Deye N, Brochard L:The risk associated with
hyperoncotic colloids in patients with shock.Intensive Care Med2008, 34:2157-2168.
19. Stander S, Szepfalusi Z, Bohle B, Ständer H, Kraft D, Luger TA, Metze D: Differential storage of hydroxyethyl starch (HES) in the skin: an immunoelectron-microscopical long-term study.Cell Tissue Res2001, 304:261-269.
20. Sirtl C, Laubenthal H, Zumtobel V, Kraft D, Jurecka W:Tissue deposits of hydroxyethyl starch (HES): dose-dependent and time-related.Br J Anaesth1999,82:510-515.
21. Murugan R, Karajala-Subramanyam V, Lee M, Yende S, Kong L, Carter M, Angus DC, Kellum JA, Genetic and Inflammatory Markers of Sepsis (GenIMS) Investigators:Acute kidney injury in non-severe pneumonia is associated with an increased immune response and lower survival.Kidney Int2010, 77:527-35.
22. Lv R, Zhou W, Zhang LD, Xu JG:Effects of hydroxyethyl starch on hepatic production of cytokines and activation of transcription factors in lipopolysaccharide-administered rats.Acta Anaesthesiol Scand2005, 49:635-642.
23. Davies PG, Venkatesh B, Morgan TJ, Presneill JJ, Kruger PS, Thomas BJ, Roberts MS, Mundy J:Plasma acetate, gluconate and interleukin-6 profiles during and after cardiopulmonary bypass: a comparison of Plasma-Lyte 148 with a bicarbonate-balanced solution.Crit Care2011,15: R21.
24. Hoffmann JN, Vollmar B, Laschke MW, Inthorn D, Schildberg FW, Menger MD:Hydroxyethylstarch (130 kD), but not crystalloid volume support, improves microcirculation during normotensive endotoxemia. Anesthesiology2002,97:460-470.
25. Healey MA, Davis RE, Liu FC, Loomis WH, Hoyt DB:Lactated ringer’s is superior to normal saline in a model of massive hemorrhage and resuscitation.J Trauma1998,45:894-899.
26. Sakka SG, Bredle DL, Reinhart K, Meier-Hellmann A:Comparison between intrathoracic blood volume and cardiac filling pressures in the early phase of hemodynamic instability of patients with sepsis or septic shock.J Crit Care1999,14:78-83.
27. Lichtwarck-Aschoff M, Zeravik J, Pfeiffer UJ:Intrathoracic blood volume accurately reflects circulatory volume status in critically ill patients with mechanical ventilation.Intensive Care Med1992,18:142-147.
28. Diodato MD, Knoferl MW, Schwacha MG, Bland KI, Chaudry IH:Gender differences in the inflammatory response and survival following haemorrhage and subsequent sepsis.Cytokine2001,14:162-169. 29. Knoferl MW, Angele MK, Diodato MD, Schwacha MG, Ayala A, Cioffi WG,
Bland KI, Chaudry IH:Female sex hormones regulate macrophage function after trauma-hemorrhage and prevent increased death rate from subsequent sepsis.Ann Surg2002,235:105-112.
doi:10.1186/cc11161
Cite this article as:Simonet al.:Impairment of renal function using hyperoncotic colloids in a two hit model of shock: a prospective randomized study.Critical Care201216:R16.
Submit your next manuscript to BioMed Central and take full advantage of:
• Convenient online submission • Thorough peer review
• No space constraints or color figure charges • Immediate publication on acceptance
• Inclusion in PubMed, CAS, Scopus and Google Scholar • Research which is freely available for redistribution