Characterization of Nitrate Contamination in an Arid
Region of China
Guangwei Huang
Graduate School of Global Environmental Studies, Sophia University, Tokyo, Japan. Email: [email protected]
Received May 28th, 2013; revised June 28th, 2013; accepted July 9th, 2013
Copyright © 2013 Guangwei Huang. This is an open access article distributed under the Creative Commons Attribution License, which permits unrestricted use, distribution, and reproduction in any medium, provided the original work is properly cited.
ABSTRACT
There are two pathways for nitrate to enter into human body: drinking water and food. Therefore, nitrate contamination of drinking water and agricultural crops is of particular interest to governments and the general public owing to the pos- sible implications for health. This work investigated nitrate contents in various crops and in different parts of each crop and in drinking water as well in the Zhangye Basin, Northwest China. It provided evidence of severe nitrate contamina- tion of drinking water, especially, in vegetable-growing villages. As to the nitrate contamination of crops, the present study revealed that all sampled crops adjust their nitrate distributions in a way that the edible parts contain much less nitrate than non-edible parts except lettuce. The nitrate content in the edible root of lettuce reached up to 5900 mg/kg exceeding the limit set by the European Commission.
Keywords: Nitrate Contamination; Drinking Water; Crops; Zhangye Basin
1. Introduction
This Nitrate (NO3) is an integral part of the nitrogen cycle in the environment. It is oxidized form of nitrogen and highly soluble in water. It is invisible, odorless and tasteless. Nitrate is commonly found in soil and water and is the most effective form by which plants obtain their nitrogen. However, it is also most readily lost from soil by leaching in drainage water, which may be consid- ered as one of the reasons for over-application of nitrogen fertilizers [1,2].
To meet the food demand of the growing world popu- lation, continued increases in food production is a neces- sity. Since the mid-19th century, nitrogen has been used in the agricultural system to boost productivity. It was reported that the nitrogen use increased four-fold in USA between 1960 and 1989 [3]. During the same period, the nitrogen use in China increased 15 times according to China Year Book. Presently, China has become the larg- est consumer of synthetic nitrogen in the world, account- ing for 32% of the world’s total nitrogen consumption [4].
A particular concern of nitrogen use in agricultural practices is the nitrate contamination in waters and ac- cumulation in agricultural products. The primary reason for the concern is the threat it poses to human health. The
Besides, low nitrate contents (below 6 mg/kg) were found in fruit (grapes, peaches, apples and pears) and tomato. Petersen and Stoltze [13] surveyed the contents of nitrate and nitrite in lettuce, leek, potato, beetroot, Chinese cab- bage and white cabbage on the Danish market. The high- est content of nitrate was found in lettuce followed by beetroot and Chinese cabbage. They further estimated human’s daily intake of nitrate from the vegetables. Zhong et al. [14] investigated the contents of nitrate and nitrite in potato, cabbage, Chinese cabbage, scallion, cel- ery, cucumber, tomato, eggplant and wax gourd taken in Northern China. The highest content of nitrate was found in celery followed by Chinese cabbage, cabbage, scallion, wax gourd and eggplant. The study by Ayaz et al. [15] indicated that nitrate concentrations in vegetables in Turkey are low and of little concern. The mean content of nitrate in vegetable-based infant foods of Estonian origin was reported to be 88 mg/kg and the average daily intake of nitrate by children in the age group of 4 - 6 years was estimate to be 30 mg [16].
The above-mentioned studies have greatly improved the understanding on the possible range of nitrate content in various agricultural products. However, they did not consider nitrate distribution in crops. Santamaria et al. [17] showed that the nitrate content in vegetable organs can be listed in the decreasing order from petiole, leaf, stem, root to seed. Andrews [18] proposed that a greater proportion of nitrate assimilation occurs in the shoot when an increase in the rate of nitrate uptake does not induce an increase in nitrate reductase level in the root. Overall, knowledge on nitrate distribution in agricultural crops is still relatively limited.
The present study focused on an arid region of China where groundwater contamination by nitrate due to inten- sive farming has been reported. Nitrate contents in vari- ous crops and drinking water in the region were measured. The objective is to report the current state of nitrate con- tamination of crops and drinking water in this region.
It should be noted that the Joint Expert Committee on Food Additives and the European Commission’s Scien- tific Committee on Food have set an Acceptable Daily Intake (ADI) for nitrate of 3.7 mg/kg bodyweight, which is equivalent to 220 mg per day for an adult of 60 kg [19, 20]. Therefore, it may be stated that infants are more vulnerable to nitrate contamination in drinking water while adults are more affected by nitrate accumulation in foods.
In the present study, the investigations on nitrate con- tamination were conducted mainly in the middle reaches of the Heihe River (or the Zhangye Basin) every summer from 2009 to 2012.
2. Materials and Methods
The middle reaches of the Heihe River was chosen as our
study area. Heihe River is the second largest inland river in China. Its main stream, with a length of 821 km, originates from the Qilian Mountains of Qinghai Prov- ince, flows through the Zhangye Basin, which is part of the ancient Silk Road, and ends up in the Inner Mongolia Autonomous Region. The catchment of the middle reaches, or the Zhangye Basin, covers an area of 1.08 × 10⁴ km2 extending from 38˚30′ to 39˚50′N and 99˚10′ to
100˚52′E. Along the main stream, the middle reaches starts from the Yingluo Gorge and ends at the Zhengyi Gorge (Figure 1).
Zhangye Basin is characterized by a dry continental climate, with mean annual precipitation of about 200 mm, and annual evaporation of 2000 mm or more. The re- newable water resource per capita in Zhangye is 1250 m3/yr, just 5% of the world average. Since 2001, about
50% ~ 60% of the annual total river discharge have been diverted from the middle to the lower reaches of the river following the regulation imposed by the Ministry of Wa- ter Resources of China (MWR). Consequently, ground- water abstraction and sewage water reuse for agricultural purpose have been increasing gradually to compensate for the reduced river water supply.
Grain crops, particularly seed corn, are densely culti- vated in the Zhangye Basin, sustained by the continuous application of chemical nitrogen fertilizers. In 2005, the total amount of nitrogen fertilizers applied on the corn fields was more than 300 kg·ha−1·year−1 and, more re-
cently, was more than 450 kg·ha−1·year−1 [21].
[image:2.595.311.535.489.718.2]The study by Yang and Liu [22] showed that 32.4% of the groundwater well samples in Zhangye had nitrate- nitrogen concentrations greater than the allowed value set by the WHO. Fang and Ding [23] reported the nitrate
concentration of groundwater as high as 84.1 mg/L in the urbanized area of the Zhangye Basin and about 67% of irrigation land area was associated with medium (13 - 30 mg/L) nitrate concentration. Zhang et al. [24] reported nitrate concentrations in groundwater ranging from 45 to 150 mg/L in irrigated area. Field survey by Qin et al. [25] also showed that groundwater with high nitrate concen- tration (>45 mg/L) appeared in the centre of the irrigated area. However, these studies did not make distinction between wells for drinking and wells for irrigation or other purposes. Therefore, nitrate contamination of drin- king water in the region could not be inferred from their findings.
It should be noted here that although the WHO limit for nitrate-nitrogen in drinking water is 10 mg/L or equi- valent to 45 mg/L for nitrate, Chinese standard for ni- trate-nitrogen in drinking water issued in 1986 is 20 mg/L or equivalent to 90 mg/L for nitrate.
For drinking water investigation, samples were directly taken from household by home visit. The drinking water resource in the Zhangye Basin is groundwater. The sup- ply system is the construction of community drinking well and water tower to distribute potable water through pressurized pipe network to each household within a community. The number of household surveyed was 5 in 2009, 20 in 2010, 16 in 2011 and 8 in 2012. Except 2012, home visits were randomly conducted in various villages across the basin. In 2012, drinking water testing was conducted in villages where the nitrate concentrations in crops were measured.
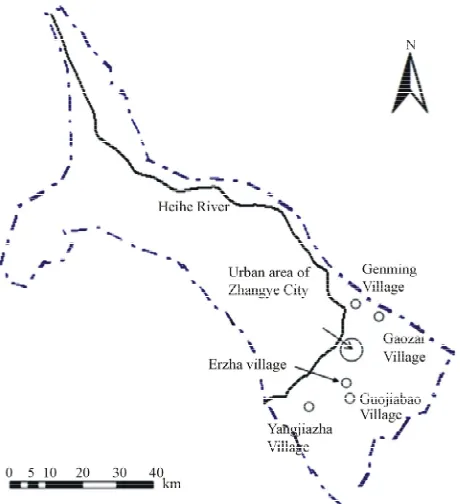
In the Zhangye Basin, there are three sources of irriga- tion water: river water; groundwater and the mixture of river water and sewage water. The use of sewage water for irrigation is because of water scarcity. In this study, three types of farmland using different source of water for irrigation were selected (Figure 2). Gaozai and Gen-
[image:3.595.309.539.85.337.2]ming villages are located in the northeast and north part of the Zhangye City, where the irrigation water is of the mixed type. Guojiabao and Erzha villages are relatively close to the urbanized area of the city, where the source of irrigation water is groundwater. Yangjiazha village is in the southern part of the city and uses river water for irrigation. Crop samples were taken from these fields and on-site measurements of nitrate concentration were con- ducted. The method is to extract out plant juice of a vol- ume between 0.3 ml and 2 ml from crop sample, and measure its nitrate concentration with the Horiba compact nitrate ion meter (LAQUAtwin-B741), which is based on the colorimetric method of Gilbert [26]. The sensor was calibrated by the two-calibration mode with 300 mg/kg and 5000 mg/kg standard solutions on a daily base. For seed-corn plant, the measurements were conducted every 10 cm along the stalk from the brace roots to the top flag leaf. Moreover, the nitrate concentration of corn niblets
Figure 2. Zhangye Basin and sampling sites for the 2012 sur- vey.
was also measured. For comparison, both mature and immature corn plants were measured. For vegetables, leaf and root were measured separately. In addition, the ni- trate concentrations of irrigation water entering into the fields were measured with the Horiba compact nitrate ion meter (LAQUAtwin-B743) for water. The investigation on the build-up of nitrate in crops was conducted from August 8 to 18, 2012. All measurements were done under fine weather during daytime.
3. Results and Discussion
In 2009, two households out of five were found to drink water having nitrate concentrations above the WHO stan- dard. The highest nitrate concentration found in the 2009 survey was 75 mg/l. When asking if they are concerned about nitrate contamination, one of the householders an- swered that there is no worry because they boil water before drinking. This highlighted the need of basic sci- ence education for farmers in this region because boiling can’t remove nitrate.
In 2010, drinking water testing found that eight house- holds out of twenty having nitrate contents exceeding the WHO standard with the highest value of nitrate being 160 mg/l. In 2011, nine out of sixteen were above the WHO standard. The percentage of different levels of nitrate ob- served during the three years was shown in Figure3. It
In 2012, although the survey mainly focused on nitrate contamination of crops in four villages, nitrate in drink- ing water was also tested at the same time.
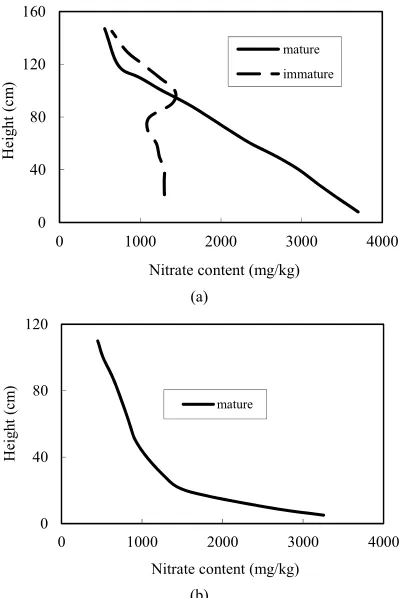
In the Gaozai village, we randomly selected two corn plants; one mature and another immature. The maturity is judged by the size and color of corn ears. The mature corn ear was 20 cm long and golden color while the im- mature was 10 cm long and pale green color. Figure 4(a)
shows the nitrate concentration distributions along the two corn stalks. In the mature plant, the nitrate concen- tration was as high as 3700 mg/kg at the brace roots but
[image:4.595.81.264.229.359.2]Nitrete>45 45>Nitrate>15 Nitrate<15
Figure 3. Percentage of different nitrate levels found in drinking water from 2009 to 2011.
0 40 80 120 160
0 1000 2000 3000 40
He
ig
ht (
cm
)
Nitrate content (mg/kg)
00
mature immature
(a)
0 40 80 120
0 1000 2000 3000 40
H
ei
ght
(
cm
)
Nitrate content (mg/kg)
00
mature
(b)
Figure 4. Nitrate distributions in corn stalks. (a) Sewage- river mixed water irrigation case; (b) River water irrigation case.
decayed quickly along the stalk. In the immature plant, the nitrate concentration at the bottom was not signifi- cantly higher than the top. The maximum concentration occurred somehow in the middle of the plant where a single ear grew. The nitrate concentrations in niblets of both the mature and immature corns were 110 mg/kg and 210 mg/kg, respectively. This comparison suggests that the corn plant adjust its nitrate build-up through its growing stage in a way that the edible part contains the least nitrate. In other words, the final distribution of ni- trate in corn plant is in favor of human beings. For water entering into the farmland where corn samples were ta- ken, the concentrations of nitrate and ammonium (NH4
)
were found to be 20 mg/kg and 6 mg/L, respectively. The ammonium concentration was measured with the DR/890 Portable Colorimeter manufactured by the HACH Com- pany. The data implies that high ammonium coming from waste water was converted to nitrate and then utilized by plants.
In the Genming village, which is about 10 km down- stream of the Gaozai village, the concentration of nitrate in the irrigation channel was found to be as high as 110 mg/kg but 0.2 mg/L for ammonium. And the nitrate con- centrations in corn plants taken from that village showed a very similar pattern as that observed in the Gaozai vil- lage. In this mixed water-irrigated area, mass production of vegetables is non-existent. According to interview with local farmers, vegetables could not be grown with the mixed water.
In the Yangjiazha village where the water from the Heihe River is used for irrigation, the nitrate concentra- tion in the sampled corn plant is shown in Figure 4(b).
The corn plant in this river-water-irrigated area shared similar characteristics with that in the mixed-water irri- gated area in terms of the vertical decreasing pattern. However, the nitrate concentration in the river-water-fed plant decreased vertically much fast than the mixed-wa- ter-fed plant. Therefore, the total build-up of nitrate is much less if river water is used for irrigation. The nitrate concentration of the irrigation water in the village was measured to be 15 mg/L. The indifference in the concen- tration of root part with regard to the source of irrigation water can be considered as indicative of excessive use of nitrogen fertilizer in the river-water-fed field.
[image:4.595.73.275.398.697.2]and 41 mg/kg, respectively.
In the Guojiabo and Erzha villages where the ground- water is used to irrigate vegetable farmlands, cauliflower, broccoli, lettuce, beet, tomato, Chinese cabbage, green pepper, red pepper, lantern chilli, cucumber were sam- pled for nitrate concentration. The measurement results are compiled in Figure 5.
The nitrate concentration in broccoli leaf was as high as 5300 mg/kg. However, the nitrate concentrations in broccoli thick stalk and flower head were 2600 mg/kg and 860 mg/kg, respectively. Cauliflower and Chinese cabbage contained high amount of nitrate in leaf but much less in edible part. Among all measured, lettuce was the only one having very high concentrations in both leaf and root. Beet leaf and root had quite the same but moderate amount of nitrate. It should be noted that both the leaf and root of lettuce are consumed as food by hu- mans. For broccoli, fleshy flower head and the top part of thick stalk are edible. Beet is now usually used for mak- ing sugar.
The study by Santamaria [17] showed a decreasing or- der of the nitrate content in vegetable organs from leaf, stem to root. The present study, however, found that the nitrate in lettuce and beet could have quite uniform dis- tribution. Furthermore, the present study revealed that the nitrate content in seed-corn plant can be listed in the de- creasing order from brace roots, stalk to niblets.
The European Commission has established maximum levels (MLs) for nitrate in lettuces [27]. For summer har- vest, the limit is 2500 mg/kg for those grown in the open air and 3500 for those grown under cover. For winter harvest, it is 4000 mg/kg for those grown in the open air and 4500 mg/kg for those grown under cover. Judging from European standards, the lettuce produced in Zhan- gye ought to be viewed as a health risk.
[image:5.595.313.523.514.708.2]Guojiabo and Erzha villages are about 1.5 km apart and their drinking water is taken from wells about 30 m deep. Measurements found that the nitrate concentration in their drinking water was 78 mg/kg in the Guojiabo village and as high as 160 mg/kg in the Erzha village. By contrast, the nitrate concentration of the drinking water in
Figure 5. Nitrate contents in various agricultural products.
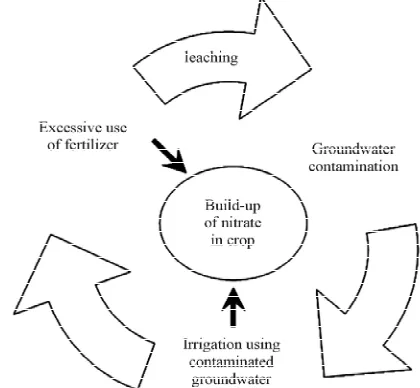
the Yangjiazha village was 34 mg/kg. This suggests that a cycle of groundwater contamination could have formed in vegetable-growing villages as illustrated in Figure 6.
4. Conclusions
Although previous studies have reported nitrate con- tamination of groundwater in the Zhangye Basin, it was not clear if the contaminated groundwater was actually used by local residents for drinking and cooking. By home visiting and testing nitrate concentration of water used for drinking and cooking, this study provided evi- dence of severe nitrate contamination of drinking water in the Zhangye Basin. Meanwhile, this work improved understanding of nitrate contamination of food by re- vealing that the edible parts of various crops such as corn niblets, broccoli flower head are much less contaminated compared with non-edible parts such corn stalk and Chi- nese cabbage leaf. The nitrate in lettuce and beet was found to have quite uniform distribution, but nitrate con- tent in seed-corn plant can be listed in the decreasing order from brace roots, stalk to niblets. Among all meas- ured, lettuce is the only one having very high concentra- tion in edible parts. Therefore, it may be stated that many crops adjust their nitrate content distributions in favor of humans.
[image:5.595.58.286.591.720.2]The build-up of nitrate in corn plant is affected by the type of irrigation water. The use of sewage water for ir- rigation due to water scarcity may cause more nitrate build-up in corn stalk. Meanwhile, production of vegeta- bles in the Zhangye Basin mainly uses groundwater. The excessive use of fertilizer has resulted in not just higher contents of nitrate in vegetables but also groundwater contamination, which is the source of drinking water in that region.
5. Acknowledgements
Thanks should be given to Liu Huan, Li Ling, graduate students of Sophia University, for their assistance in field work. Appreciation also goes to Dr. T. Akiyama, the University of Tokyo, and Dr. Li Jia, the University of Niigata Prefecture, for their support and arrangement prior to and during the field investigation. Above all, the most sincere gratitude and appreciation go to Prof. Li Xin and Prof. Ma Mingguo, Cold and Arid Regions Envi- ronment and Engineering Research Institute, Chinese Academy of Sciences. Without their generous support and cooperation, this investigation would become very difficult if not impossible.
REFERENCES
[1] T. Addiscott, “Nitrate, Agriculture and the Environment,” CABI,Wallingford, 2005.
[2] L. Razowska-Jaworek and A. Sadurski, “Nitrate in Ground- waters,” IAH Hydrogeology Selected Papers 5, 2004, pp. 247-258.
[3] H. Vroomen, “Fertilizer Use and Price Statistics,” Re- source and Technology Division, ERS, USDA, Statistics Bulletin, 1989, pp. 780.
[4] P. Heffer, “Assessment of Fertilizer Use by Crop at the Global Level: 2006/07-2007/08,” International Fertilizer Industry Association, Paris, 2009.
[5] D. Majumdar, “The Blue Baby Syndrome: Nitrate Poison- ing in Humans,” Resonance, Vol. 8, No. 10, 2003, pp. 20-
30. doi:10.1007/BF02840703
[6] M. C. Dutt, H. Y. Lim and R. K. H. Chew, “Nitrate Con- sumption and the Incidence of Gastric Cancer in Singa- pore,” Food and Chemical Toxicology, Vol. 25, No. 7,
1987, pp. 515-520. doi:10.1016/0278-6915(87)90202-X [7] E. Moore and E. Matalon, “The Human Costs of Nitrate-
Contaminated Drinking Water in the San Joaquin Valley,” Report of Pacific Institute, 2011.
[8] R. C. Parslow, G. R. Law, P. A. McKinney, A. Staines, R. Williams and H. J. Bodansky, “Incidence of Childhood Diabetes Mellitus in Yorkshire, Northern England, Is As- sociated with Nitrate in Drinking Water: An Ecological Study,” Diabetologia, Vol. 40, No. 5, 1997, pp. 550-556.
doi:10.1007/s001250050714
[9] J. Dich, R. Jarvinen, P. Knekt and P. L. Penttila, “Dietary Intakes of Nitrate, Nitrite and NDMA in the Finnish Mo- bile Clinic Health Examination Survey,” Food Additives
and Contaminants, Vol. 13, No. 5, 1996, pp. 541-552.
doi:10.1080/02652039609374439
[10] M. Eichholzer and F. Gutzwiller, “Dietary Nitrates, Ni- trites, and N-Nitroso Compounds and Cancer Risk: A Re- view of the Epidemiologic Evidence,” Nutrition Reviews,
Vol. 56, No. 4, 1998, pp. 95-105. doi:10.1111/j.1753-4887.1998.tb01721.x
[11] S. De Martin and P. Restani, “Determination of Nitrates by a Novel ion Chromatographic Method: Occurrence in Leafy Vegetables (Organic and Conventional) and Expo-
sure Assessment for Italian Consumers,” Food Additives
and Contaminants, Vol. 20, No. 9, 2003, pp. 787-792.
doi:10.1080/0265203031000152415
[12] J. Susin, V. Kmecl and A. Gregorcic, “A Survey of Ni- trate and Nitrite Content of Fruit and Vegetables Grown in Slovenia during 1996-2002,” Food Additives and Con-
taminants, Vol. 23, No. 4, 2006, pp. 385-390.
doi:10.1080/02652030600573715
[13] A. Petersen and S. Stoltze, “Nitrate and Nitrite in Vegeta- bles on the Danish Market: Content and Intake,” Food
Additives and Contaminants, Vol. 16, No. 7, 1999, pp.
291-299. doi:10.1080/026520399283957
[14] W. Zhong, C. Hu and M. Wang, “Nitrate and Nitrite in Vegetables from North China: Content and Intake,” Food
Additives and Contaminants, Vol. 19, No. 12, 2002, pp.
1125-1129. doi:10.1080/0265203021000014806
[15] A. Ayaz, A. Topeu and M. Yurttagul, “Survey of Nitrate and Nitrite Levels of Fresh Vegetables in Turkey,” Jour-
nal of Food Technology, Vol. 5, No. 2, 2007, pp. 177-179.
[16] T. Tamme, M. M. Reinik, M. Roasto, K. Juhkam, T. Tennc and A. Kiis, “Nitrates and Nitrites in Vegetables and Vegetable-Based Products and Their Intakes by the Estonian Population,” Food Additives and Contaminants,
Vol. 23, No. 4, 2006, pp. 355-361. doi:10.1080/02652030500482363
[17] P. Santamaria, A. Elia and F. Serio, “Ways of Reducing Rocket Salad Nitrate Content,” Acta Horticulture, Vol. 548, 2001, pp. 529-537.
[18] M. Andrews, “The Partitioning of Nitrate Assimilation between Root and shoot of Higher Plants,” Plant, Cell &
Environment, Vol. 9, No. 7, 2006, pp. 511-519.
[19] JECFA, “Evaluation of Certain Food Additives and Con- taminants,” WHO Technical Report Series 859, 1995, pp. 32-35.
[20] SCF Scientific Committee for Food, “Opinion on Nitrates and Nitrites,” Reports of the Scientific Committee for Food 38th Series, 1995, pp. 1-33.
[21] Y. Z. Su, Z. H. Zhang and R. Yang, “Amount of Irrigation and Nitrogen Application for Maize Grown on Sandy Farmland in the Marginal Oasis in the Middle of Heihe River Basin,” Acta Agronomica Sinica, Vol. 33, No. 1,
2007, pp. 2007-2015. (in Chinese)
[22] R. Yang and W. Liu, “Nitrate Contamination of Ground- water in an Agroecosystem in Zhangye Oasis, Northwest China,” Environmental Earth Sciences, Vol. 61, No. 1,
2010, pp. 123-129. doi:10.1007/s12665-009-0327-7 [23] J. Fang and Y. J. Ding, “Assessment of Groundwater Con-
tamination by NO3
Using Geographical Information
System in the Zhangye Basin, Northwest China,” Envi-
ronmental Earth Sciences, Vol. 60, No. 4, 2010, pp. 809-
816. doi:10.1007/s12665-009-0218-y
[24] C. Y. Zhang, Z. Wang and X. X. Cheng, “Studies of Ni- trogen Isotopes in Sources of Nitrate Pollution in Ground- water beneath the City of Zhangye,” Journal of Arid Land
Resources & Environment, Vol. 18, No. 1, 2004, pp. 79-
85. (in Chinese)
“Assessing Impact of Irrigation Water on Groundwater Recharge and Quality in Arid Environment Using CFCs, Tritium and Stable Isotopes, in the Zhangye Basin, North- west China,” Journal of Hydrology, Vol. 405, No. 1-2, 2011, pp. 194-208. doi:10.1016/j.jhydrol.2011.05.023 [26] B. E. Gilbert, “The Adaptation of Certain Colorimetric
Methods to the Estimation of Nitrates, Phosphates and Po-
tassium in Plant Solutions,” Plant Physiology, Vol. 2, No.
2, 1926, pp. 191-199. doi:10.1104/pp.1.2.191