Realistic Vehicular Mobility Impact of FTM, IDM, IDM-IM
and IDM-LC on VANETs
Md. Habibur Rahman
Dept. of Computer ScienceAIUB, Bangladesh
Md. Monzur Morshed
TigerHATS Dhaka, BangladeshMeftah Ur Rahman
Dept. of Computer Science George Mason University, USAABSTRACT
VANETs are composed of a number of vehicles moving on city roads, able to interconnect with one another without a fixed infrastructure. Improvisation of a new vehicular communication system should entitle a node to travel safely with high speed mobility while maintaining seamless interconnectivity. To evaluate the impact of mobility models such as FTM, IDM, IDM-IM and IDM-LC on VANETs routing protocol, VanetMobiSim is introduced to design a realistic vehicular mobility model for an urban scenario of Dhaka city. The experimental results suggest several issues e.g. lower packet drop rate, delay, jitter and route cost, etc are required to be considered before preparing a realistic application of VANET. The simulation results have been measured by different performance metrics such as drop, delay, jitter, round-trip time, throughput, route cost and mean hop etc.
Keywords
VANET; AODV; AOMDV; DYMO; OLSR; FTM; IDM-IM; IDM-LC; IDM; IEEE 802.11p;
1.
INTRODUCTION
Vehicular Ad-Hoc Network (VANET) is an extension of Mobile Ad-Hoc Network (MANET). It characterizes a rapidly progressive research area. It is regarded as an extreme case of mobile ad hoc network. In vehicular ad hoc networks (VANETs), vehicles communicate with roadside units (RSUs), referred to as vehicle-to-infrastructure (V2I) communications. In addition, vehicles can communicate with each other in an infrastructure less mode, referred to as vehicle-to-vehicle (V2V) communications [1]. It is a vehicular communication system for traffic safety, transport efficiency and data service. It enables public safety applications that can preserve lives and advance traffic flow [2]. Compared to MANETs, VANETs simulation provides some unique features such as highly dynamic topology, frequently disconnected network, patterned mobility, propagation model, on-board sensors, unlimited battery power and storage in a vehicular environment [3]. VANETs routing protocols can be categorized into topology-based and geographic (Position-based) routing protocol. Topology-based routing protocols are used for links’ information that exists in the network to do packet forwarding. It can be divided into proactive and reactive routing protocol. The performance of the VANET routing protocol can vary by additional reasons such as communication mode, vehicle/node density fluctuations, and vehicle/node mobility [4]. The node mobility can be expressed as node position, velocity, acceleration and deceleration in existence of neighboring nodes, line up at road intersections, traffic jam made by cross roads, traffic lights, node density and traffic congestion [5]. It is tough to look at those factors, particularly in an extreme mobility case. The
IEEE 802.11p offers various stages of service importance based on different type of traffic pattern [1]. VanetMobiSim can provide the facility to design a real world mobility scenario of a particular area. It can be applied to dissect the traffic of a metropolis or a particular country. In this study, VanetMobiSim has been used to design a realistic vehicular mobility pattern for vehicular communications. For experimental evaluations, it is compared according to the impact of Fluid Traffic Model (FTM), Intelligent Driver Model (IDM), Intelligent Driver Model with Intersection Management (IDM-IM) and Intelligent Driver Model with Lane Changes (IDM-LC) etc. While doing this experiment, AODV, AOMDV, DYMO and OLSR routing protocols with respect to dissimilar parameter of QoS metrics have been used.
2.
RELATED WORK
Numerous surveys have been conducted to assess the performance of VANETs using several routing protocols along with different mobility models. In [4], the author has assessed the performance of Vehicular Ad-Hoc Networks using clustering of three different regions (urban, suburban and industrial) and traffic lights into the IDM-IM by AOMDV and AODV routing protocols with two dissimilar cases of traffic pattern. But the author has used existing IEEE 802.11b protocol instead of IEEE 802.11p MAC protocols. It is known that Wireless Access in Vehicular Environments (WAVE) or IEEE 802.11p provides enhancements to the physical and MAC layers. Likewise, several researchers use Two Ray Ground propagation model with IEEE 802.11b MAC protocol for comparing VANETs performance using different routing protocol, traffic pattern and various mobility models [5-9]. W. Alasmary et al. [1] presented the impact of mobility in IEEE 802.11p infrastructureless vehicular networks by investigating certain mobility factors. In their work, they indicated that relative speed has an important impact on channel access at the MAC layer, brushing off the number of communicating nodes. In [10], the authors have offered that 802.11p gives effective service differentiation mechanism that can be appropriate for the mission-critical ITS application. They evaluated the MAC layer performance without putting on any realistic vehicular mobility model for VANETs. V. Cabrera et al. [11] suggested some guidelines which could improve the performance of VANET routing such as store-carry-forward paradigm, beacons dependency, add useful information and careful selection of forwarding criteria. In their study, they have evaluated simulation-based study subject to vehicular mobility patterns.
3.
REVIEW OF ROUTING PROTOCOLS
the links will timeout and finally be removed from intermediate node routing tables [12-13]. Ad-Hoc On-demand Multipath Distance Vector (AOMDV) calculates link-disjoint paths and multiple loop-free paths but nodes are uninformed of comparative movement and positioning. The Link-disjoint feature of AOMDV ensures that no two parallel paths between a source-destination pair will receive a mutual connection [14-16]. Dynamic MANET On-demand (DYMO) routing protocol facilitates reactive, multi-hop unicast routing between participating DYMO routers. Routes are discovered on demand once a source node requires creating a route to the destination. Here, the Route Request messages flood the network using broadcast [17]. To optimize the performance of Optimized Link State Routing (OLSR) protocol, Multipoint Relay (MPR) nodes are applied to the number of packets broadcasted on the network during the flooding process. It provides optimal routes in terms of number of hops [18].
4.
MOBILITY MODEL
VanetMobiSim provides a realistic vehicular movement pattern. It includes vehicle to infrastructure (V2I) and vehicle to vehicle (V2V) association. It combines the traffic lights, stop signs and activity based macro-mobility. FTM defines traffic congestion scenarios, but still cannot reconstruct queuing situations, nor can it properly manage the behavior of cars in the presence of road intersections [19]. IDM describes driver’s behavior relating to their instantly earlier vehicle. This model defines car mobility on single lanes, but do not think through the case in which multiple vehicular flows have to interconnect, as to the existence of intersections [19]. IDM-IM is capable of smart intersection management as well as slow down and stop at crossroads, or act according to traffic lights, if present. In both situations, it only behaves on the first vehicle on each road, as IDM automatically adjusts the behavior of cars behind the leading car [19]. IDM-LC mobility model provides opportunities for vehicles to alternate lanes and overtaking among other vehicles in the presence of multi-lane roads. These two features occur with parting of traffic flows on different lanes of the similar roads and the overtaking model itself [19].
4.1
System Model
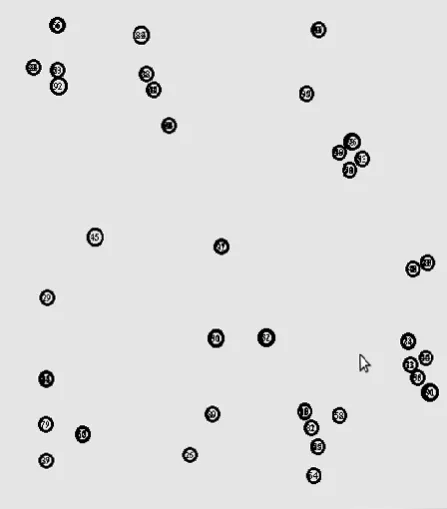
The system model demonstrated a realistic vehicular mobility model in a particular area of Dhaka city using FTM, IDM-IM, IDM-LC and IDM mobility model to see the traffic status of the area as shown Figure 1. In four mobility models, the number of interaction with a traffic light is 500. The length of Traffic light is 10 second. Two lanes have been used in the study. The maximum number of multi-lane roads is 10. The Six seconds is the maximum stay duration at destination. The two second is the minimum stay duration at destination. In IDM-IM and IDM-LC, the maximal acceleration of vehicle movement is 0.6 m/s2. The “comfortable” deceleration of vehicle movement is 0.9 m/s2. “1 m” distance to a standing node (jam distance) is kept at a minimum. The safe time headway for a node is “0.5 sec”. The step for recalculating movement parameter is 1 (one) second. The intersections at the borders of the map are ignored. The vehicle length is 5 meters. The visibility distance is 200 meters. In IDM-LC, the politeness factor of drivers when changing lane is 0.5 meters. The threshold acceleration for lane change is 0.5 m/s2. The maximum “safe” deceleration is 2 m/s2. In FTM, the jam
[image:2.595.315.543.72.369.2]distance is “1 meter”.
Figure 1: Demonstration of mobility model for simulation
5.
SIMULATION PARAMETERS
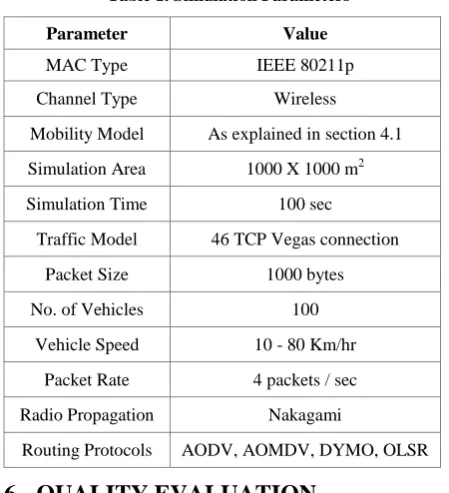
All nodes use 802.11p MAC operation at 6Mbps. The transmission range is 250 meters. For vehicular safety communication, it has broadcasted message between vehicles. For experimental purposes, the simulation area is 1000 X 1000 m2. The real world simulation area is more eminent than the simulation area used this study. Figure 2 demonstrated the simulation topology in NS2 environment.
[image:2.595.317.541.488.743.2]Table 1. Simulation Parameters
Parameter Value
MAC Type IEEE 80211p
Channel Type Wireless
Mobility Model As explained in section 4.1 Simulation Area 1000 X 1000 m2 Simulation Time 100 sec
Traffic Model 46 TCP Vegas connection Packet Size 1000 bytes
No. of Vehicles 100
Vehicle Speed 10 - 80 Km/hr Packet Rate 4 packets / sec Radio Propagation Nakagami
Routing Protocols AODV, AOMDV, DYMO, OLSR
6.
QUALITY EVALUATION
For Quality evaluation, it is presented QoS (Quality of Service) metrics with other performance metrics.
6.1
QoS Metrics
6.1.1
Drop
The packet drop is counted by the total number of packets dropped when a source node transmits data packet through the network for the destination node. The lower drop rate indicates better performance in VANETs. Packet drop (Pd)
can be estimated using Eq. 1.
(1)
-
s r d PP
PWhere, Pr and Ps are the number of packets received and sent.
6.1.2
Throughput
Throughput means the total number of packets that have been successfully delivered to the destination nodes. Normally, throughputs are measured in kbps, Mbps and Gbps. The higher throughput result shows better performance. Throughput (Th) can be defined as Eq. 2.
(2)
NTh t
Where, Nt is the number of data packet bytes in a particular
time.
6.1.3
Delay
A particular packet is transmitted from source to destination and calculates the difference between sending times and received times. The data were collected only successfully delivered packets. The packet delay always expected lower in VANETs. Delay (Di) can be defined as Eq. 3.
(3)
-=
R
S
D
i t tWhere, Rt and St are the time of packet received and
transmitted.
6.1.4
Jitter
Jitter is the variance of the packet arrival time. The delays between the different packets need to be low for best performance in VANETs. Jitter (Ji) can be defined by Eq. 4.
(4)
n
...
2
1,
=
i
where,
-
D
D
J
i
i1 i6.1.5
Round-trip Time (RTT)
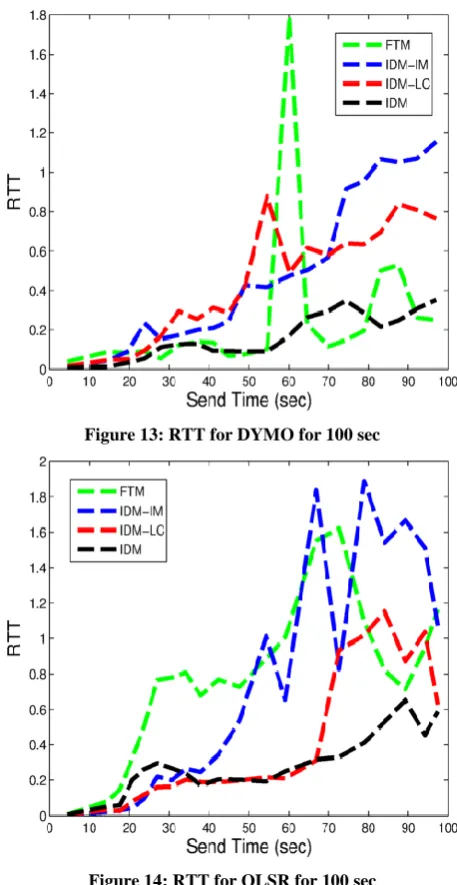
RTT is the time needed for a TCP packet to transmit from a particular source node to a particular destination node and come back with acknowledgment to source node from destination node. RTT of the TCP packets is needed to be low for best performance in VANETs. RTT (Ri) can be defined by
Eq. 5.
(5)
n
...
3
2,
1,
=
i
where,
-
S
A
R
i
i iWhere, Ai and Si are the time of TCP packet sent and
acknowledgement received.
6.2
Other Performance Metrics
6.2.1
Average Throughput
The amount of data transmitted by the network divided by time period. It is the sum of data rates that are delivered to all vehicles in VANETs. Average throughput (Ah) can be
calculated using Eq. 6.
(6)
1000
8
*
T N n t
AhWhere, Tn is the total number of vehicles.
6.2.2
Normalized Routing Load (NRL)
The total number of routing packets transmitted per data packet sent at the destination. Each hop-wise transmission of a routing is counted as one transmission. It is the sum of all control packets sent by all vehicles in the area to discover and maintain the route. Normalized Routing Load (Nl) is
calculated by Eq. 7.
(7)
P R N r p lWhere, Rp is the number of routing packets in layer 2 (MAC).
6.2.3
Mean Hop
The total number of control or routing packets forwarded by routing protocol during the simulation to send data packet delivered to the destination. All packets sent or forwarded at the network layer is required at least one hop to the destination. Mean Hop (Mh) can be defined as Eq. 8.
(8)
1
=
P P M s f h
Where, Pf and Ps are the number routing packet forwarded and
sent respectively.
6.2.4
Packet Delivery Ratio (PDR)
The ratio of the data packets sent to the destination to those generated by the traffic sources. PDR is calculated by Eq. 9.
(9)
P P s rPDR
6.2.5
Routing Cost
It is the ratio of routing bytes to traffic packet bytes. Routing Cost (Rc) can be calculated using Eq. 10.
Where, Nr is the number route bytes and Nt is the number of
traffic packet bytes.
7.
RESULT ANALYSIS
The simulation result is achieved by using the four topology-based routing protocols in VANETs. The experiment is implemented using VanetMobiSim and NS2 (NS 2.34 and NS 2.35) in an Intel (R) Core (TM) i7-2670QM 2.20GHz machine running on 4GB RAM, Windows 7 and Ubuntu 10.04 platform. To evaluate the impact of four mobility models in VANETs we considered the protocols with respect to QoS metrics and other performance evaluation metrics.
7.1
Quantitative Verification
The quantitative comparison measures the performance of AODV, AOMDV, DYMO, and OLSR routing protocol using FTM, IDM, IDM-IM and IDM-LC realistic mobility model in Vehicular Ad-Hoc Networks along with dissimilar parameter of QoS metrics such as delay, jitter, round-trip time, packet drop and throughput for understanding the behavior of TCP Vegas traffic packet in the dynamic network simulation scenario. It also compares mobility impact of those routing protocol performances with several other performance evaluation metrics such as Packet Delivery Ratio (PDR), Route Cost, Mean hop, Average Throughput and Normalized Routing Load (NRL). The presented simulation results in the following Table 2-17 and Figure -13.
Table 2. Number of packet drop for AODV
Packet Type Mobility Model Total Sent packets Total Received packets Total Dropped packets TCP Vegas
FTM 51384 50453 931
IDM-IM 64698 63729 969 IDM-LC 59733 58818 915
IDM 61044 60072 972
Table 3. Number of packet drop for AOMDV
Packet Type Mobility Model Total Sent packets Total Received packets Total Dropped packets TCP Vegas
FTM 41862 40861 1001
IDM-IM 71221 70559 662 IDM-LC 65363 64638 725
IDM 64695 63981 714
Table 4. Number of packet drop for DYMO
Packet Type Mobility Model Total Sent packets Total Received packets Total Dropped packets TCP Vegas
FTM 21817 21055 762
IDM-IM 58174 57396 778 IDM-LC 55183 54446 737
IDM 54842 54154 688
Table 5. Number of packet drop for OLSR
Packet Type Mobility Model Total Sent packets Total Received packets Total Dropped packets TCP Vegas
FTM 31881 31118 763
IDM-IM 47443 46654 789 IDM-LC 53353 52646 707
IDM 62191 61494 697
Table 6. Throughput for AODV
Packet Type Mobility Model Total Sending Throughput (kbps) Total Receiving Throughput (kbps) TCP Vegas
FTM 51384000 50453000
IDM-IM 64698000 63729000 IDM-LC 59733000 58818000
IDM 61044000 60072000
Table 7. Throughput for AOMDV
Packet Type Mobility Model Total Sending Throughput (kbps) Total Receiving Throughput (kbps) TCP Vegas
FTM 41862000 40861000
IDM-IM 71221000 70559000 IDM-LC 65363000 64638000
IDM 64695000 63981000
Table 8. Throughput for DYMO
Packet Type Mobility Model Total Sending Throughput (kbps) Total Receiving Throughput (kbps) TCP Vegas
FTM 21817000 21055000
IDM-IM 58174000 57396000 IDM-LC 55183000 54446000
IDM 54842000 54154000
Table 9. Throughput for OLSR
Packet Type Mobility Model Total Sending Throughput (kbps) Total Receiving Throughput (kbps) TCP Vegas
FTM 31881000 31118000
IDM-IM 47443000 46654000 IDM-LC 53353000 52646000
Table 10. PDR, Drop and Avg. Throughput for AODV
Packet Type
Mobility Model
PDR (%)
Drop (%)
Average Throughput
(kbps)
TCP Vegas
FTM 98.19 1.81 4094.47 IDM-IM 98.50 1.50 5171.80 IDM-LC 98.47 1.53 4773.26 IDM 98.41 1.59 4875.08
Table 11. PDR, Drop and Avg. Throughput for AOMDV
Packet Type
Mobility Model
PDR (%)
Drop (%)
Average Throughput
(kbps)
TCP Vegas
[image:5.595.312.540.366.684.2]FTM 97.61 2.39 3315.98 IDM-IM 99.07 0.93 5726.06 IDM-LC 98.89 1.11 5245.56 IDM 98.90 1.10 5192.32
Table 12. PDR, Drop and Avg. Throughput for DYMO
Packet Type
Mobility Model
PDR (%)
Drop (%)
Average Throughput
(kbps)
TCP Vegas
FTM 96.51 3.49 1708.70 IDM-IM 98.66 1.34 4357.85 IDM-LC 98.66 1.34 4418.45 IDM 98.75 1.25 4418.45
Table 13. PDR, Drop and Avg. Throughput for OLSR
Packet Type
Mobility Model
PDR (%)
Drop (%)
Average Throughput
(kbps)
TCP Vegas
FTM 97.61 2.39 2525.38 IDM-IM 98.34 1.66 3786.14 IDM-LC 98.67 1.33 4272.41 IDM 98.88 1.12 4990.43
Table 14. NRL, Route Cost and Mean hop for AODV Packet
Type
Mobility
Model NRL
Route Cost
Mean Hop
TCP Vegas
FTM 1.130 0.010 1.0284 IDM-IM 0.738 0.007 1.0200 IDM-LC 0.766 0.007 1.0207 IDM 0.857 0.008 1.0208
Table 15. NRL, Route Cost and Mean hop for AOMDV Packet
Type
Mobility
Model NRL
Route Cost
Mean Hop
TCP Vegas
FTM 1.007 0.010 1.0272 IDM-IM 0.499 0.006 1.0112
IDM-LC 0.544 0.006 1.0121 IDM 0.553 0.006 1.0081
Table 16. NRL, Route Cost and Mean hop for DYMO Packet
Type
Mobility
Model NRL
Route Cost
Mean Hop
TCP Vegas
FTM 1.753 0.016 1
IDM-IM 0.466 0.004 1
IDM-LC 0.509 0.005 1
IDM 0.498 0.005 1
Table 17. NRL, Route Cost and Mean hop for OLSR Packet
Type
Mobility
Model NRL
Route Cost
Mean Hop
TCP Vegas
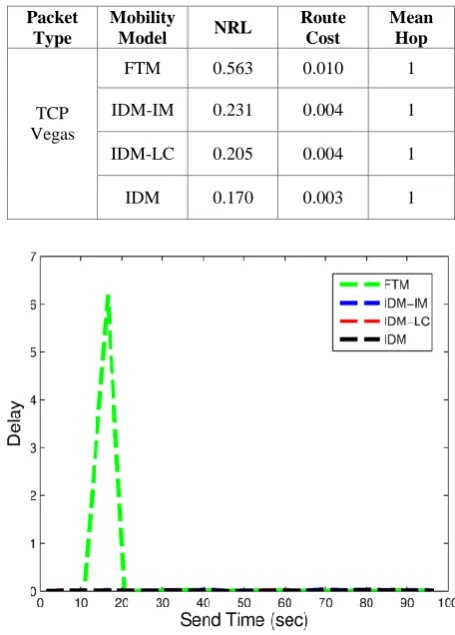
FTM 0.563 0.010 1
IDM-IM 0.231 0.004 1
IDM-LC 0.205 0.004 1
IDM 0.170 0.003 1
Figure 4: Delay for AOMDV for 100 sec
[image:6.595.52.289.63.684.2]Figure 5: Delay for DYMO for 100 sec
[image:6.595.314.542.64.671.2]Figure 6: Delay for OLSR for 100 sec
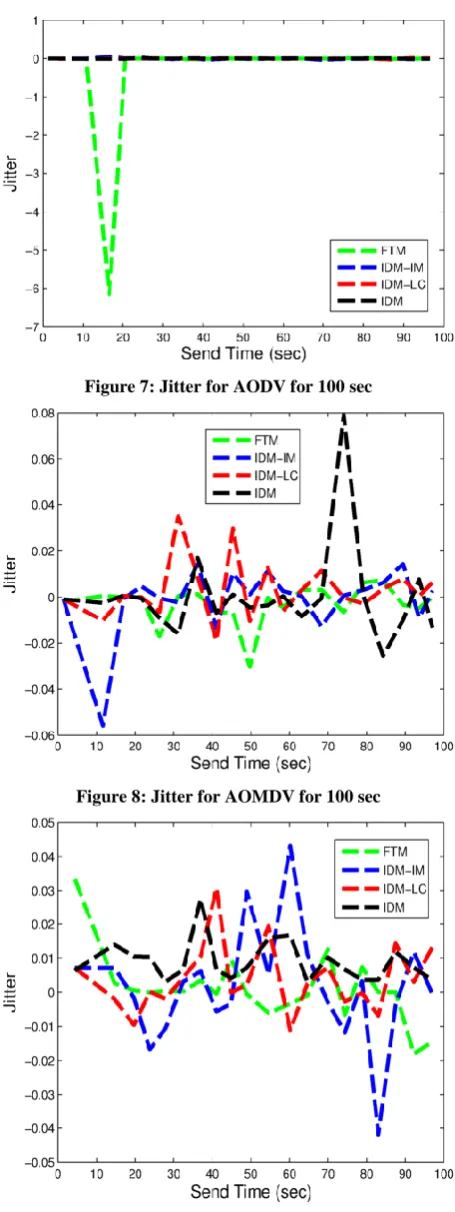
Figure 7: Jitter for AODV for 100 sec
Figure 8: Jitter for AOMDV for 100 sec
Figure 10: Jitter for OLSR for 100 sec
Figure 11: RTT for AODV for 100 sec
[image:7.595.312.541.67.510.2]Figure 12: RTT for AOMDV for 100 sec
Figure 13: RTT for DYMO for 100 sec
Figure 14: RTT for OLSR for 100 sec
8.
CONCLUSIONS
IDM, IDM-IM and IDM-LC mobility model on AODV, AOMDV, DYMO and OLSR routing protocol performances were not up to the mark for each of the parameters of performance metrics/QoS metrics towards the development of realistic vehicular applications.
9.
REFERENCES
[1] W. Alasmary and W. Zhuang, “Mobility impact in IEEE 802.11p infrastructureless vehicular networks,” Journal in Ad Hoc Network, Mar. 2010.
[2] D. Jiang and L. Delgrossi, “IEEE 802.11p: Towards an international standard for wireless access in vehicular environments,” pp. 2036-2040, 2008.
[3] T. Kaur and A. Verma, “Simulation and analysis of AODV routing protocol in VANETs,” Int. Journal of Soft Computing and Engineering (IJSCE), Vol. 2(3), pp. 293-301, Jul. 2012.
[4] V. Godbole, “Intelligent driver mobility model & traffic pattern generation based optimization of reactive protocols for vehicular ad-hoc networks,” International Journal of Information and Network Security (IJINS), Vol. 2(3), pp. 207–214, Jun. 2013.
[5] R. Boopathi and R. Priya, “Performance evaluation of AODV and OLSR in VANET under realistic mobility pattern,” Int. Journal of Electronics and Communication Engineering & Technology, Vol. 4(2), pp. 58-71, 2013. [6] S. Xu, P. Guo, B. Xu and H. Zhou, “QoS evaluation of
VANET routing protocols,” Journal of Networks, Vol. 8(1), pp. 132-139, Jan. 2013.
[7] H. Wang, G. Tan and J. Yang, “An improved VANET intelligent forward decision-making routing algorithm,” Journal of Networks, Vol. 7(10), pp. 1546-1553, Oct. 2012.
[8] M. Jerbi, S. Senouci and Y. Ghamri-Doudane, “Towards efficient geographic routing in urban vehicular networks,” Trans. on Vehicular Technology, Vol. 58(9), pp. 5048-5059, Nov. 2009.
[9] K. Lan and C. Chou, “Realistic mobility models for vehicular ad hoc network (VANET) simulations,” 8th Int.
Conf. on ITS Telecommunications, pp. 362-366, Oct. 2008.
[10]C. Han, M. Dianati, R. Tafazolli, R. Kernchen and X. Shen, “Analytical study of the IEEE 802.11p MAC sub-layer in vehicular networks,” Trans. on Intelligent Transportation Systems, Vol. 13(2), 873-886, Jun. 2012. [11]V. Cabrera, F. Ros and P. Ruiz, “Simulation-based study
of common issues in VANET routing protocols,” 69th Vehicular Technology Conference, 2009.
[12]S. Gwalani, E. Belding-Royer and C. Perkins, “AODV-PA: AODV with path accumulation,” Int. Conf. on Communications, Vol. 1 pp. 527-531, May 2003. [13]X. Du, Y. Wang, J. Ge and Y. Wang, “A method for
security enhancements in AODV protocol,” 17th Int. Conf. Proc. on Advanced Information Networking and Applications (ICPAINA), pp. 237-240, Mar. 2003. [14]A. Chintawar, M. Chatterjee and A. Vidhate,
“Performance analysis of ad-hoc on-demand multipath distance vector routing protocol with accessibility and link breakage prediction,” 2nd Int. Conf. and Workshop on Emerging Trends in Technology (ICWET), 2011. [15]S. Mallapur and S. Terdal, “Enhanced ad-hoc on-demand
multipath distance vector routing protocol (EAOMDV),” International Journal of Computer Science and Information Security (IJCSIS), Vol. 7(3), Mar. 2010. [16]S. Kumar, S. Khimsara, K. Kambhatla, K. Girivanesh, J.
Matyjas, and M. Medley, “Robust on-demand multipath routing with dynamic path upgrade for delay sensitive data over ad hoc networks,” Journal of Computer Networks and Communications, 2013.
[17]C. Perkins, S. Ratliff and J. Dowdell, “Dynamic manet on-demand routing,” IETF Internet Draft, draft-ietf-manet-dymo-26.pdf, Feb. 25, 2013.
[18]T. Clausen and P. Jacquet, “Optimized link state routing protocol for ad-hoc networks,” Network Working Group, Internet Draft, rfc3626.txt, Oct. 2003.
[19]M. Fiore, J. Härri, F. Fethi, and C. Bonnet, “Vehicular mobility simulation for VANETs,” 40th IEEE Annual