2017 2nd International Conference on Software, Multimedia and Communication Engineering (SMCE 2017) ISBN: 978-1-60595-458-5
A New Integrating Multi-features C5.0 Decision Tree Method for
Classification of Tropical Rubber Woods Using
High-resolution Remote Sensing Image
Hong-wei YANG*, Chen-guang ZHANG, Ying-hong LONG,
Huai-jin HU and Yan SONG
College of Information Science & Technology, Hainan University, No. 58, Renmin Avenue, Haikou City, Hainan Province, 570228, P.R. China
*Corresponding author
Keywords: Classification of rubber woods, High-resolution remote sensing image, Integrating multi-features C5.0 decision tree (IMFC5) method.
Abstract. In order to classify rubber woods using high-resolution remote sensing images, an integrating multi-features C5.0 decision tree (abbreviated as IMFC5) classification method is proposed. The procedure of IMFC5 is as follows: (1) images are pre-processed, all features are collected and integrated into one file; (2) decision features are obtained by the use of BFDFS method, and the classification rules are built; (3) the output is obtained after executing the classification rules and carrying out classification post-processing. The proposed method is tested in an experimental area of Guangba Farm, Dongfang City, Hainan Island, China. The results indicate that producer accuracy, user accuracy, total accuracy of rubber woods, and Kappa coefficient are 88%, 91.67%, 92%, and 0.89, respectively. All four indices are better than the other classification methods’, proving feasibility and efficiency of the proposed method.
Introduction
The distribution and growth status of rubber woods is critical for the extraction of natural rubber, which plays an irreplaceably important role in industries, transportation, agriculture, national defense industry, and so on. However, the investigation and survey of rubber woods are time-intensive activities. Therefore, it is necessary to study the automatic classification of rubber woods from remote sensing images1,2 (Sinha et al., 2015; Dewan and Yamaguchi, 2009).
There has been some research on the classification of rubber woods using remote sensing images 3,4(Grogan, 2015; Chen, 2012). However, the current study mainly focuses on the medium- or low-resolution remote sensing images, and low-accuracy classification 3,4,5,6,7,8(Grogan et al., 2015; Chen et al., 2012; Chen et al., 2015; Dong et al., 2013; Li et al., 2012; Mialhe et al., 2015). In order to provide accurate distribution and detailed status of rubber woods, high-resolution images are needed for their detailed information. Unfortunately, few researches about classification method of rubber woods based on high-resolution remote sensing image have been studied till now.
Experimental Area and Data
Study Area
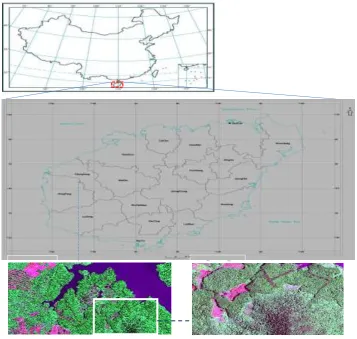
Guangba Farm, Dongfang City, was selected as study area, located to the southwest of Hainan Island, China (Figure 1). A typical area was selected as shown in Figure 1.
Data
1) High-resolution remote sensing images
The high-resolution remote sensing images of QuickBird, taken on July 6, 2012, were used in this experiment.
2) Digital Elevation Model (DEM)
The Advanced Space-borne Thermal Emission and Reflection Radiometer Global Digital Elevation Model (ASTER GDEM), which has a resolution of 30 m, was used in our experiment.
3) Ground truth data
Some ground truth data were derived by GPS between May 2 and May 6, 2015.
Scene A
[image:2.595.121.479.289.628.2]Scene B
resampling of the remote sensing images will be done. We fused panchromatic images with respective spectral imageries, then, multi-spectral images provide detailed information, much like panchromatic images, and also preserve their own spectral information. Finally, we cut remote sensing images to obtain fit area according the experimental needs. Resulting cut image is displayed in Scene B of Figure 1.
Integrating Multi-features C5.0 Decision Tree (IMFC5)
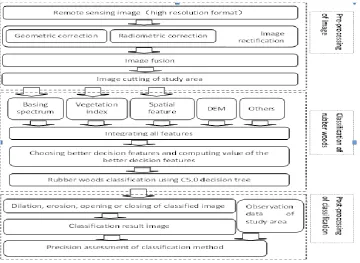
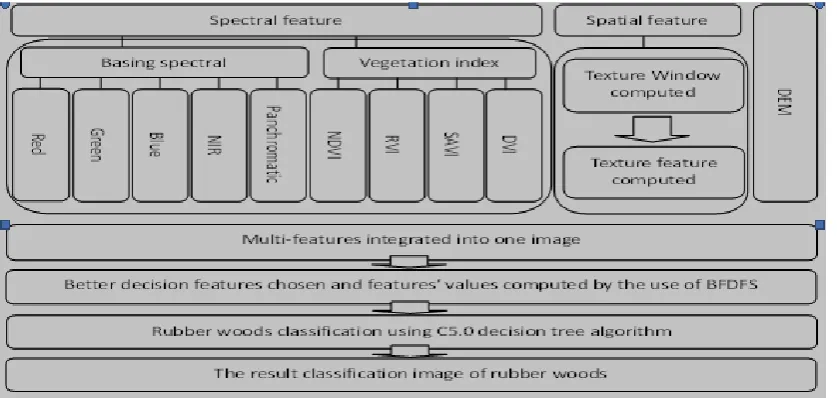
[image:3.595.118.479.232.495.2]The IMFC5 method has been prospected in this section for more accurate classification of rubber woods, whose framework is displayed in Figure 3. It consists of four components: obtaining multi-features data, integrating multi-features data, BFDFS for IMFC5, building and executing rules of IMFC5 to get the desired results.
Figure 2. Framework of rubber woods classification from high-resolution remote sensing image. 1. Obtaining multi-features data
(1) Spectral features and vegetation index features data
High-resolution remote sensing images (QuickBird) were collected in our study, which mainly include red, green, blue, NIR, and panchromatic spectral features data. All spectral features data can be obtained from the remote sensing images directly.
Figure 3. Framework of IMFC5.0 method. (2) Spatial features data
Spatial features are generally shown to us in terms of texture, location, length, area, and so on10 (Russ, 1999). The spatial features data of low- or medium-resolution remote sensing images cannot be obtained easily because of their low resolution. However, for high-resolution remote sensing images, the spatial features can be obtained by computing after achieving the fit window’s size. The fit window’s size can be got by the use of semi-variance method11,12
(Coburn, 2004; Treitz, 2001) and gray level co-occurrence matrix (GLCM) method is used to compute the texture13 (Bharati, et al., 2004) at last.
(3) DEM features data
DEM is an effective tool for distinguishing one land object from the others because some land objects live only in an area of fit elevation, e.g., rubber woods always grow in areas with elevation less than 500 m ; 300 m is the highest elevation in Hainan Island, China. Therefore, DEM features data (ASTER GDEM format) were collected in our study.
Besides these decision features, other useful features that can be used for rubber woods classification, such as GIS data, were collected. In our study area, other data cannot be obtained easily. Hence, only three types of decision features described in the following sections were identified.
2. Integrating multi-features data
All collected features should be integrated together as required for decision tree method. The process of integrating multi-features includes standardizing spatial resolution of all the images, correcting images according to the same standard, and finally, cutting all images. In our study, we unified all spectral feature images, vegetation index images, and spatial feature images into the World Geodetic System-1984 coordinate system, interpolated values in DEM image according to the spatial resolution of remote sensing image, corrected DEM image according to the remote sensing image, cut all images according to the same area, and stacked all images into one file using ENVI software.
For an attribute variable T, there are n class types of S, the condition entropy of the attribute T can be defined as
Cinfo(T) = − ∑𝑛𝑖=1((|𝑇𝑖|
|𝑇|) × 𝑖𝑛𝑓𝑜(𝑇𝑖)) (12)
The information gains of T can be expressed as
Gain(T) = info(s) − Cinfo(T) (13) Hence, the ratio of information gains can be expressed as
Gainrto(T) =𝐺𝑎𝑖𝑛(𝑇)
𝑖𝑛𝑓𝑜(𝑠) (14)
When we use C5.0 decision tree algorithm, the maximum of Gainrto(T) is the judgment index of the decision features being chosen.
4. Building and executing the rules of IMFC5 to get the required image
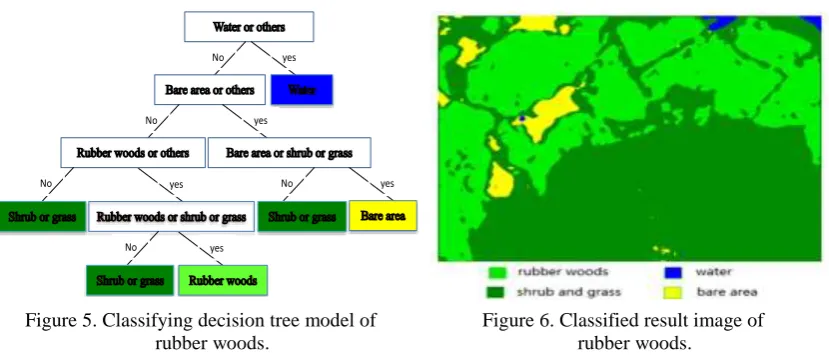
After getting the better-fit decision features and their intervals, we can build the fit decision tree model to discriminate the rubber woods based on IMFC5 and get a classified image after executing the decision tree model.
Post-processing of Classification
In this paper, we carried out the majority/minority analyst method for de-noising, and the size of the texture window was selected as the processing window size, and the error matrix was used to assess the precision of the classification method, its overall accuracy, producer’s accuracy, user’s accuracy, and Kappa coefficient17 (Congalton,1991).
Experiment, Results, and Discussion
In experiment, we get the experimental image by cutting from the original high resolution remote sensing image, the new image’s length is 0.8 m and width is 0.7 m. We fuse the red, NIR and green of the remote sensing image, the result image is displayed in Scene B of Figure 1. In addition, the DEM data that spatial resolution is 30 m in this experimental area is prepared well too.
Figure 4. Semi-variance analysis graph of four land objects. (SAVI is the soil adjusted vegetation index, Red is the red spectrum, RVI is the ratio vegetation index, NIR is the near infrared spectrum, NDVI is the normalized difference
vegetation index, Green is the green spectrum, Blue is the blue spectrum.)
We classify roughly the land object into four types, which are rubber woods, shrub and grass, bare land and water, and we select NAVI, SAVI (the L value is 0.5), RVI, red, NIR, green, blue to do the texture computation, then the semi-variance analysis is done to get the best fit window size of texture computation of every land objects, and the results are displayed in Figure 4.
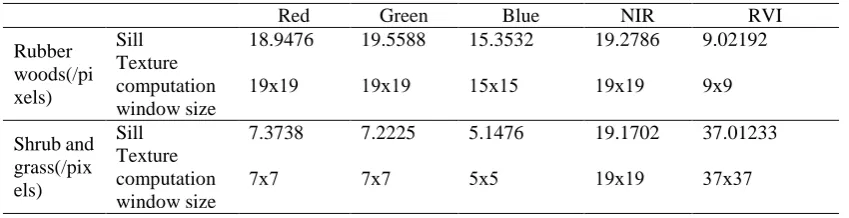
Table 1. Semi-variance function’s value and fit texture computation window size of the rubber woods, shrubs, and grass.
Red Green Blue NIR RVI
Rubber woods(/pi xels)
Sill 18.9476 19.5588 15.3532 19.2786 9.02192
Texture computation window size
19ⅹ19 19ⅹ19 15ⅹ15 19ⅹ19 9ⅹ9
Shrub and grass(/pix els)
Sill 7.3738 7.2225 5.1476 19.1702 37.01233
Texture computation window size
7ⅹ7 7ⅹ7 5ⅹ5 19ⅹ19 37ⅹ37
In order to distinguish rubber woods from shrubs and grass more accurately, we compared the semi-variance function analysis curves of every spectrum and vegetation index of rubber woods, shrubs, and grass. At last, the sill, vegetation index, fit window size, and fit spectrum were determined for texture computation, which are displayed in Table 1.
For the convenience of expression, we defined a rule of expressing the texture features, e.g., land object (texture name (spectrum or vegetation index, window size)).
[image:6.595.87.512.397.506.2]Table 2. Decision tree classification rules of rubber woods extraction.
Land objects Rules
Rubber woods
Rule 1: if ((SAVI < -1.496 or SAVI >-0.417 or (SAVI > -1.494 and SAVI <-1.305) ) and ((mean(GREEN,19) <= 139.816) and (mean(GREEN,19) >= 44) and ((DEM >= 4) and (DEM <= 70))) and (mean(NIR,19) >= 101 and mean(NIR,19) <= 215) then class=” Rubber woods”
Shrub and grass
Rule 1: if ((SAVI >= -1.305) and (SAVI <= -0.417)) and ((RVI <= 0.029) and (RVI >= 0.565)) then class=” Shrub and grass”
Rule 2: if ((SAVI < -1.496 or SAVI >-0.417) or (SAVI > -1.494 and SAVI <-1.305) ) and ((mean(GREEN,19) > 139.816) or (mean(GREEN,19) < 44) and ((DEM < 4) or (DEM > 70)) then class=” Shrub and grass”
Rule 3: if ((SAVI < -1.496 or SAVI >-0.417 or (SAVI > -1.494 and SAVI <-1.305) ) and ((mean(GREEN,19) <= 139.816) and (mean(GREEN,19) >= 44) and ((DEM >= 4) and (DEM <= 70))) and (mean(NIR,19) < 101 or mean(NIR,19) > 215) then class=” Shrub and grass”
Water Rule 1: if (SAVI >= -1.496 and SAVI <= -1.494) then class=”Water”
Bare area Rule 1: if (SAVI >= -1.305) and (SAVI <= -0.417) and (RVI >= 0.029) and (RVI <= 0.565) then class=”Bare area”
[image:7.595.94.509.70.250.2]Ground truth ROIs (regions of interest) are generated randomly from the QuickBird high-resolution remote sensing images by visual interpretation and GCPs. By comparing the classification results with the ground truth ROIs and GCPs, the error matrix of rubber woods classification is prepared as displayed in Table 3. From Table 3, we can see that total accuracy is 92.00%, Kappa efficient is 0.89, user accuracy of rubber woods is 91.67%, and producer accuracy of rubber woods is 88.00%.
Table 3. Rubber woods classification accuracy evaluation using IMFC5.
Reference image
Evaluated image Rubber
woods
Shrub and
grass Bare area water
Total samples
Producer accuracy/ %
Rubber woods 88 12 0 0 100 88.00
Shrub and
grass 8 87 5 0 100 87.00
Bare area 0 6 94 0 100 94.00
Water 0 0 1 99 100 99.00
Total samples 96 105 100 99 400 --
User
accuracy/% 91.67 82.86 94.00 100 -- --
Total accuracy: (368/400)×100%=92.00% kappa=0.89
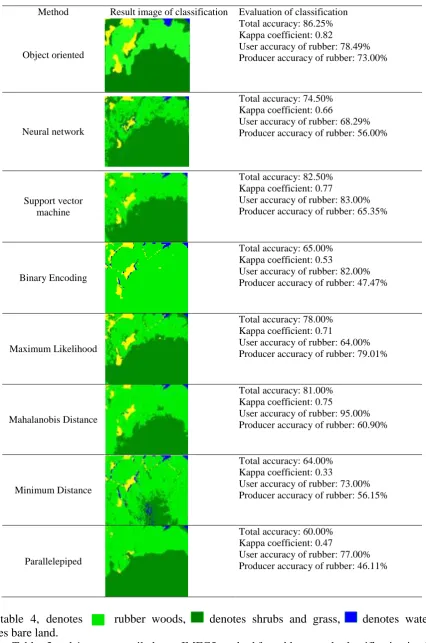
Many other methods are used to extract rubber woods, and classified images and accuracy evaluation results are displayed in Table 4.
Figure 6. Classified result image of rubber woods.
yes No
yes No
No yes yes
yes No
No
[image:7.595.92.506.587.742.2]Table 4. Classified results and accuracy evaluation of the other method. Method Result image of classification Evaluation of classification
Object oriented
Total accuracy: 86.25% Kappa coefficient: 0.82
User accuracy of rubber: 78.49% Producer accuracy of rubber: 73.00%
Neural network
Total accuracy: 74.50% Kappa coefficient: 0.66
User accuracy of rubber: 68.29% Producer accuracy of rubber: 56.00%
Support vector machine
Total accuracy: 82.50% Kappa coefficient: 0.77
User accuracy of rubber: 83.00% Producer accuracy of rubber: 65.35%
Binary Encoding
Total accuracy: 65.00% Kappa coefficient: 0.53
User accuracy of rubber: 82.00% Producer accuracy of rubber: 47.47%
Maximum Likelihood
Total accuracy: 78.00% Kappa coefficient: 0.71
User accuracy of rubber: 64.00% Producer accuracy of rubber: 79.01%
Mahalanobis Distance
Total accuracy: 81.00% Kappa coefficient: 0.75
User accuracy of rubber: 95.00% Producer accuracy of rubber: 60.90%
Minimum Distance
Total accuracy: 64.00% Kappa coefficient: 0.33
User accuracy of rubber: 73.00% Producer accuracy of rubber: 56.15%
Parallelepiped
Total accuracy: 60.00% Kappa coefficient: 0.47
Conclusions
In this paper, a new classification method (IMFC5) of rubber woods based on high-resolution remote sensing image has been proposed, was tested in Guangba Farm, Dongfang City, Hainan Island, China.
The IMFC5 method is feasible and efficient for identifying rubber woods. In IMFC5, all spectrums, spatial, and DEM features are constructed and integrated. The better-fit features that are useful for rubber woods classification are chosen for the C5.0 decision tree algorithm. The classification accuracy of IMFC5 is better than the others methods in terms of the producer accuracy, user accuracy, total accuracy, and the Kappa coefficient, which were 88%, 91.67%, 92%, and 0.89, respectively.
On the other hand, geometric correction was found to be difficult in the classification of rubber woods using high-resolution remote sensing images. The main reason is that rubber trees are planted in tropical areas, where the main vegetation is evergreen, making the identification of GCPs difficult. This will affect the accuracy of the classification output. The improvement of the geometric correction accuracy of the high-resolution remote sensing image in a tropical area needs to be studied further.
Moreover, the procedure of automatic building C5.0 decision tree model for rubber woods classification needs to be studied further. The C5.0 decision tree model of rubber woods classification is prepared based on the experiences of users. Hence, the procedure of automatically building the C5.0 decision tree model also needs to be studied further.
Acknowledgements
This paper was substantially supported by the National Natural Science Foundation of China (Project no. 61650303) and the Natural Science Foundation of Hainan province, China (Project no. 614225).
References
[1] Sinha, S., Sharma, L., Nathawat, M. Improved Land-use/Land-cover classification of semi-arid deciduous forest landscape using thermal remote sensing. The Egyptian Journal of Remote Sensing and Space Sciences, 18(2), 217-233 (2015), http://dx.doi.org/10.1016/j.ejrs.2015.09.005
[2] Dewan, A., Yamaguchi, Y. Land use and land cover change in Greater Dhaka, Bangladesh: Using remote sensing to promote sustainable urbanization. Applied Geography, 29, 390-401 (2009), http://dx.doi.org/10.1016/j.apgeog.2008.12.005
[3] Grogan, K., Pflugmacher, D., Hostert, P., Kennedy, R., Fensholt, R. Cross-border forest disturbance and the role of natural rubber in mainland southeast Asia using annual Landsat time series. Remote Sensing of Environment, 1-16 (2015), http://dx.doi.org/10.1016/j.rse.2015.03.001
[4] Chen, B., Cao, J., Wang, J., Wu, Z., Tao, Z., Chen, J., et al. Estimation of rubber stand age in typhoon and chilling injury afflicter area with Landsat TM data: A case study in Hainan island, China.
Forest Ecology and Management, 274, 222-230 (2012),
http://dx.doi.org/10.1016/j.foreco.2012.01.033
[5] Chen, B., Wu, Z., Wang, J., Dong, J., Guan, L., Chen, J., et al. Spatio-temporal prediction of leaf area index of rubber plantation using HJ-1A/1B CCD images and recurrent neural network. ISPRS
Journal of Photogrammetry and Remote Sensing, 102, 148-160 (2015),
http://dx.doi.org/10.1016/j.isprsjprs.2014.12.011
[7] Li, Z., M. Fox, J. Mapping rubber tree growth in mainland Southeast Asia using time-series MODIS 250 m NDVI and statistical data. Applied Geography, 32, 420-432 (2012), http://dx.doi.org/10.1016/j.apgeog.2011.06.018
[8] Mialhe, F., Gunnel, Y., Ignacio, J., Delbart, N., L. Ogania, J., Henry, S. Monitoring land-use change by combining participatory land-use maps with standard remote sensing techniques: Showcase from a remote forest catchment; on Mindanao, Philippines. International Journal of
Applied Earth Observation and Geoinformation, 36, 69-82 (2015),
http://dx.doi.org/10.1016/j.jag.2014.11.007
[9] Kasnuirangan, K. Ground based measurements for interpretation of vegetation indices over developing countries. Advances in Space Research, 17(8), 31-40 (1996).
[10]Russ, J. The image processing handbook, 3rd edition, CRC Press, Florida (1999).
[11]Coburn, C. A multiscale texture analysis procedure for improved forest stand classification. International Journal of Remote Sensing, 25(20), 4287-4308 (2004).
[12]Treitz, P. Variogram analysis of high spatial resolution remote sensing data: an examination of boreal forest ecosystems. International Journal of Remote Sensing, 22(18), 3895-3900 (2001), http://dx.doi.org/10.1080/01431160110069890
[13]Bharati, M., Liu, J., MacGregor, J. Image texture analysis: methods and comparisons.
Chemometrics and Intelligent Laboratory Systems, 72, 57-71 (2004),
http://dx.doi.org/10.1016/j.chemolab.2004.02.005
[14]Haralick, R., Shanmugam, K., Its’hak Dinstein. Textural features for image classification. IEEE Transactions on Systems Man and Cybernetics, 3(6), 610-621 (1973).
[15]Yang, HW, Sun, SJ. A new better-fit decision features selection method for C5.0 Decision tree. International Conference on Artificial Intelligence - Techniques and Applications (AITA), 99-109(2016).
[16]Quiland, J. R. C4.5: programs for machine learning. San Mateo, California: Morgan Kauffmann Publishers (1993).