2016 International Conference on Computer, Mechatronics and Electronic Engineering (CMEE 2016) ISBN: 978-1-60595-406-6
Analysis of Vulnerability Risk Using Game Model and Risk Matrix
Heng-wei ZHANG* and Tao LI
Zhengzhou Institute of Information Science and Technology, Zhengzhou, China
*Corresponding author
Keywords: vulnerability risk; Game model; Risk matrix; Comprehensive connection
Abstract: For the quantitative analysis of vulnerability risk in the information system, the paper
proposes the non-cooperative and nonzero-sum game model of vulnerability attack-defense, in which the value of vulnerability is evaluated by expected payoffs on the equilibrium. In the paper, with the two operators proposed, the comprehensive connection of the vulnerabilities is calculated through the quantitative analysis of the vulnerabilities connection using attack graph and risk matrix. Then the assessment method of system vulnerability risk is devised through the above vulnerability value and comprehensive connection. Based on the quantitative analysis of the vulnerabilities’ own risk and transmission risk, the proposed method comprehensively assesses the global risk of vulnerabilities, whose result can be used to recognize the key vulnerability and improve the effectiveness of system security defense. Finally the model and method proposed in this paper are proved to be valid through an example.
Introduction
In recent years, the manner of attacks against the information system has become diverse and complex. As vulnerability is the primary cause for successful attacks, comprehensive and accurate analysis of vulnerability risk is the key to improve the effectiveness of system security defense [1].
There exist two problems for the assessment of vulnerability risk based on attack graph and risk matrix. One is how to assess the value of vulnerability not considering risk transmission, which also means the assessment of potential loss caused independently by vulnerability. However, the methods proposed in [2][3][4] lack the restriction between attacker and defender. In essence, vulnerability is influenced by both attacker and defender. There is close dependence between vulnerability and the policy of attacker and defender. Assessment could not be comprehensive and objective only out of the attacker of defender.
The other problem is how to accurately assess the probability of multi-step attack using risk matrix. Zhou et al.[5] calculated the probability of multi-step attack qualitatively and quantitatively through analytic hierarchy process and attack recurrence method. But it depended on expertise and historical data much more.
vulnerabilities could be calculated precisely. Based on the above, the security administrator manages to recognize the critical vulnerability.
Related Definition
Definition 1. Vulnerability connectivity. In the actual attack-defense process, the attacker may use multiple vulnerability nodes to attain the goal. Then we define the probability of using the node ni to penetrate the node nj as vulnerability connectivitypij (0 pij 1). Vulnerability connectivity is closely related to information acquisition of the originating node ni, resource availability and attack complexity of the target node. Referring Common Vulnerability Scoring System to define vulnerability connectivity, information acquisition is referred to Access Vector. Resource availability is referred to Authentication, and attack complexity is referred to Access Complexity. Then the connectivity pij of the adjacent node between i and j is denoted as
i ij
i j i
AU p
AU AC AV
(1)
Definition 2. Risk matrix. Supposing VAG consists of several vulnerabilities, we define M as the risk
matrix of VAG, whose element indicates the connectivity of the two directly related vulnerabilities.
11 1
1
v
v vv
p p
M
p p
The diagonal elements of the matrix are zero, and pij implies the connectivity between the node ni
and the node nj. There is a corresponding relationship between risk matrix and attack graph. More
details can be referred to the literature [6].
Analysis of Vulnerability Value Based on Attack-Defense Game Model
Definition 3. Attack-defense game model. In this paper, the attack-defense game model is defined by
the five tuples NSADG(P B F AS DS, , , , ).
(1) P=
P Pa, d
indicates participant set of the game. Participant of the game is the subject of policy formulation and policy selection. Attack-defense game is a two-person game between attacker Pa anddefender Pd.
(2) B indicates the prior belief space of attacker and defender. B P( aH) and ( )
L a
B P are the prior belief of defender to attacker. We suppose B P( aH) denotes the attacker of high attack ability and B P( aL) denotes the attacker of low attack ability. B P( d) is the prior belief of attacker to defender. According to the primary theory, we can attain B P( aH)q, B P( aL) 1 q, B P( d) 1 .
(3) F=
fa,fd
is the payoff function of Pa and Pd. Different policies in the game would result indifferent payoffs for attacker and defender.
(4) AS, DS is the respective policy space of attacker and defender. AS
Ai 1 i m
indicates theattack policy set, and DS
Dj 1 j n
indicates the defense policy set.indicates the successful probability of attack policy when attack policy and defense policy is respectively implemented. Attack success rate can be gotten through the analysis of historical data.
Assessment of Vulnerability Risk Based On Risk Matrix
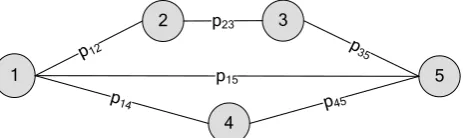
Because of the independence of each other, the value and the connectivity of vulnerability node are used to assess vulnerability risk respectively. Comprehensive connection of any two vulnerabilities, proposed in the paper, indicates the probability of attacking target vulnerability through different attack paths from originating vulnerability node, whose calculation is shown in Figure 1.
1
2
5
4
p12 p35
p14 p15 p45
3 p23
[image:3.612.191.423.208.277.2]
Figure 1 Analysis of vulnerability connectivity via different attack paths.
As shown in the above, there are 3 paths between node 1 and node 5, and then the three-step connection is (3)
15 12 23 35
p p p p . The two-step connection is (2)
15 14 45
p p p .
Given the path between the nodes whose length is 1, comprehensive connection between the nodes is (2) (3)
15 1 (1 p15)(1 p15 )(1 p15 )
, where 15 implies the total probability of attacking the node 5 from the node 1 via different paths.
On the basis of the above analysis, we define connection operator of risk matrix to quantify the connection.
Definition 5. Risk matrix operator (multiplication operator and addition operator ). According
to the multiplication of matrixes, we define multiplication operator as follows:
(2) (2) 11 1 (2) (2) (2) 1 v v vv p p
M M M
p p
, (2)
1
1 (1 )
v
ij ik kj
k
p p p
(2)According to the addition of matrixes, we define addition operator as follows:
11 1
(1) (2) ( ) 1
v n
v vv
M M M
, ( ) 1
1 (1 )
n r ij ij r p
( ) 11 (1 )
n r ij ij r p
(3)From the elaboration of the element in risk matrix M, pijindicates the connection between the
directly related vulnerability node ni and nj. Then the three-step connection can be calculated through
the multiplication of risk matrix M in the following: (3) (3) 11 1 (3) (2) (3) (3) 1 v v vv p p
M M M M M M
p p
Definition 6. Vulnerability risk (Rs,Ro and Rw). Vulnerabilities’ own risk Rs implies the risk
caused by threats via the vulnerability, which is related to value of the vulnerability the connection between the vulnerability node and other vulnerability node. When the vulnerability is independent from other vulnerabilities, the own risk is equal to the value of vulnerability. Vulnerability transmission risk
o
R implies risk transmitted from the vulnerability to the other vulnerability, which is related to the value and connection of the other vulnerability. There is RwRsRo.
Firstly the own risk Rs is calculated via multiplying risk probability of the vulnerability by the loss
caused by risk. For the vulnerability c, there may be several attack paths. Adding all the risk probability
of different paths attains the total risk probability of the vulnerability c. According to definition 5, bc
denotes the total probability of attacking the target vulnerability c via the originating vulnerabilityb. Vulnerability value w c( ) denotes the probable losses after being attacked. Then we know risk for the target vulnerabilityc is R b cs( , )bcw c( ).
Based on the above statement, we can calculate risks of all the attack paths whose target is vulnerability c. In line with definition 6 the own risk of vulnerability c is
1 1
( ) ( , ) ( ( ))
v v
s s bc
b b
R c R b c w c
(4)The total own risk of all the vulnerabilities in information system is denoted by the vector ( s) s(1), s(2), , s( )
V R R R R v .
Next transmission risk Ro indicates the risk transmitted from the penetrated vulnerability to the other
vulnerability. Since risk is transmitted from the originating vulnerability c to the other vulnerability
through different attack paths, the transmission risk of vulnerability c R co( ) is
1
( ) ( ( ))
v
o cb
b
R c w b
1
( ) ( ( ))
v
o cb
b
R c w b
(5)The total transmission risk of all the vulnerabilities in information system is denoted by the vector ( o) o(1), o(2), , o( )
V R R R R v
Finally the global risk of all the vulnerabilities is denoted by the vector (1) (1) (1)
(2) (2) (2) ( ) ( ) ( )
( ) ( ) ( )
s o w
s o w
T T T
w s o
s o w
R R R
R R R
V R V R V R
R v R v R v
Simulation Experimental Analysis
Validity of the method and model proposed in the paper is verified through the topology of network information system as shown in literature[5]. Referring data supported by NVD[5], we suppose vulnerabilities existing in the hosts of the system as follows.
To analyze the game model and evaluate the value of vulnerability, putting the vulnerability 1(CVE-2006-2918) of firewall as an example, for which attack policy consists of (A1) Heart blood;(A2)
location;(D2) Stopping TP Service;(D3) Changing port ID;(D4) Restricting iusr_server, we suppose
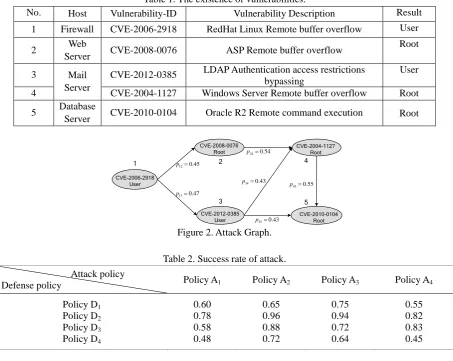
[image:5.612.81.535.141.502.2]success rate of attack as Table 2 shows. Based on the literature [7], we get the attack graph in Figure 2 according to formula 1 and CVSS.
Table 1. The existence of vulnerabilities.
No. Host Vulnerability-ID Vulnerability Description Result
1 Firewall CVE-2006-2918 RedHat Linux Remote buffer overflow User
2 Web
Server CVE-2008-0076 ASP Remote buffer overflow
Root
3 Mail
Server
CVE-2012-0385 LDAP Authentication access restrictions
bypassing
User
4 CVE-2004-1127 Windows Server Remote buffer overflow Root
5 Database
Server CVE-2010-0104 Oracle R2 Remote command execution Root
13 0.47 p 12 0.45 p 24 0.54 p 35 0.43 p 45 0.55 p 34 0.43 p 1 2 3 4 5 CVE-2006-2918 User CVE-2008-0076 Root CVE-2012-0385 User CVE-2004-1127 Root CVE-2010-0104 Root
Figure 2. Attack Graph.
Table 2. Success rate of attack.
Attack policy
Defense policy Policy A1 Policy A2 Policy A3 Policy A4
Policy D1
Policy D2
Policy D3
Policy D4
0.60 0.78 0.58 0.48 0.65 0.96 0.88 0.72 0.75 0.94 0.72 0.64 0.55 0.82 0.83 0.45
The payoffs matrix (MAH,MDH) and (MAL,MDL) of vulnerability game is calculated by the method proposed in the above.
(21,8) (14, 6) (7.9,5.2) (7.6,15.6) ( , ) (17, 23) (25,35) (10, 4.2) (17.2,9.8)
(0.2,11) (9.1,11) (12, 25) (15,8.8)
H H A D M M
( 7 . 8 , 2 2 ) ( 6 . 4 , 1 8 . 4 ) ( 8 . 5 , 8 . 4 ) ( 4 . 6 , 1 8 ) ( 6 . 4 , 1 8 . 1 ) ( 9 . 8 , 1 8 ) ( 0 . 9 , 1 3 ) ( 1 5 , 2 6 ) ( , )
( 7 . 5 , 1 6 ) ( 3 . 2 , 9 . 2 ) ( 1 2 , 1 . 7 ) ( 7 . 5 , 1 5 )
( 7 . 2 , 1 7 . 2 ) ( 1 0 , 1 7 ) ( 6 . 6 , 1 8 ) ( 6 . 7 , 1 5 . 7 )
L L A D M M
Inputting the above payoffs matrix into software Gambit [8], we can get under equilibrium the mixed policies are x*(0.02,0.16,0,0.82)
and y*(0.45,0,0,0.59)
respectively, and expected payoffs are denoted by (0.667, 0.334). Then vulnerability value vector of the information system is
0.667 0.303 0.763 0.379 0.574
The connection matrix of the attack graph is denoted by M, whose maximum length of attack path is 3. With multiplication of matrix M iterated two times, M(2) and M(3) can be calculated. And then we can obtain comprehensive connection matrix (2) (3)
0
M MM M .
0 0.43 0.49 0 0 0 0 0 0.61 0
0 0 0 0.39 0.41
0 0 0 0 0.62
0 0 0 0 0
M
,
0
0 0.43 0.49 0.485 0.493 0 0 0 0.610 0.308
0 0 0 0.390 0.667
0 0 0 0 0.620
0 0 0 0 0
M
On the basis of the vector W and the matrix M0, using the formulas (4) and (5), the vector of vulnerabilities’ own risk and transmission risk are respectively as follows:
( s) 0 0.136 0.313 0.536 1.126
V R , V R( o)
0 . 8 7 4 0 . 3 7 5 0 . 5 4 5
0 . 3 1 5 0In conclusion the global risk vector of vulnerabilities in the system is
( w) 0.874 0.511 0.858 0.851 1.126
V R .
The severity degree of the above vulnerabilities ranks by n5 > n1 > n3 > n4 > n2. The vulnerability n5
and n1 have the significant effect on the network system, based on which risk may cause enormous
losses to the network system, so administrator should pay great attention on the two vulnerabilities.
Conclusion
Concerning the quantitative analysis of vulnerability risk, we do the research on vulnerability value, vulnerabilities’ own risk, transmission risk and comprehensive risk. The non-cooperative and nonzero-sum game model of vulnerability attack-defense is proposed in the paper. And then the value of vulnerability is evaluated by expected payoffs on the equilibrium. Based on the above, the comprehensive connection of the vulnerabilities is calculated through the quantitative analysis of the vulnerabilities connection with two matrix operators proposed. Then the comprehensive assessment method of vulnerability risk is devised, calculating the global risk of vulnerabilities accurately, which helps the security administrator manages to recognize the critical vulnerability.
Acknowledgments
This work is supported by the National Natural Science Foundation of China under Grant No. 61303074 and No. 61309013.
References
[1] Gao Zhiwei, Yao Yao, Rao Fei, et al. Predicting model of vulnerabilities based on the type of vulnerability severity [J]. ACTA Electronica Sinica, 2013, 41(9): 1784-1787 (in Chinese).
[2] Wang Yuanzhuo, Lin Chuang. Analysis for network attack-defense based on stochastic game model [J]. Chinese Journal of Computers, 2010, 33(9): 1748-1762 (in Chinese).
[4] National vulnerability database version 2.5 [EB/OL]. Nation Infrastructure Adviser Committee, 2014[2014-09-17] http://nvd.nis.gov.
[5] Zhou Liang, Li Juner, Lu Tianbo. Research on quantitative assessment model on vulnerability risk for information system [J]. Journal on Communication, 2011, 30(2): 16-21 (in Chinese).
[6] Game Theory [M]. Drew Fudenberg, Jean Tirole, Boston: Massachusetts Institute of Technology Press, 2012: 58-63.
[7] Noel S, Jajodia S. Understanding complex network attack graphs through clustered adjacency matrices [C]. Proc of the 21th Annual Computer Security Applications Conference, Tucson: IEEE, 2013: 160-169.