2017 2nd International Conference on Wireless Communication and Network Engineering (WCNE 2017) ISBN: 978-1-60595-531-5
Cell Breathing Algorithm Based on Energy Efficiency in the High
Density Heterogeneous Cellular Network
Cong ZHAO
1,*, Kun WU
2and Wei GUO
11
The National Key Laboratory of Science and Technology on Communications (NKLSTC), University of Electronic Science and Technology of China (UESTC) Chengdu, China
2China Electronic Technology Cyber Security Co., Ltd, Chengdu, China
*Corresponding author
Keywords: 5G, Cell breath, Energy control, High density, Station sleep.
Abstract. The 5G network has become one of the hottest research focuses. In this network, it is a
consensus reached that the user terminals are high density and the cover of the base stations are multi-tier. The unbalance and variability of the spatial distribution and time of user services make the low utilization ratio of the network resources. A cell breathing algorithm based on energy efficiency is proposed in this paper which combines energy control, base station sleeping and cell zooming. The simulation shows that this algorithm makes the network performance better in energy efficiency and can balance the load of the base stations.
Introduction
It is a consensus has been reached that high density location of the user terminals and the base stations, as well as multi-tier heterogeneous cellular, are key characters in the next generation wireless communication system (5G). However, at the same time, the energy consumption of mobile communication network is not optimistic. According to the Gartner, the global cellular network consumes about 60 billion kWh per year on average, and the energy consumption will grow by 15%-20% every five years. And, energy consumption of mobile communications industry, higher than many other industries, accounts for 3% of the world's total energy consumption, among which energy consumption of base station accounted for 60%~80%. Operators’ electricity charges occupy even close to 1/3 of its operating expenses. [1-4]
In future, high density heterogeneous cellular network will bring challenges to the energy consumption of the mobile communication network, undoubtedly. Therefore, to reduce the energy consumption of the mobile communication network, and to improve the network energy efficiency are not only a social responsibility, but also the social sustainable development, green communications and construction of low carbon environmental protection society, as well as bring considerable economic benefits.
Energy efficiency is one of the key indicators of 5G in the future. How to improve the energy efficiency of the mobile communication network has become one of the hotspots in the mobile communication network. It can be improved from three aspects: network architecture, high efficiency transmission and resource management [5].
Network architecture is designed to build a network that can meet the performance requirements of 5G and also meet the requirements of high energy efficiency, including the deployment of networks and base stations, as well as new communications technologies such as D2D, etc [6-8]. This method needs to improve or even change the network structure, which brings a large cost.
Resource management is mainly the effective management of network resources and terminals and other platforms to achieve better performance of the network, such as optimizing access selection, spectrum power allocation, interference control and base station sleep, etc [11-13].
In this paper, under the background of the existing technology and the deployment of the base station, we use resource management to improve the network performance. And a cell breathing algorithm based on energy efficiency, combining energy control [14-17], base station sleeping [18-20] and cell zooming [21,22], is proposed, which can improve the network energy efficiency.
System Structure and Network Scenarios
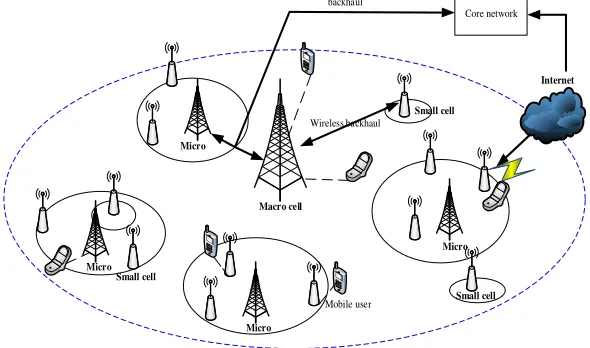
In this paper, the high-density heterogeneous network is composed of Macro cell, Micro cell and small cell network, as shown in Figure 1.
Internet
Core network
Macro cell Micro
Micro
Micro
Micro
Small cell
Small cell Small cell
Mobile user backhaul
[image:2.612.158.453.224.398.2]Wireless backhaul
Figure 1. The high-density heterogeneous network structure.
In the Figure 1, the circles around the macro cell, micro cell and small cell indicate their service coverage. When a mobile user enters a heterogeneous network, the first problem is how to access a suitable network. The traditional access algorithm is to access the base station that has the strongest signal. Under the 3GPP channel model and the default deployment parameters of the base station, the signals of the macro base stations are usually significantly stronger than that of the micro base stations and small base stations. However, this is obviously what we don't want to see, because at the same level as the SNR level, we hope that users access to the micro and small ones rather than the macro ones, for it can not only greatly improves the user rate, but also improves the reuse rate of cyber source spectrum.
On the other hand, spatial and temporal heterogeneity of mobile data traffic brings difference between each network load condition. It is undoubtedly inappropriate if these base stations with uneven load work in the same state. An obvious example is that the amount of data transmission is very large during the day time in the down town, but in the night it will be very small. This is the uneven distribution of the use of mobile communications in time. Similarly, the number of mobile users in suburban and rural areas is much less than that in urban areas. This is the uneven distribution of the use of mobile communications in space. In low load network full power operation state will undoubtedly reduce the network energy efficiency, but in the large high load network the base station coverage needs to be shrunk to enhance the users’ experience.
System Model and Processing Flow
Firstly, according to data amount, the base station can be divided into four types: heavy load, normal load, light load and zero load.
Then, the coverage of the base station with heavy load is reduced in order to improve users’ experience in the heavy load area, and the coverage of the neighbors are increased at the same time to cover the hole caused by the contraction. The flow of the heavy load station can also be shunted to the neighbors.
On the contrary, some base stations with light load can sleep so that lower system energy consumption can be achieved. At this time, the coverage of some stations around the sleeping stations should be increased to avoid the coverage hole.
Also, the zero load stations can be asleep directly and the neighbors’ coverage should be increased.
Base Station Load Calculation and Base Station State Classification
Base station load have many different representation, such as user number [22], bandwidth occupied ratio, number of occupied sub-band [23], etc. In this paper, the base station load is represented by the ratio of occupied bandwidth to the total bandwidth, which is shown in Eq. 1:
, ( ).
i i k i
i A
u u ρ k
∀ ∈
=
∑
⋅ (1)where, ui is load of base station i, and ui ∈[0.1].
, ,k
i k i
i
B u
B
= (2)
where,ui,k indicates the marginal load or newly added load when user k access station i; andBi,k
indicates bandwidth of user k in the station i ; and Bi indicates the total bandwidth of a base
station.
) (k
i
ρ indicates the access situation of the user and base station, shown in Eq. 3:
0, ( )
1,
i
user k link BS i k
user k unlink BS i
ρ =
(3)
Set the threshold l1and l2, then we can get the type of the base station according to the Table 1.
Table 1. Type of base stations.
BS type Load amount
Zero load bs0 ui = 0
Light load bs1 ui ∈(0,l1)
Normal load bs2 ui ∈[l1,l2]
Heavy load bs3 ui ∈(l2,1]
Channel Model
In this paper, three kinds of network, macro cell, micro cell and small/pico cell, use the model ITU UMa NLOS, ITU UMi NLOS, ITU inH LOS. According to TR 36.814 Table B1-2 [24], the path loss model under default parameters is given in Table 2.
Table 2. Path loss model under default parameters.
network path loss (dB) Distance (m) Macro cell PL =11.6 +39.1log10(d) 10<d<5000
Micro cell PL =33.5 +36.7log10(d) 10<d<2000
Signal to Noise Ratio Calculation
Signal to noise ratio (SNR) is the ratio of the received signal strength to the noise signal intensity. Here, noise signal contains the interference from the other base station and the thermal noise. The SNR can be calculated from the Eq. 4:
1 ' 2 ' 0
' '
i k i k
j k k k
j i k k k k
P SNR
P n n N
− − − ≠ ≠ ≠ = + + +
∑
∑
∑
(4)where, SNRi k
− is the signal to noise ratio when user k access the station i, N0 is the thermal noise,
k n
P − is the signal power received by user k from the station n. So, Pi−k indicates when user k
access the station i, the signal from station i, while
∑
≠ −
i
j Pj k
means the sum of the interference
from the other station except i. k' indicates the other user except k in the same coverage area, n1k‘
is downlink interference from station to the user k', n2k’ is uplink interference from user k' to the
station.
According to the paper [25], n1k‘ and n2k’is so smaller than Pn−kthat it can be ignored.
The Pn−k can be calculated in Eq. 5:
1 0
n k n k
P P pl−
− = − ⋅ (5)
where, P0n−k is the transmit power of base station n. pl is the transmission loss coefficient, which is
the function of distance of the user and the station and is shown in Table 2. The transmission loss can be calculated in Eq. 6:
( B) 10 10
PL d
pl= (6)
And the received signal power can be calculated in Eq. 7:
-1 ( B)
1 10
0 0 10
PL d
n k n k n k
P P pl− P
− − −
= ⋅ = ⋅
(7)
So we can get the SNR by Eq. 8:
1 ( B) 10 0 1 ( B) 10 0 0 10 10 k i j PL d i k i k i k PL d j k j k j i j i P P SNR P N P TB − − − − − − − ≠ ≠ ⋅ = = + ⋅ +
∑
∑
(8)where, B is the wideband, T is Kelvin temperature and could be usually 290K(17oC), kis the
Boltzmann constant, and k 1.3803 10-23J /K
×
= . So, kT = -174(dBm/Hz).
Power Regulation of Base Station
The expansion of cell coverage is achieved by adjusting the base station transmit power.
Suppose the initial transmit power of base station i is P1 and the initial Coverage radius is r1.
After power adjustment, station denoted by j , and transmit power becomes to P2, the radius
changes to r2.
1( ) 1
1 10
1 1 1 10
PL dB
i k
P P pl P
− −
−
= ⋅ = ⋅
(9)
2( ) 1
1 10
2 2 2 10
PL dB
j k
P P pl P
− −
−
= ⋅ = ⋅
(10)
Suppose the user at the edge of the cell can receive the signal at the same strength, which means if the received signal is weaker than the power, we think the user is outside the coverage area while if the received signal is stronger than this power, we think the user is in the coverage area.
j k i k
P P
− = − (11)
Focus on the micro cell, as shown in Table 2, we can get PL1 and PL2as follow:
1 33.5 36.7 log ( )10 1
PL = + r (12)
2 33.5 36.7 log ( )10 2
PL = + r (13)
So, we can get the relationship between transmit power of the base station and the coverage radius shown in Eq. 14:
3.67
1 1
2 2
P r
P r
=
(14)
When comes to the macro and pico cell, the index will change to 3.91 and 1.69.
Then, the relationship between transmit power of the base station and the coverage radius can be shown in Table 3.
Table 3. Ralationship between transmit power and coverage radius.
Coverage change Shrink 1/8 Expand 1/16 Expand 1/6
Power change
Micro cell 0.61 times 1.25 times 1.76 times Small cell 0.80 times 1.11 times 1.30 times Macro cell 0.59 times 1.27 times 1.83 times
Base Station Power Regulation Strategy
When the transmit power of the base station is reduced, the overall power consumption of the base station will be greatly reduced.
The power regulation strategy adjusts the transmit power of the base station according to its current state by making the zero load stations sleep, shrinking the coverage radius of the heavy load ones, letting the lightest load ones sleep. The detail is as follows:
1) Close the zero load stations straightly, make its transmit power to 0;
2) Sort the light load stations, choose the lightest one, and make its transmit power to 0; expand its neighbors’ coverage radius by 1/6 to fill up the hole caused by sleeping station;
3) Sort the heavy load stations, choose the heaviest one, shrunk its coverage radius by 1/8, and expand its neighbors’ coverage radius by 1/16;
4) Enter the next cycle and sort again.
Base Station Activation
Simulation and Analysis
Simulation Scene
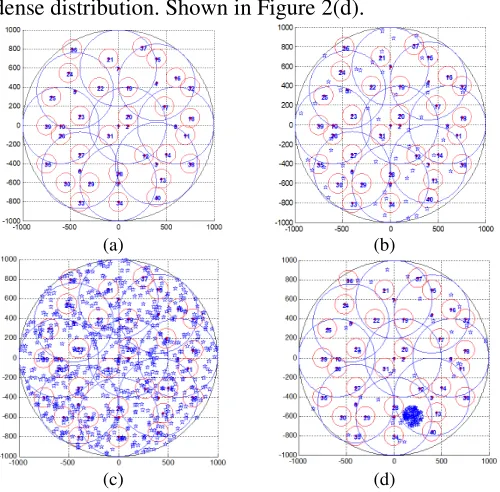
The simulation scene is a high density multi-tier heterogeneous network composed three cell networks, macro cells, micro cells and small/pico cells. In the matlab environment, the macro cell, micro cells and small/pico cells are expressed by the big circle, middle circles and small circles separately which is shown in Figure 2.
In Figure 2(a), the macro base station is recorded by No.1; No.2-10 represent micro ones; and No. 11-40 represent pico ones which are random located in the map.
The simulation parameters is shown in Table 4 and Table 5. Suppose all the user priority access the nearest base station. We design 3 typical scenarios:
1) Uniform sparse distribution. Shown in Figure 2(b). 2) Uniform dense distribution. Shown in Figure 2(c).
3) Single hot point dense distribution. Shown in Figure 2(d).
(a) (b)
[image:6.612.181.431.255.501.2]
(c) (d)
Figure 2. Simulation scene.
Simulation Procedure
The simulation procedure is as follow:
1) Initialization settings. To set the parameters of each kinds of nodes as the table 4 and 5.
2) Users select a network to access at the nearest principle, which is affected by the users’ location.
3) Controlling the BS power. Different numbers of user have accessed to different BS, and each BS work at the different state. According the state of the BSs, to change the power or coverage radius as the strategy proposed in III.
4) Iterative control. Repeat step3 periodically to optimize the performance of the network. If it reaches the optimal, it will not adjust the power and enter the next period.
Compared Algorithms
In order to evaluate the proposed method, we compare it with some typical algorithms 1) min-con (minimization congestion load) algorithm and min-max algorithms [22]
base stations, the power is reduced to shrink the coverage, until all the base stations are changed into a heavy load state or one of the base stations has adjusted its power to a minimum operating power state.
Min-max algorithm is based on min-con, increasing the transmit power to light load base stations to cover more areas.
2) ccza(centralized cell zooming algorithm) [26]
Ccza is centralized cell expansion algorithm. First calculate all base station load. In a processing cycle, according to the size of the base station load from small to large order, in turn make the minimum load base station dormancy. If the blocking rate does not increase, then continue to deal with the secondary load of small base stations; otherwise, enter the next cycle.
3) PL-CB(path loss-based cell breathing) [27]
PL-CB is a cell respiration algorithm based on path loss. On the premise of limiting the maximum transmit power and minimum transmission rate, according to the real-time transmission rate of the users, the base station transmit power is continuously updated to find the best balance point of energy consumption and total throughput.
4) Original and sleep algorism
[image:7.612.77.532.339.587.2]Original algorithm is not to take any base station power control technology to adjust the base station power, but make the user to access the station only according to the access selection algorithm. Sleep algorithm does not take any base station power control technology to adjust the base station power, but take the station sleep measures for zero load stations.
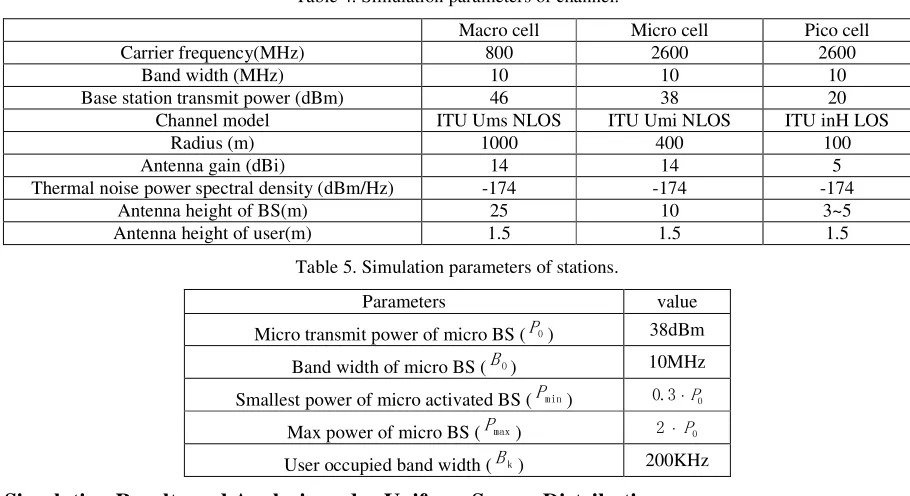
Table 4. Simulation parameters of channel.
Macro cell Micro cell Pico cell
Carrier frequency(MHz) 800 2600 2600
Band width (MHz) 10 10 10
Base station transmit power (dBm) 46 38 20
Channel model ITU Ums NLOS ITU Umi NLOS ITU inH LOS
Radius (m) 1000 400 100
Antenna gain (dBi) 14 14 5
Thermal noise power spectral density (dBm/Hz) -174 -174 -174
Antenna height of BS(m) 25 10 3~5
Antenna height of user(m) 1.5 1.5 1.5
Table 5. Simulation parameters of stations.
Parameters value
Micro transmit power of micro BS (P0) 38dBm
Band width of micro BS (B0) 10MHz
Smallest power of micro activated BS (Pmin) 0.3⋅P0
Max power of micro BS (Pmax) 2 P⋅ 0
User occupied band width (Bk) 200KHz
Simulation Results and Analysis under Uniform Sparse Distribution
Uniform sparse distribution is used to simulate the network scenario with a small number of users. As shown in Figure 2(b), there are 50 users uniform locating in the network.
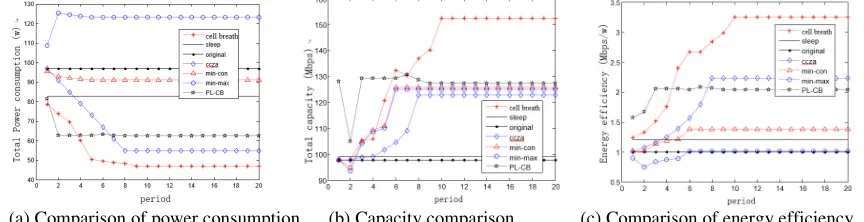
From the Figure 3(a) we can see that the cell breathing algorithm proposed in this paper has the lowest power consumption. Figure 3(b) indicates that cell breathing algorithm will bring a larger system capacity at the same time when the data load is low. And the Figure 3(c) show us that the cell breathing algorithm has the highest energy efficiency, which is high by 15% than the ccza algorithm that is at the second place.
Simulation Results and Analysis under Uniform Dense Distribution
From Figure 4(a) we can see that the dropping rate of the cell breathing algorithm is the lowest. We can also see that from Figure 4(b) that the capacity of cell breathing algorithm is the highest, which is about 10% higher than that of original algorithm. But Figure 4(c) and Figure 4(d) show that the energy efficiency of cell breathing is not very good in this scenario, which is better only than PL-CB algorithm as the total power consumption for the cell breathing algorithm of the base station is relatively high. This is because in this case, almost base stations work in heavy condition. In each operation period, we will decrease the power of the heaviest and expand the neighbors’ coverage radius, so the energy is high for the decreased power is less than the increased power. However, cell breathing algorithm performs better because it brings 10%-20% improvement with the cost less than 10%.
[image:8.612.98.516.201.322.2]
(a) comparison of power consumption (b) capacity comparison (c) Comparison of energy efficiency
Figure 3. 50 users under uniform distribution.
Simulation Results and Analysis under Single Hot Point Dense Distribution
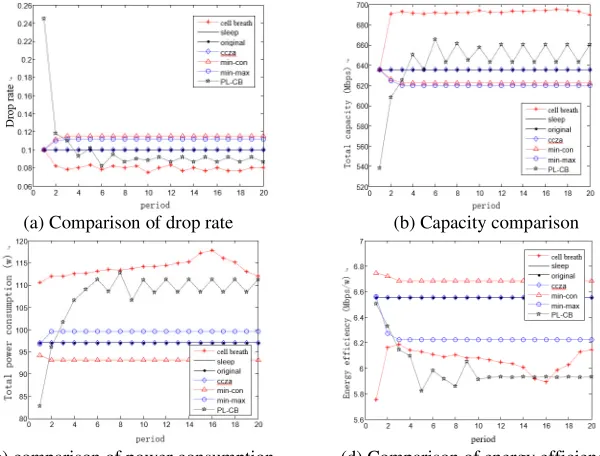
Single point dense distribution refers to a large number of users located in a certain area and the other users located uniformly in the whole map. As shown in Figure 2(d), 100 users gather in a small area while 30 users uniform locate on the whole map.
The simulation results indicated that the similar trends to the uniform sparse distribution. From the Figure 5(a) and Figure 5(b), we can see that the cell breathing algorithm performs better in both power consumption and system capacity. And the Figure 5(c) indicates that cell breathing algorithm in this scenario improves energy efficiency greatly, which is better than the second best algorithm PL-CB by 60%.
(a) Comparison of drop rate (b) Capacity comparison
(c) comparison of power consumption (d) Comparison of energy efficiency
[image:8.612.155.455.476.704.2]Conclusion
The energy consumption of mobile communication has become a social problem and one of the key problem of the 5G communication system. Considering reducing the energy consumption of the network, a cell birthing algorithm is proposed in this paper, which combines with cell zooming technology, power control technology and base station sleeping technology.
The simulation in a multi-tier high density heterogeneous cellular scene indicates that the proposed resource management algorithm can effectively improve the energy efficiency of the network while balancing the load of each base station. And this algorithm has obviously better performance than many typical algorithms on power consumption, energy efficiency and system capacity.
[image:9.612.90.522.205.316.2]
(a) Comparison of power consumption (b) Capacity comparison (c) Comparison of energy efficiency
Figure 5. Single hot point dense distribution.
Acknowledgement
This work was supported by the Fundamental Research Funds for the Central Universities (ZYGX2016J020).
References
[1] D. W. K. Ng, E. S. Lo, R. Schober. Energy-Efficient Resource Allocation in OFDMA Systems with Hybrid Energy Harvesting Base Station [J]. IEEE Transactions on Wireless Communications, 2013, 12(7): 3412-3427.
[2] Bart Lannoo. Energy Consumption of ICT Networks [R]. Brussels: TREND Final Workshop, October 24, 2013.
[3] G. Fettweis, E. Zimmermann. ICT Energy Consumption - Trends And Challenges [C]. The 11th International Symposium on Wireless Personal Multimedia Communications, Dresden, 2008, 8-11.
[4]Ericsson. 5G energy performance-key technologies and design principles[OL].
http://www.ericsson.com/fr/news/150407-5g-energy-performance_244069646_c, April 07, 2015.
[5] D. Feng, C. Jiang, G. Lim, et al. A survey of energy-efficient wireless communications [J]. IEEE Communications Surveys & Tutorials, 2013, 15(1): 167-178.
[6] G. Y. Wu, G. Feng. Energy-efficient relay deployment in next generation cellular networks [C]. IEEE International Conference on Communications, Ottawa, June 2012, 5757-5761.
[7] M.N. Tehrani, M. Uysal, H. Yanikomeroglu. Device-to-device communication in 5G cellular networks: challenges, solutions, and future directions [J]. IEEE Communications Magazine, 2014, 52(5): 86-92.
[9] V. Jungnickel, K. Manolakis, W. Zirwas, et al. The role of Small Cells, Coordinated Multipoint, and Massive MIMO in 5G [J]. IEEE Communications Magazine, 2014, 52(5): 44-51.
[10] J. Thompson, X. L. Ge, H. C. Wu, et al. 5G wireless communication systems: prospects and challenges [Guest Editorial] [J]. IEEE Communications Magazine, 2014, 52(2): 62-64.
[11] J. Thompson, X. L. Ge, H. C. Wu, et al. 5G wireless communication systems: prospects and challenges [Guest Editorial][J]. IEEE Communications Magazine, 2014, 52(2): 62-64.
[12] J. B. Rao, A. O. Fapojuwo. A Survey of Energy Efficient Resource Management Techniques for Multicell Cellular Networks[J]. IEEE Communications Surveys & Tutorials, 2014, 16(1): 154-180.
[13] L. Saker, S. E. Elayoubi, T. Chahed. Minimizing Energy Consumption via Sleep Mode in Green Base Station[C]. IEEE Wireless Communications and Networking Conference (WCNC), Sydney, 2010, 1-6.
[14] W. Yu, G. Ginis, J. M. Cioffi. Distributed multiuser power control for digital subscriber lines[J]. IEEE Journal on Selected Areas in Communications, 2006, 20(5): 1105-1115.
[15]Y. Li, B. Vucetic, Z. Zhou, et al. Distributed Adaptive Power Allocation for Wireless Relay Networks[J]. IEEE Transactions on Wireless Communications, 2007, 6(3): 948-958.
[16]P. Wang, M. Zhao, L. Xiao, et al. Power Allocation in OFDM-based Cognitive Radio Systems[C]. IEEE Global Communication Conference, Wanshington DC, 2007, 4061-4065.
[17] R. Torrea-Duran, P. Tsiaflakis, L. Vandendorpe, et al. Neighbor-friendly autonomous power control in wireless heterogeneous networks[J]. Eurasip Journal on Wireless Communications & Networking, 2014, 2014(1): 1-17
[18] A. J. Fehske, F. Richter, G. P. Fettweis. Energy Efficiency Improvements through Micro Sites in Cellular Mobile Radio Networks[C]. IEEE GLOBECOM Workshops, Honolulu, 2009, 1-5.
[19]M. A. Marsan, L. Chiaraviglio, D. Ciullo, et al. Optimal energy savings in cellular access networks[C]. IEEE International Conference on Communications Workshops, Dresden, 2009, 1-5.
[20] J. Gong, S. Zhou, Z. Niu, et al. Traffic-aware base station sleep-ing in dense cellular networks[C]. IEEE 18th International Workshop on Quality of Service, Beijing, 2010, 1-2.
[21] A. Jalali. On cell breathing in CDMA networks[C]. IEEE International Conference on Communications, Atlanta, 1998, 985-988
[22] Y. Bejerano, S. J. Han. Cell Breathing Techniques for Load Balancing in Wireless LANs[J]. IEEE Transactions on Mobile Computing, 2009, 8(6): 735-749.
[23] A. Khandekar, N. Bhushan, T. Ji, et al. LTE-Advanced: Heterogeneous networks[C]. IEEE Wireless Conference (EW), Lucca, 2010, 978-982.
[24] 3GPP. TR 36.814_100, Further Advancements for E-UTRA Physical Layer Aspects (Release9)[S]. February, 2009.
[25] H. Wang, N. Liu, Z. H. Li, et al. A unified algorithm for mobility load balancing in 3GPP LTE multi-cell networks[J]. Sciece China Information Sciences, 2013, 56(2): 1-11.
[26] Z. Niu, Y. Wu, J. Gong, et al. Cell Zooming for Cost-Efficient Green Cellular Networks[J]. IEEE Communications Magazine, 2010, 48(11): 74-79.