Copyright © 1998, American Society for Microbiology. All Rights Reserved.
Nucleic Acid Sequence-Based Amplification, a New Method for
Analysis of Spliced and Unspliced Epstein-Barr Virus
Latent Transcripts, and Its Comparison
with Reverse Transcriptase PCR
ANTOINETTE A. T. P. BRINK,1MARCEL B. H. J. VERVOORT,1JAAP M. MIDDELDORP,1,2 CHRIS J. L. M. MEIJER,1ANDADRIAAN J. C.VAN DENBRULE1*
Section Molecular Pathology, Department of Pathology, University Hospital Vrije Universiteit, 1007 MB Amsterdam,1and Bioresearch Unit, Organon Teknika,
5281 RM Boxtel,2The Netherlands
Received 20 April 1998/Returned for modification 24 June 1998/Accepted 18 August 1998
Nucleic acid sequence-based amplification (NASBA) assays were developed for direct detection of Epstein-Barr virus (EBV) transcripts encoding EBV nuclear antigen 1 (EBNA1), latent membrane proteins (LMP) 1 and 2, and BamHIA rightward frame 1 (BARF1) and for the noncoding EBV early RNA 1 (EBER1). The sensitivities of all NASBAs were at least 100 copies of specific in vitro-generated RNA. Furthermore, 1 EBV-positive JY cell in a background of 50,000 EBV-negative Ramos cells (the relative sensitivity) was detected by using the EBNA1, LMP1, and LMP2 NASBA assays. The relative sensitivity of the EBER1 NASBA was 100 EBV-positive cells, which was probably related to the loss of small RNA molecules during the isolation. The BARF1 and LMP2 NASBAs were evaluated on clinical material. BARF1 expression was found in 6 of 7 nasopharyngeal carcinomas (NPC) but in 0 of 22 Hodgkin’s disease (HD) cases, whereas LMP2 expression was found in 7 of 7 NPCs and in 17 of 22 HD cases. For detection of EBNA1 transcripts in HLs (n512) and T-and B-cell non-Hodgkin’s lymphomas (n 53 and n 52, respectively), NASBA was compared with reverse transcriptase (RT) PCR. Two samples were positive only with NASBA, and two other samples were positive only with RT-PCR; for all other samples, the RT-PCR and NASBA results were in agreement. We conclude that NASBA is suitable for sensitive and specific detection of the above-mentioned EBV transcripts, regardless of their splicing patterns and the presence of EBV DNA. The EBNA1, LMP2, and BARF1 NASBAs developed in this study proved to be reliable assays for detection of the corresponding transcripts in EBV-positive clinical material.
Epstein-Barr virus (EBV) is a widespread human gamma-herpesvirus which causes infectious mononucleosis and is strongly associated with several other human disorders, such as nasopharyngeal carcinoma (NPC), Burkitt’s lymphoma, Hodg-kin’s disease (HD), lymphoma in immunocompromised and immunocompetent individuals, and oral hairy leukoplakia in human immunodeficiency virus-infected persons (reviewed in reference 16). Several EBV latent genes are known to be ex-pressed in EBV-associated disorders (5, 8, 18), and some of these are thought to play a role in pathogenesis. Transcription analysis of EBV at present is restricted to a few latent genes, due to the lack of knowledge of other transcripts (splicing patterns, promoter usage, etc.). However, the analysis of other possible latent transcripts is indispensable to clarify the role of EBV in, e.g., the pathogenesis of lymphomas. Because lym-phomas are quite rare and the amount of biopsy material from them is usually small, EBV transcription analysis is preferen-tially performed with as little material as possible. Reverse transcriptase PCR (RT-PCR) has proven to be a powerful tool for this analysis (3, 4), but it has several drawbacks, such as the need for intron-flanking primers and the fact that it is usually
performed as a two-step reaction. Nucleic acid sequence-based amplification (NASBA) (11), which can be used to overcome these disadvantages, is a single-step isothermal RNA-specific amplification process. Using NASBA, RNA, but not genomic DNA, is amplified independently of splice sites (7). NASBA was successfully used for the detection of viral (11) and bac-terial (17) RNA in clinical samples. The RNA amplification during the NASBA reaction involves the action of three en-zymes: avian myeloblastosis virus RT, T7 RNA polymerase, and RNase H. Two specific oligonucleotide primers (one of which contains a bacteriophage T7 RNA polymerase promoter site) act in concert to amplify RNA target sequences more than 1012-fold within 90 min (11).
Based on their splicing patterns, four types of EBV tran-scripts can be distinguished, represented by those encoding EBNA1, LMP1 and LMP2, and BARF1 and the noncoding EBER1, as schematically shown in Fig. 1. For all of these transcripts, NASBA reactions were developed in this study.
All of the assays were evaluated for their specificities. More-over, their relative sensitivities (the minimum number of EBV-positive cells that can be detected in a background of EBV-negative cells) (3) and, when necessary, their analytical sensitivities (i.e., the minimum number of specific cRNA mol-ecules that can be detected), were compared to those of cor-responding RT-PCR assays (where available). Moreover, the NASBA assays were evaluated for their suitability to detect these respective transcripts in EBV-positive B- and T-cell non-* Corresponding author. Mailing address: Section Molecular
Pa-thology, Department of PaPa-thology, University Hospital Vrije Univer-siteit, P.O. Box 7057, 1007 MB Amsterdam, The Netherlands. Phone: 31-20-4440503/44017. Fax: 31-20-4442964. E-mail: vandenbrule@azvu .nl.
3164
on May 15, 2020 by guest
http://jcm.asm.org/
Hodgkin’s lymphoma (NHL), Hodgkin’s disease (HD), and NPC biopsy materials.
MATERIALS AND METHODS
Cell lines.JY is a cell line generated by transformation of peripheral blood lymphocytes with EBV; Ramos and Bjab are cell lines derived from EBV-negative Burkitt’s lymphomas. An EBV-EBV-negative Louckes cell line transfected
with a BARF1 expression construct (25) was kindly provided by T. Ooka (Labo-ratoire de Virologie Mole´culaire, CNRS, Lyon, France). To determine the rel-ative sensitivities of the NASBA assays, JY cells were diluted with Ramos cells in the following ratios: 1:5, 1:50, 1:500, 1:5,000, and 1:50,000. RNA was extracted from these dilutions (see below) and subjected to NASBA or RT-PCR.
Clinical material. Snap-frozen material from seven NPC, two HD, one T-NHL, and two B-NHL biopsies was obtained from the Department of Pathology of the University Hospital Vrije Universiteit, Amsterdam, The Netherlands. Twenty-four HD biopsy samples, also snap frozen, were kindly provided by the Stichting Pathologisch Anatomisch Laboratorium Kennemerland, Haarlem, The Netherlands. The presence of EBV in the tumor cells was confirmed by using EBER RNA in situ hybridization, as previously described (9). For RNA isolation prior to NASBA, 12 5-mm cryosections were cut, of which the middle 10 were placed in an Eppendorf tube. The outer two sections were hematoxylin-eosin stained and examined microscopically for the presence of tumor cells.
RNA isolation.RNA was isolated by the guanidinium-phenol-based RNAzol method (Cinna Biotecx, Houston, Tex.). Quality controls for the isolated RNA were performed both by spectrophotometrical determination of the purity ratio and by gel electrophoresis, in which the presence of 18S-28S rRNA served as a marker for proper RNA quality (3). In addition, for some purposes, RNA was isolated by the silica-based isolation method, as described in detail by Boom et al. (2).
Plasmid clones and generation of runoff transcripts.To determine the ana-lytical sensitivities of the different NASBA assays, runoff transcripts were gen-erated from linearized plasmid clones. The pJJJ1 clone containing the EBER1 cDNA was kindly provided by L. Young, Birmingham, United Kingdom, and a BARF1 clone was generated by subcloning a 750-bp PstI fragment from the BamHIA EBV genomic clone into the pGem-4Z plasmid (Promega, Madison Wis.). In vitro transcription was performed with the Riboprobe kit (Promega) according to the manufacturer’s protocol. After DNase treatment, the runoff transcripts were purified with RNAzol. The RNA was precipitated and quanti-tated spectrophotometrically. NASBA reactions were performed with 104, 103, 102, 10, 1, and 0 copies of the runoff transcript.
Oligonucleotide primers and probes.EBNA1 (4) and U1A (1) RT-PCR prim-ers have been described elsewhere.
[image:2.612.51.288.72.214.2]For all NASBA targets tested, two sense and two antisense primers were selected, the latter carrying a T7 RNA polymerase recognition sequence at the 59end. When possible, primer sequences were selected according to the follow-ing standard criteria (21a): the length of the hybridizfollow-ing parts should be between 20 and 25 nucleotides, there should be a purine-rich sequence immediately 39of the T7 RNA polymerase recognition sequence, and the nucleotide positioned at the 39end should be an adenosine (A). All NASBA primers were polyacrylamide FIG. 1. Schematic representations of different types of EBV transcripts and
localization of NASBA primers. (a) Transcript which is spliced in the noncoding but not the coding domain, like EBNA1 transcripts (10, 14, 21). All possible coding transcripts are detected by NASBA with primers localized within the ORF. (b) Transcript which is spliced in the coding domain, like LMP1 and LMP2 (12, 13). (c) Transcript which is not spliced at all, like EBER1 (6). (d) Transcript whose splicing pattern is not known, like BARF1 (27). Although the splicing patterns of the BamHIA region are highly complex, the selection of NASBA primers within the ORF of interest provides reliable detection without false negatives. Large open bars represent exons; small black bars represent NASBA primers. Abbreviations: ATG, start codon; AAAA, poly(A) tail; BKRF1,
BamHIK rightward frame 1.
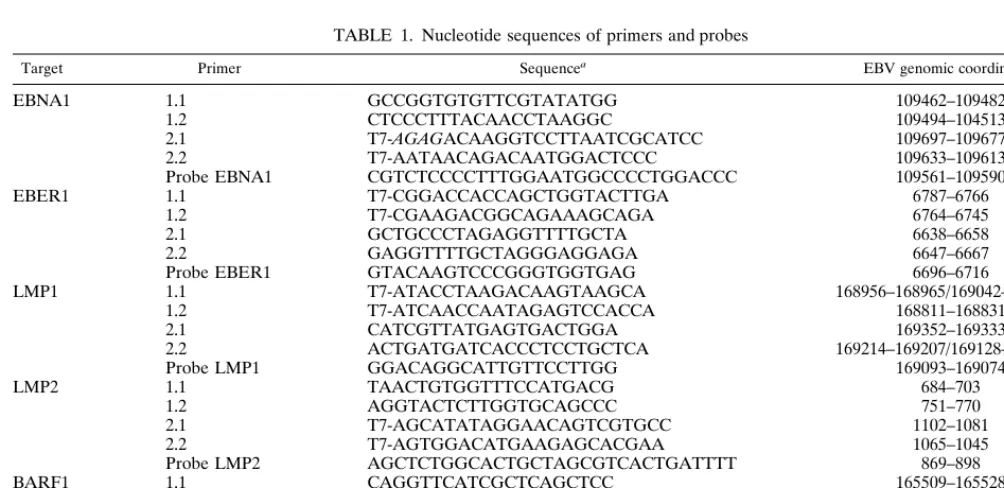
TABLE 1. Nucleotide sequences of primers and probes
Target Primer Sequencea EBV genomic coordinatesb
EBNA1 1.1 GCCGGTGTGTTCGTATATGG 109462–109482
1.2 CTCCCTTTACAACCTAAGGC 109494–104513
2.1 T7-AGAGACAAGGTCCTTAATCGCATCC 109697–109677
2.2 T7-AATAACAGACAATGGACTCCC 109633–109613
Probe EBNA1 CGTCTCCCCTTTGGAATGGCCCCTGGACCC 109561–109590
EBER1 1.1 T7-CGGACCACCAGCTGGTACTTGA 6787–6766
1.2 T7-CGAAGACGGCAGAAAGCAGA 6764–6745
2.1 GCTGCCCTAGAGGTTTTGCTA 6638–6658
2.2 GAGGTTTTGCTAGGGAGGAGA 6647–6667
Probe EBER1 GTACAAGTCCCGGGTGGTGAG 6696–6716
LMP1 1.1 T7-ATACCTAAGACAAGTAAGCA 168956–168965/169042–169051c
1.2 T7-ATCAACCAATAGAGTCCACCA 168811–168831
2.1 CATCGTTATGAGTGACTGGA 169352–169333
2.2 ACTGATGATCACCCTCCTGCTCA 169214–169207/169128–169114c
Probe LMP1 GGACAGGCATTGTTCCTTGG 169093–169074
LMP2 1.1 TAACTGTGGTTTCCATGACG 684–703
1.2 AGGTACTCTTGGTGCAGCCC 751–770
2.1 T7-AGCATATAGGAACAGTCGTGCC 1102–1081
2.2 T7-AGTGGACATGAAGAGCACGAA 1065–1045
Probe LMP2 AGCTCTGGCACTGCTAGCGTCACTGATTTT 869–898
BARF1 1.1 CAGGTTCATCGCTCAGCTCC 165509–165528
1.2 GGCTGTCACCGCTTTCTTGG 165560–165579
2.1 T7-AGGTGTTGGCACTTCTGTGG 165762–165743
2.2 T7-AGCATGGGAGATGTTGGCAGC 165798–165780
Probe BARF1 CTGGTTTAAACTGGGCCCAGGAGAGGAGCA 165644–165673
aT7 RNA polymerase promoter sequence, 59AAT TCT AAT ACG ACT CAC TAT AGG G 39. Italics, purine-rich adapter sequence following the T7 RNA
polymerase promoter.
bGenomic coordinates are derived from the EBV genomic sequence named EMBL:EBV, as described in the EMBL database. cThese primers overlap the junction between two exons.
on May 15, 2020 by guest
http://jcm.asm.org/
[image:2.612.47.549.447.691.2]purified to guarantee full-length primers. For each target, a specific oligonucle-otide probe was chosen that could hybridize to NASBA products of all four primer combinations. The characteristics of primers and probes are given in Table 1.
NASBA reactions.NASBA reactions were carried out as described previously (11, 17). Briefly, 100 ng of total RNA per reaction (unless otherwise indicated) was amplified at 41°C in 20-ml reaction volumes containing 4 pmol of either primer; 15% dimethyl sulfoxide; 40 mM Tris-HCl (pH 8.5); 12 mM MgCl2; 70 mM KCl; 4 mM dithiothreitol; 1 mM (each) deoxynucleoside triphosphate, 2 mM (each) rATP, rUTP, rCTP; 1.5 mM rGTP; and 0.5 mM ITP. Reaction products were evaluated by gel electrophoresis with 1.5% agarose in Tris-borate-EDTA, transferred from the gels to nylon filters (Qiabrane; Qiagen, Chatsworth, Calif.) via capillary blotting in 103SSC (13SSC is 0.15 M NaCl plus 0.015 M sodium citrate), and hybridized to specific [g-32P]ATP end-labelled oligonucle-otide probes.
RT-PCR.The RT-PCR protocol used in this study has been described else-where (3).
RESULTS
For all NASBA assays developed in this study, general op-timization results are summarized in Table 2. In addition, some specific aspects of each NASBA target are discussed below. The sensitivity of the NASBA reaction depends, among other factors, on the KCl concentration during the reaction. KCl influences the efficiency of primer annealing and enzyme func-tion, and the optimal concentration should be determined em-pirically for each new primer combination. For this reason, separate NASBA reactions were performed for each target with the optimal primer combination and KCl concentrations ranging from 30 to 90 mM. The optimal KCl concentration for all NASBAs developed in this study was 70 to 80 mM (Table 2), as was shown for other NASBA targets (11).
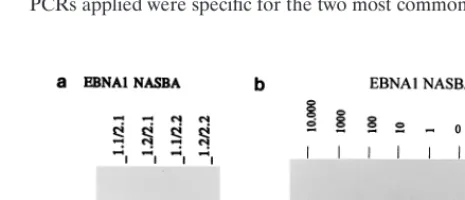
EBNA1 target.To detect all possible EBNA1 transcripts, the EBNA1 NASBA primers were chosen within the (nonspliced) open reading frames (ORFs) at the 39ends of the transcripts, where genetic variation rarely occurs (22) (Fig. 1). The results are summarized in Table 2; large differences in signal intensi-ties were observed with different primer combinations, as shown in Fig. 2.
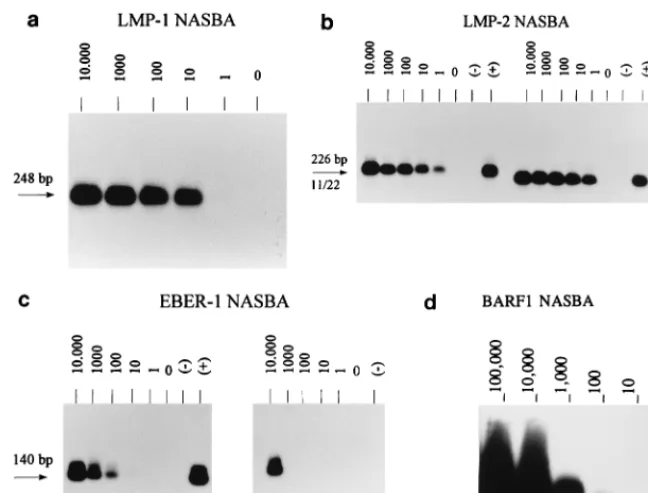
LMP1 target.The most suitable primer combination for the LMP1 NASBA assay is identical to the RT-PCR primer set that was previously developed and evaluated (3, 4), except for the T7 RNA polymerase recognition site on the NASBA an-tisense primer. The relative sensitivity of the LMP1 RT-PCR as previously determined (3) is about 1 EBV-positive cell in a background of 50,000 EBV-negative cells. The NASBA has the same sensitivity (Fig. 3a).
LMP2 target.LMP2 primers were chosen in order to am-plify both LMP2A and LMP2B transcripts. Using the optimal primer set, an amount of RNA equivalent to one EBV-positive JY cell in a background of 50,000 EBV-negative Ramos cells could be clearly detected (Fig. 3b); this sensitivity is clearly
higher than that of the RT-PCR which was described previ-ously (3), in which the detection limit was 10 JY cells.
EBER1 target.The EBER primers were selected in such a way as to recognize EBER1 and not EBER2. Figure 3c (left blot) shows that the relative sensitivity of the optimal primer set is about 100 EBV-positive cells in a background of 50,000 EBV-negative cells. This was much lower than expected, be-cause EBER1 is abundantly expressed in EBV-infected cells (up to 107RNA copies per cell) (15). Moreover, the sensitivity could not be improved by changing the KCl concentration in the reaction. To exclude inefficiency of the NASBA reaction itself as a cause of this low relative sensitivity, we determined the analytical sensitivity for the EBER NASBA with runoff transcripts; 100 copies of EBER1 cRNA could be detected, which is similar to the sensitivity found for other EBV targets and rules out inefficiency of the EBER NASBA reaction. Al-ternatively, the RNA isolation method (RNAzol) used is based on precipitation and may therefore be unsuitable for the iso-lation of small RNAs like the EBERs, which would precipitate less efficiently. Therefore RNAzol was compared with the sil-ica-based isolation method of Boom et al. (2). From the results (Fig. 3c, right blot) it appears that this silica-based isolation is even less sensitive than the RNAzol method: an amount of RNA equivalent to an input of 10,000 cells is necessary for detection of EBER transcripts after the silica-based isolation. BARF1 target.The BARF1 primers were chosen within the ORF to guarantee amplification of all possible BARF1 tran-scripts, including unknown ones. When we used JY cells, the signals obtained with the BARF1 NASBA appeared to be quite weak (data not shown). Therefore, we used a Louckes cell line transfected with a BARF1 construct (25) as a positive control and to determine which primer combination was the most useful. Subsequently, the analytical sensitivity of the BARF1 NASBA was determined, and it proved to be 10 copies of cRNA (Fig. 3d). Therefore, the low relative sensitivity of this assay with JY cells must be due to low expression of BARF1. Indeed, several previous studies have indicated that BARF1 transcripts are predominantly expressed in EBV-pos-itive epithelial cells and during epithelial disorders like NPC (20) but to a much lower extent in EBV-positive B cells and lymphomas.
Evaluation of NASBA assays on clinical material. (i) Eval-uation of EBNA1 NASBA and comparison with RT-PCR on lymphoma material.In a series of EBV-positive (n510) and -negative (n52) HD samples and EBV-positive B-NHL (n5
2) and T-NHL (n53) samples, NASBA and RT-PCR were compared for the detection of EBNA1 transcripts. The RT-PCRs applied were specific for the two most common EBNA1
[image:3.612.50.290.82.165.2]FIG. 2. (a) EBNA1 NASBA analysis of JY RNA with the four different primer combinations; combinations 1.1-2.1 and 1.2-2.1 clearly give stronger sig-nals than the other two combinations. (b) Determination of the relative sensi-tivity of primer set 1.2-2.1. A positive signal was obtained even when an amount of RNA equivalent to only one JY cell was present. The number of JY cells is indicated above each lane.2, negative water control;1, positive control.
TABLE 2. Summary of NASBA optimization results
Target combinationBest primer sensitivity ofRelative NASBA
Optimal KCl concn
(mM)
Relative sensitivity of
RT-PCRa
EBNA1 1.2-2.1 1 70 1
LMP1 1.1-2.1 1 70 1
EBER1 1.1-2.2 100 70 NPb
LMP2 1.2-2.1 1 70 1–10
BARF1 1.1-2.2 NDc 70 NP
aAs determined previously (3). bNP, not possible.
cND, not done. For BARF1, instead of the relative sensitivity, the analytical
sensitivity was determined by using runoff transcripts. The analytical sensitivity of the BARF1 NASBA is 10 copies of cRNA.
on May 15, 2020 by guest
http://jcm.asm.org/
[image:3.612.312.545.574.674.2]transcripts: BamHI Q promoter (Qp) driven (QK spliced [19]) and Cp-Wp driven (Y3K spliced [23]). Prior to transcription analysis, all samples were tested for RNA quality by gel elec-trophoresis, using the visibility of rRNA bands as a measure of good RNA quality. Moreover, an RT-PCR specific for tran-scripts encoding the small nuclear ribonucleoprotein U1A (1) was performed for all samples as an additional RNA quality control. The results are summarized in Table 3. Briefly, using RT-PCR, EBNA1 transcripts were detected in 13 of 15 EBV-positive samples. The remaining two samples were negative by RT-PCR but positive by NASBA, whereas two other samples were positive by RT-PCR and negative by NASBA.
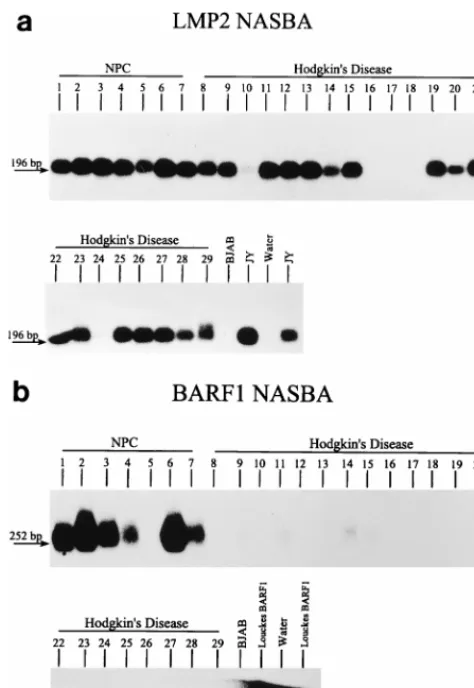
(ii) Evaluation of LMP2 and BARF1 NASBA on HD and NPC material. RNA isolated from a second series of HD material was subjected to BARF1 and LMP2 NASBA; these two NASBAs were also performed on NPC RNAs. The RNA quality of all samples was good, as shown by the presence of rRNA bands after gel electrophoresis. After gel electrophore-sis, blotting, and hybridization, we found clear signals with the LMP2 NASBA in 7 of 7 NPCs and 17 of 22 HD samples, whereas clear BARF1 signals were found only in the NPC material (in 6 of 7 cases) and not in the HD samples (Fig. 4).
DISCUSSION
In this study we have developed NASBA assays for the detection of EBNA1, EBER1, LMP1, LMP2, and BARF1 transcripts in cell lines and clinical material. NASBA appeared to be a specific and sensitive method for detecting different kinds of EBV transcripts. First, EBNA1 transcripts, belonging to a category of transcripts with unspliced coding regions but extensively spliced untranslated domains, were efficiently de-tected with primer combination 1.2-2.1. A direct comparison between RT-PCR and NASBA cannot be made for this target
because at present no RT-PCR has been developed that de-tects all the different EBNA1 transcripts. However, using RT-PCR for the Y3K-spliced EBNA1 transcript, a relative sensi-tivity similar to that of NASBA was found (3).
[image:4.612.138.462.68.314.2]For EBV transcripts containing splice sites within the coding domain, a direct comparison between NASBA and RT-PCR can be made. The present study shows that the LMP1 NASBA is at least as sensitive as the LMP1 RT-PCR described previ-FIG. 3. Relative sensitivities of the LMP1 (a), LMP2 (b) (left, primer set 1.1-2.2 [11/22]; right, primer set 1.2-2.1 [12/21]), and EBER (c) (left, RNAzol isolation; right, silica-based isolation) NASBAs and analytical sensitivity of the BARF1 NASBA (d). The relative sensitivity of the LMP1 and LMP2 NASBAs is 1 JY cell, and the analytical sensitivity of the BARF1 NASBA is 10 copies of cRNA; due to photographic reduction, these signals may not be visible. The relative sensitivity of the EBER NASBA after RNAzol isolation is 100 JY cells. The number of JY cells, and for BARF1, the number of cRNA copies, is indicated above each lane.1, positive control;2, negative control.
TABLE 3. Comparison of EBNA1 NASBA and RT-PCR on lymphoma material
Sample no. Diagnosisa rRNA
bandsb RT-PCRU1A a
EBNA1 RT-PCRa
EBNA1 NASBAa
QK
spliced splicedY3K
E95-20249 HD EBV1 1 1 1 2 1 E95-20252 HD EBV1 1 1 2 2 1 E95-20253 HD EBV1 1 1 1 2 1 E95-20254 HD EBV1 1 1 1 1 2 E95-20444 HD EBV1 1 1 2 2 1 E95-20448 HD EBV1 1 1 1 2 1 E95-20517 HD EBV1 1 1 1 1/2 1 E95-20522 HD EBV1 1 1 1 2 1 T84-9066 HD EBV1 1 1 1 ND 1 T91-3879 HD EBV1 1 1 1 2 1 E95-20229 HD EBV2 1 1 ND ND 2 E95-20255 HD EBV2 1 1 ND ND 2
S839 B-NHL 1 1 1 1 1
T93-12707 B-NHL 1 1 1 2 1 T93-8070 T-NHL 1 1 1 ND 2 T95-173 T-NHL 1 1 1 2 1 T88-11250 T-NHL 1 1 1 2 1
a1, positive after 4 h of exposure;2, negative; 1/2, only positive after
overnight exposure; ND, not done.
b1, present.
on May 15, 2020 by guest
http://jcm.asm.org/
[image:4.612.307.554.501.700.2]ously (3); direct comparison of the LMP2 NASBA and RT-PCR shows that the LMP2 NASBA is even more sensitive than the RT-PCR (data not shown).
For the unspliced EBER1 target, no reliable RT-PCR is available. In spite of the high expression of this transcript (15), the relative sensitivity of the NASBA seems to be very low. However, the analytical sensitivity of 100 copies—which is ac-ceptable (11)—shows that, for example, inefficient primer an-nealing can be ruled out as a cause of low relative sensitivity. Instead, the relative sensitivity of the EBER NASBA is more likely to be influenced by the efficiency of RNA isolation: the extensive secondary structures of the EBER transcripts (6) may prevent efficient precipitation during the RNAzol proce-dure and may also prevent efficient binding to the silica during the RNA isolation procedure of Boom et al. The small size of the EBER RNAs may also be a cause of inefficient precipita-tion during the RNAzol procedure and especially of lack of binding to the silica in the Boom method; this possibility is strengthened by the finding that NASBA specific for larger transcripts (e.g., EBNA1 and LMP1) was equally sensitive for RNA isolated by the RNAzol and the Boom methods (data not shown). Finally, BARF1 transcripts, which have an unknown splicing pattern, were also efficiently detected by NASBA.
An important difference between NASBA and RT-PCR as shown by our results is the impact of primer choice: even primers that meet all the necessary criteria may not be useful
in the actual NASBA reaction. Therefore, it is recommended that more than one primer set be designed for each transcript, of which the best combination can be used in the actual anal-ysis. This is in contrast with RT-PCR, as we previously showed that all primers selected proved to be useful for sensitive de-tection of EBV transcripts (3).
Because NASBA is well suited for direct analysis of specific gene expression in the presence of DNA and because high analytical sensitivities were achieved for the EBNA1, LMP2, and BARF1 NASBAs, these assays were evaluated on clinical material. Indeed, all NASBA assays tested appeared to be very suitable for detection of their respective transcripts in HD samples, NHLs, and NPCs, and the expression patterns found were in agreement with those described in the literature (4, 8). EBNA1 transcripts were detected in virtually all lymphoma samples tested. This finding is in agreement with the literature, since EBNA1 is indispensable for maintenance of viral latency (26). However, there were some discrepancies between RT-PCR and NASBA results. The fact that two samples were positive by RT-PCR but negative by NASBA was most likely due to the presence of agents in the input material that spe-cifically inhibit NASBA. Therefore, when analyzing clinical samples possibly containing such inhibiting agents (especially necrotic tissues or tissues containing large amounts of eryth-rocytes), extensive purification of the RNA is recommended, as well as the use of an internal standard (17) to monitor the NASBA reaction efficiency. On the other hand, two samples were positive by NASBA and negative by RT-PCR. This find-ing may also be due to factors that inhibit the RT or the PCR. Alternatively, this observation may reflect the fact that NASBA detects all possible transcripts and RT-PCR does not, as NASBA has the benefit of “cumulative” amplification of all transcripts.
We found LMP2 transcripts in both HD and NPC. This is in agreement with the literature; both HD and NPC have been reported to show an EBV latency type II expression pattern, which involves expression of EBNA1, LMP1, and LMP2 (4, 8). In 5 of 22 HD samples LMP2 transcripts were not detected, which may be due to no or low transcription activity, a low neoplastic/nonneoplastic cell ratio, the presence of inhibiting factors, or a combination of these.
The fact that BARF1 transcripts were detected only in NPC samples and not in HD samples demonstrates again the high specificity of the NASBA assay; in previous studies, using Northern blotting (20), BARF1 transcripts were found only in EBV-associated disorders of epithelial origin and rarely in those of lymphoid origin. In one NPC no BARF1 transcripts were detected; histological reevaluation of this sample showed that the actual percentage of neoplastic cells was very low compared to the amount of granulocytes and other infiltrating cells, thus explaining the negative result. One HD case showed a faint BARF1 signal, which can be explained by the fact that in (reactive) lymphoid cells BARF1 is expressed, albeit at a very low level (20).
[image:5.612.51.288.69.413.2]In conclusion, this study shows that NASBA can be used for expression analysis of all types of EBV transcripts, including those for which the splicing pattern is unknown and those in which splicing is entirely absent. In fact, NASBAs have been developed for other EBV transcripts which may play a role in EBV-mediated lymphomagenesis. Examples of these are BCRF1 transcripts encoding a protein structurally and func-tionally homologous to interleukin-10 (24), which may play a role in viral evasion of the host immune response, and other early or late transcripts. Because most of these transcripts are unspliced and/or are derived from unknown promoters, NASBA can be a powerful tool in studying their expression. FIG. 4. Evaluation of the LMP2 (a) and BARF1 (b) NASBAs on NPC and
HD samples. LMP2 signal is observed in all NPC cases and in 17 of 22 HD cases, whereas BARF1 signals are only found in the NPC material (in 6 of 7 cases).
on May 15, 2020 by guest
http://jcm.asm.org/
ACKNOWLEDGMENTS
We thank S. Morre´ and P. Sillekens for useful advice during the optimization of NASBA assays and E. ’t Lam for excellent technical assistance.
This project was financially supported by the Dutch Cancer Society, grant VU 94-749.
REFERENCES
1. Bijl, J., J. W. van Oostveen, M. Kreike, E. Rieger, L. van der Raaij-Helmer, J. M. M. Walboomers, G. Corte, E. Boncinelli, A. J. C. van den Brule, and C. J. L. M. Meijer.1995. Expression of HOXC4, -C5 and -C6 in human lymphoid cell lines, leukemias, and in benign and malignant lymphoid tissue. Blood 87:1737–1745.
2. Boom, R., C. J. Sol, M. M. Salimans, C. L. Jansen, P. M. Wertheim-van Dillen, and J. Van der Noordaa.1990. Rapid and simple method for puri-fication of nucleic acids. J. Clin. Microbiol. 28:495–503.
3. Brink, A. A. T. P., J. J. Oudejans, M. Jiwa, J. M. M. Walboomers, C. J. L. M. Meijer, and A. J. C. Vandenbrule.1997. Multiprimed cDNA synthesis fol-lowed by PCR is the most suitable method for Epstein-Barr virus transcript analysis in small lymphoma biopsies. Mol. Cell. Probes 11:39–47. 4. Brooks, L., Q. Y. Yao, A. B. Rickinson, and L. S. Young. 1992. Epstein-Barr
virus latent gene transcription in nasopharyngeal carcinoma cells: coexpres-sion of EBNA1, LMP1, and LMP2 transcripts. J. Virol. 66:2689–2697. 5. Chen, C., R. H. Sadler, D. M. Walling, I. H. Su, H. Hsieh, and N.
Raab-Traub.1993. Epstein-Barr virus (EBV) gene expression in EBV-positive peripheral T-cell lymphomas. J. Virol. 67:6303–6308.
6. Clemens, M. J. 1993. The small RNAs of Epstein-Barr virus. Mol. Biol. Rep. 17:81–92.
7. Compton, J. 1991. Nucleic acid sequence-based amplification. Nature 350: 91–92.
8. Deacon, E. M., G. Pallesen, G. Niedobitek, J. Crocker, L. Brooks, A. B. Rickinson, and L. S. Young.1993. Epstein-Barr virus and Hodgkin’s disease: transcriptional analysis of virus latency in the malignant cells. J. Exp. Med. 177:339–349.
9. Jiwa, N. M., P. Kanavaros, P. Van der Valk, J. M. M. Walboomers, A. Horstman, W. Vos, H. Mullink, and C. J. L. M. Meijer.1993. Expression of c-myc and bcl-2 oncogene products in Reed-Sternberg cells independent of the presence of Epstein-Barr virus. J. Clin. Pathol. 46:211–217.
10. Kerr, M., L. L. M. Rowe, D. Croom-Carter, L. S. Young, S. M. Rookes, P. H. Gallimore, and A. B. Rickinson.1992. Three transcriptionally distinct forms of Epstein-Barr virus latency in somatic cell hybrids: cell phenotype depen-dence of virus promoter usage. Virology 187:189–201.
11. Kievits, T., B. van Gemen, D. van Strijp, R. Schukkink, M. Dircks, H. Adriaanse, L. Malek, R. Sooknanan, and P. Lens.1991. NASBA isothermal enzymatic in vitro nucleic acid amplification optimized for the diagnosis of HIV-1 infection. J. Virol. Methods 35:273–286.
12. Laux, G., A. Economou, and P. J. Farrell. 1989. The terminal protein gene 2 of Epstein-Barr virus is transcribed from a bidirectional latent promoter region. J. Gen. Virol. 70:3079–3084.
13. Laux, G., M. Perricaudet, and P. J. Farrell. 1988. A spliced Epstein-Barr virus gene expressed in immortalized lymphocytes is created by circulariza-tion of the linear viral genome. EMBO J. 7:769–774.
14. Lear, A. L., M. Rowe, M. G. Kurilla, S. Lee, S. Henderson, E. Kieff, and A. B. Rickinson.1992. The Epstein-Barr virus (EBV) nuclear antigen 1 BamHI F promoter is activated on entry of EBV-transformed B cells into the lytic cycle. J. Virol. 66:7461–7468.
15. Lerner, M. R., N. C. Andrews, G. Miller, and J. A. Steitz. 1981. Two small RNAs encoded by Epstein-Barr virus and complexed with protein are pre-cipitated by antibodies from patients with systemic lupus erythematosus. Proc. Natl. Acad. Sci. USA 78:805–809.
16. Miller, G. 1990. Epstein-Barr virus: biology, pathogenesis and medical as-pects, p. 1921–1958. In B. N. Fields and D. M. Knipe (ed.), Virology, 2nd ed. Raven Press, New York, N.Y.
17. Morre´, S. A., P. Sillekens, M. V. Jacobs, P. van Aarle, S. de Blok, B. van Gemen, J. M. M. Walboomers, C. J. L. M. Meijer, and A. J. C. van den Brule. 1996. RNA amplification by nucleic acid sequence-based amplification with an internal standard enables reliable detection of Chlamydia trachomatis in cervical scrapings and urine samples. J. Clin. Microbiol. 34:3108–3114. 18. Oudejans, J. J., A. J. C. Van den Brule, N. M. Jiwa, P. C. de Bruin, G. J.
Ossenkoppele, P. van der Valk, J. M. M. Walboomers, and C. J. L. M. Meijer.1995. BHRF1, the Epstein-Barr virus (EBV) homologue of the bcl-2 (proto-)oncogene, is transcribed in EBV associated B-cell lymphomas and in reactive lymphocytes. Blood 86:1893–1902.
19. Sample, J., L. Brooks, C. Sample, L. Young, M. Rowe, C. Gregory, A. B. Rickinson, and E. Kieff.1991. Restricted Epstein-Barr virus protein expres-sion in Burkitt lymphoma is due to a different Epstein-Barr nuclear antigen 1 transcriptional initiation site. Proc. Natl. Acad. Sci. USA 88:6343–6347. 20. Sbih-Lammali, F., D. Djennaoui, D. Belaoui, A. Bouguermouth, G.
Decaus-sin, and T. Ooka.1996. Transcriptional expression of Epstein-Barr virus genes and proto-oncogenes in north African nasopharyngeal carcinoma. J. Med. Virol. 49:7–14.
21. Schaefer, B. C., J. L. Strominger, and S. H. Speck. 1995. Redefining the Epstein-Barr virus encoded nuclear antigen EBNA-1 gene promoter and transcription initiation site in group I Burkitt lymphoma cell lines. Proc. Natl. Acad. Sci. USA 92:10565–10569.
21a.Sillekens, P. (Organon Teknika). Personal communication.
22. Snudden, D. K., P. R. Smith, D. Lai, M. H. Ng, and B. E. Griffin. 1995. Alterations in the structure of the EBV nuclear antigen, EBNA1, in epithe-lial cell tumours. Oncogene 10:1545–1552.
23. Speck, S. H., and J. L. Strominger. 1985. Analysis of the transcript encoding the latent Epstein-Barr virus nuclear antigen I: a potentially polycistronic message generated by long-range splicing of several exons. Proc. Natl. Acad. Sci. USA 82:8305–8309.
24. Taga, K., J. Chretien, B. Cherney, L. Diaz, M. Brown, and G. Tosato. 1994. Interleukin-10 inhibits apoptotic cell death in infectious mononucleosis T cells. J. Clin. Investig. 94:251–260.
25. Wei, M. X., and T. Ooka. 1989. A transforming function of the BARF1 gene encoded by Epstein-Barr virus. EMBO J. 8:2897–2903.
26. Yates, J. L., N. Warren, D. Reisman, and B. Sugden. 1984. A cis-acting element from the Epstein-Barr viral genome that permits stable replication of recombinant plasmids in latently infected cells. Proc. Natl. Acad. Sci. USA 81:3806.
27. Zhang, C. X., G. Decaussin, J. Daillie, and T. Ooka. 1988. Altered expression of two Epstein-Barr virus early genes localized in BamHI-A in nonproducer Raji cells. J. Virol. 62:1862–1869.