© 2016, IRJET ISO 9001:2008 Certified Journal Page 1684
Optimization & Experimental Validation of Feeding Systemfor Steel
Casting Using Traditional and Simulation Technique- A Case Study
Bhushan Shankar Kamble
1, SudhirBaburao Mahadik
2, Ganesh Raosaheb Dhaware
2,
Kapil Ganesh Mehta
2, DhanajiAnanda Gundap
21
Assistant Professor, Dept. of Production Engg., KIT’s College of Engineering, Kolhapur, Maharashtra, India
2UG student at Dept. of Production Engg., KIT’s College of Engineering, Kolhapur, Maharashtra, India
---***---Abstract –
In metal casting there is always a compromise between the cost involved in the production of cast component and the quality required. Besides, it is always desired that the yield of casting is maximized against the volume of feeder/riser accommodated to meet the solidification shrinkage requirement.In this article an optimization framework is presented based on CAD and simulation. During metallurgical process, it induces casting defects like shrinkage, porosity and hot tears. To eradicate and eliminate these problems, appropriate design of casting and methoding is necessary. The problems can be predicted and prevented by means of computer simulation of casting solidification [7].With practical approach oversized feeders
have normally been designed and tested on shop floor. This consumes lot of time and resources. Thus, there is a need for computer aided optimal feeder design coupled with solidification simulation so as to reduce the no. of the shop-floor trials and obtain enhanced yield and high quality, in minimal possible time.The simulated results are more or less similar with experimental results [1]. The combined program
enables foundry engineers to seamlessly carry out 3-D methods design, advanced coupled simulation, defects prediction, and casting optimization within an extremely user-friendly environment [3]
In this article experimentally it is observed that shrinkage cavity has shifted towards the feeder whereas it remained at the center of non-feeder part. Hence use of simulation helped in locating the optimum position and size of the feeder required[9] .It is concluded that the selection of
proper feeder affects the quality of casting and from casting simulation casting products can be develop very fast and time required in development of cast parts will be less.
Key Words: Volumetric shrinkage; Casting simulation; Feeding system design; Hot Spot, Casting yield; and Optimum design.
1. INTRODUCTION
Traditional casting trade has a long history and until now it has been the basis of the entire mechanical industry [9]. Metal casting is one of the primary methods of producing bulk shapes. Very complex shapes can be cast from nearly every metal, making casting an extremely versatile
process. In short words it is the shortest distance between raw material and finished good. Castings are made in sizes that range from fractions of an ounce to hundreds of tons. Casting process is one of the earliest metal shaping techniques known to human being. It means pouring molten metal into a refractory mold cavity and allows it to solidify. The solidified object is taken out from the mold either by breaking or taking the mold apart. The solidified object is called casting and the technique followed in method is known as casting process. For making highly intricate jobs, a lot of time in making the perfect mold to the last detail so hardly anyfinishing work was required on the casting made from the molds.
Fig-1.Basic casting process elaborating a mold and casted component
2. LITERATURE REVIEW
From the various literatures, it is found that numerical simulations of solidification have received considerable attention from researchers in the past.
© 2016, IRJET ISO 9001:2008 Certified Journal Page 1685 Location of feeder and its shape selection, Framework of
feeder design and optimization in order to maximize the yield and productivity against high rejection rate, Feeder neck proportions and a taper section so that modulus of the neck increases as it moves away from the casting. Moreover D Joshi, B Ravi in 2009, presented the classification and simulation based design of 3D junctions in casting wherein VEM was employed to predict the extent of shrinkage porosity defect and it was validated experiments. A benchmark part with 3D junction was also presented to show how simulation can be used to predict and prevent the defect by modifying the junction design.
Chvorinov in 1996 gave one of the earliest geometric based optimization efforts which was proposed on the modulus method and related it directly to solidification time of a casting. Wlodawer used Chvorinov’s rule to design the feeders in such a way that the modulus (M) of the feeder is greater than that of the casting and must increase by 10% from the casting across the ingate to the feeder for ensuring adequate feeding. He proposed a relationship between casting, neck and feeder modulus as 1 ∶ 1.1 ∶ 1.2. Then Dr, Ravi &Srinivasan in 1996, proposed the Vector Element Method (VEM) which determines the feed path and location of hot spot inside the casting, using the direction of the largest thermal gradient at any point inside a casting to move along a path which leads to a hot spot (a local maxima of temperature with gradients tending to zero).
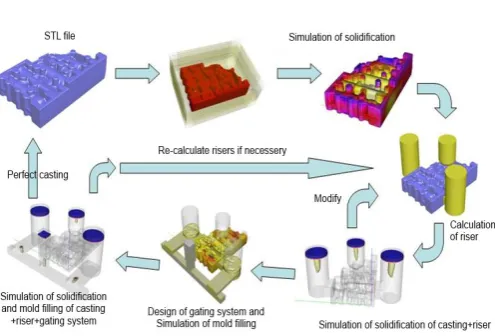
[image:2.595.310.556.299.443.2]3. METHADOLOGY:
Fig - 2: Web based Simulation methodology
A free ware web resource provided by E-foundry IIT Bombay is used for carrying out simulation on website http://efoundry.iitb.ac.in. Following steps are carried out for simulation and feedability analysis as shown in fig.2.. 1. Preparation of 3D Solid model of cast part using CATIA R16 and saving it as a .STL file format.
2. Browsing and uploading the casting 3D model .stl file on www.efoundry.iitb.ac.in
3. Selection of proper cast metal and method of casting as sand/Die casting.
4. After waiting till the simulation results are displayed this will identify hot spots location.
5. Hence as per hot spot location riser/feeder size and location is decided.
6.3 D Modelling the part with feeder and saving as a .STL file.
7. Revise Simulation again and checking the location of hot spots.
8. If hot spots are not shifted inside feeders, repeated steps 4-6, till hotspot shifts to feeder and an optimized feeder size and location is decided which improves the casting yield.
3. CASE STUDY:
Fig.3 Shrinkage defect over pulley
[image:2.595.37.285.453.621.2]Above fig. 3 showsa pully highlighting a shrinkage defect.Thecasting has, Volume of casting, Vc = 3.17*109 mm3, Surface area of casting, SAc =61000 mm2 mm. A wooden pattern for the selected component is prepared. The various allowances so provided on the pattern for Steel casting are as follows:
Table No.1
Allowance type Theoretical Allowance
Actual Allowance
Shrinkage 0.015 mm /mm 0.01 mm /mm
Initially design calculations were carried theoretically to find the various dimensions. Design calculations begin with calculation for pattern allowances followed by gating system and finally design of the feeder. Feeder design has been carried out using three different methods such as Caine's method,
3.1 Feeder Design Using Caine’s Method:
© 2016, IRJET ISO 9001:2008 Certified Journal Page 1686 The ‘freezing ratio’, of a mould is defined as the
ratio of cooling characteristics of the casting to the riser.
X =(
SA
V)casting
(SA
V)riser
Rectangular
Top Riser Cylindrical Top Riser Semi Spherical Top Riser
In order to be able to feed the casting, the riser should solidify last and hence its freezing ratio should be greater than unity. It may be argued that the sphere has the lowest surface-area-to volume ratio and hence that it should be used as a riser. But in a sphere, the hottest metal being at the centre, it is difficult to use it for feeding the casting.
The next best is the cylindrical type which is most commonly used for its ease in moulding.Based on the Chvorinov’s rule, Caine had developed a relationship empirically for the freezing ratio as follows:
X = a
Y−b+ C … … …. Where, Y =
Riser Volume
Casting Volume
a, b and c are constants whose values for Steel are 0.10, 0.06 and 1.08 respectively.
Volume of casting Vc = 3.17*109 mm3 Surface area of casting Ac = 61000 mm2 Considering a cylindrical riser with H/D = 1,
Riser Volume = πD3
4
SAriser=Surface area of riser = πD2+πD2 4
Freezing ratio,
X=
61000 3.17∗109
1.25∗𝜋∗ 𝐷 2
0.25𝜋 𝐷 3
= 3.84 ∗ 10−3∗ 𝐷
𝑌 =0.25𝜋∗𝐷3
3.17∗109 = 0.2477𝐷
3
Substituting the values of X & Y in Caine’s relation, we get
3.84 ∗ 10−3∗ D = 0.1
0.2477D3− 0.06+ 1.08
By rearranging the terms and solving the above equation we get, D =50.12 mm
Feeder neck dimensions due to geometry restrictions gives neck diameter, Dn=35mm
The empirical relations for top riser neck dimensions are: Length of neck, Ln = 15mm
Modified surface area of casting due to neck placement . SA casting= 61000-0.785*35*35=60038.375mm2
New casting modulus is =3.17∗109
60038 .375 = 5.2799 mm
Modulus of feeder, 𝐷
6 =
50
6 = 8.33 𝑚𝑚
Here, Mf ≥ Mc. Hence, design is safe. Also,
𝑉𝑓 + 𝑉𝑛 = 0.785 ∗ 503+ 0.785 ∗ 352∗ 15= 98537.12mm3
∴ Casting Yield = Vc
Vf +Vn +Vc∗ 100 = 60.12%
Simulating the above results in E-foundry and optimizing the hotspots we have the final feeder dimensions as:
D =50 mm,Dn =35mm, Ln =15 mm
Although modulus of feeder neck is less than modulus of casting, its effective modulus is always higher than the casting due to high heat transfer zone in the surrounding region of the neck.
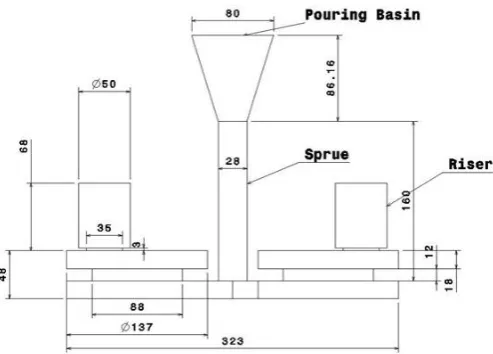
[image:3.595.314.561.359.536.2]3.2 Design of gating system components:
Fig. 4: Casting with designed gating and risering system as per Caines method with riser of Ø50 mm
The route path which molten metal follows to enter into the mould cavity is pouring basin to sprue to base well to runner to in-gates to mould cavity. The design of such path is as follows:
Weight of casting, W = 5.448 kg Pouring time, t= √W = 2.17 s
Considering t= 10 s ………..approximately Mass density of the molten metal, pm = 7850 kg/m3
Assuming top gating system with the entire sprue to be located in the cope itself,
Effective metal head (sprue height), H = 160 mm
© 2016, IRJET ISO 9001:2008 Certified Journal Page 1687
3.3 Virtual simulation using E-Foundry web tool:
By following steps enlisted in fig.2 and its description,Initially, the geometry was prepared in .catpart and was imported to ‘.stl’ (stereolithography) format. The ‘.stl’ file is then imported to ‘Sim Lab’ in E-foundry and then several iterations are simulated. The simulation is done with the following parameters:
Metal=Steel
Type of casting= Sand casting Sand Mesh= Fine
The simulation results with riser and without riser are shown as follows.
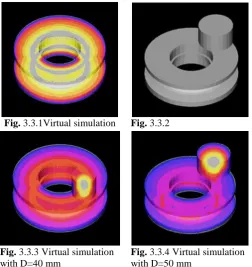
Fig. 3.3.1Virtual simulation Fig. 3.3.2
Fig. 3.3.3 Virtual simulation with D=40 mm
Fig. 3.3.4 Virtual simulation
with D=50 mm
The temperature contours obtained from E-foundry for the selected area are shown in fig.3.3.1. These contours locate the hotspot region in the given geometry.Blue colour indicates early freezing regions in casting, and white yellow indicates hot spot. Different iterations of simulation are carried with different feeder diameters. [10]
3.3 Discussions on results of Virtual simulation:
Fig.3.3.1 indicates the solidification zone in casted component without feeder. It is seen that at the circumference of pulley a local hotspot formation (white colour) leads to unavailability of feed metal during solidification leads to shrinkage cavity of large volume.
Fig.3.3.3 indicates the solidification zone in casted component with the feeder of diameter D = 40 mm. It is seen that the hotspot is not completely removed from the
casting and has some hotspot zone left inside the casting. Indicated by dark yellow regions.
Fig.3.3.4 indicates the solidification zone in casted component with the feeder of diameter D = 50 mm. It is seen that the hotspot is completely removed from the casting and it is completely shifted to feeder.
4. EXPERIMENTAL VALIDATION OF RESULTS:
As per design steps based on the Chvorinov’s rule, Caines method, feeder with diameter D =50 mm, diameter of neck Dn=35mm, and length of neck Ln =15 mm was selected and its effect on formation of hotspot was simulated as shown in fig.3.3.4.
[image:4.595.36.289.261.529.2]This result and design of feeder is experimentally validated by carrying out traditional metal casting process sequence as shown in fig.5. These are discussed step by step as follows.
Fig.5 Basic sand casting process sequence
4.1 Pattern Making:
Pattern is a replica tool to create a cavity in sand after ramming sand around pattern. The mould cavity so designed and prepared is shown in the fig.6 below.
[image:4.595.310.558.337.474.2]The casting is symmetrical about its horizontal axis hence a split pattern(cope and drag patterns) are prepared from wood .
[image:4.595.314.555.602.753.2]© 2016, IRJET ISO 9001:2008 Certified Journal Page 1688
4.2 Green sand preparation and Molding:
Fig.7 Green Sand Preparation
Table No.2
Description of additives Range
Grain Size AFS 50 to 80
Green Compressive Strength 550 to 900 gm/cm3
Permeability 80-100
Moisture 2.5-6.5 %
Active Clay 6-12%
Green sand is mixture of sand and additives to impart green strength to mold as shown in fig.8.Molding consists of all operations necessary to prepare a mold for receiving molten metal. Molding usually involves placing a molding aggregate around a pattern held within a supportframe, withdrawing the pattern to leave the mold cavity, and closing the mold. Green sand is prepared by adding following ingredients as shown in table no.2
Fig.8
Cope and drag molding box assembly4.3 Melting and pouring:
Fig.9
Melting and pouring using shank ladleThe preparation of molten metal for casting is referred to as melting. Melting is usually done in Induction furnace and the molten metal is poured in prepared molds by means of transfer ladle manually as shown in fig.9
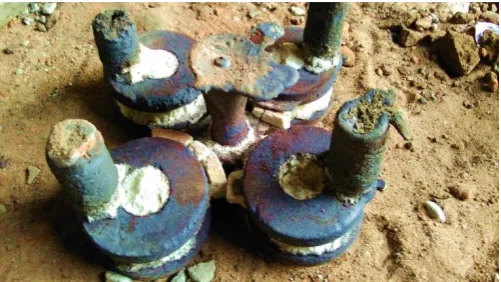
[image:5.595.36.292.124.236.2]4.6 Shakeout, fettling and cleaning:
Fig.10
Castings after Shakeout operationThe casting is separated from the molding sand referred as shakeout. Cleaning refers to all operations necessary to the removal of sand, scale, and excess metal from the casting. Defective castings are salvaged. Inspection of casting for defects and general quality follows.
[image:5.595.309.560.187.328.2]4.6 Inspections by destructive testing:
Fig.11
Casting sliced mechanically to locate internal voidIt is seen from the above cut-plane sections that casting is free from internal void. This indicates clearly that if appropriate amount of metal is available for the casting during solidification then shrinkage cavity can be eliminated.
This was predicted by the simulation and experimentally validated also.
3. CONCLUSIONS:
[image:5.595.306.560.438.531.2] [image:5.595.36.287.465.578.2] [image:5.595.37.287.623.751.2]© 2016, IRJET ISO 9001:2008 Certified Journal Page 1689 simulation is a powerful tool to visualize progressive
solidification of molten metal inside a mold cavity.
It helps in locating the riser at proper location to achieve directional solidification. By carrying out casting virtual simulation, material, time and money can be saved which are required in Foundry shop floor trials. From casting simulation casting products can be develop very fast and time required in development of cast parts will be less.
REFERENCES:
[1] T.Nandi, R.Behera, S kayal, A Chanda, G.Sutradhar,
(2011), Optimization of Riser size of Aluminium alloy
(LM6) castings by using conventional method and
computer simulation technique, International Journal of
Scientific & Engineering Research, Volume 2, Issue 11
[2] C. M. Choudhari, B. E. Narkhede, S. K. Mahajan ,(2013),
Modeling and Simulation with Experimental Validation of Temperature Distribution during Solidification Process
in Sand Casting,International Journal of Computer
Applications (0975-8887),Volume 78 – No.16
[3] S. Savithri, Roschen Sasikumar, Elizabeth Jacob,
(2014),Physics Simulation and Casting Defect Prediction
Using FLOW+, Indian Foundry Journal, Vol 60, No.8
[4] C. M. Choudhari, B. E. Narkhede, S. K. Mahajan,
(2014),Casting Design and Simulation of Cover Plate
using AutoCAST-X Software for Defect Minimization with
Experimental Validation,3rd International Conference on
Materials Processing and Chara,cterisation (ICMPC 2014) Procedia Materials Science,6,786- 797
[5] Harshil Bhatta, Rakesh Barota, Kamlesh Bhatta, Hardik
Beravalaa, Jay Shahb, (2014),Design Optimization of
Feeding System and SolidificationSimulation for Cast
Iron, 2nd International Conference on Innovations in
Automation and Mechatronics Engineering, ICIAME , Procedia Technology ,14, 357- 364
[6] B. Vijaya Ramnath, C.Elanchezhian,(2014), Analysis and
Optimization of Gating System for Commutator End
Bracket, 3rd International Conference on Materials
Processing and Characterisation (ICMPC 2014), Procedia Materials Science, 6, 1312-1328
[7] S. K. Paknikar,(2014), Innovative Simulation of Castings
–A Technology to Improve Quality of Castings as per Global Specifications with Case Studies , Indian Foundry Journal Vol-60 ,No.8
[8] C. M. Choudhari, B. E. Narkhede, S. K. Mahajan, (2014),
Methoding and Simulation of LM 6 Sand Casting for
Defect Minimization with its Experimental
Validation,12thGCMM, Procedia Engineering 97,
1145-1154
[9] A.K.Gajbhiye, C.M.Choudhari, D.N.Raut, B.E.Narkhede,
B.M.Bhandarkar, (2014), Minimization of Shrinkage
Porosity in A Sand Casting Process By Simulation In AUTOCAST-X Software with Experimental Validation by
Destructive testing , International journal of Modern
Engineering Research (IJMER), Vol.4 Issue 5.
[10] Bhushan S. Kamble, Pradnyesh V. Kadam,(2016),
Optimized Design of Risering System for Casted Component by Using Web Based Online Simulation
E-Tool, International Research Journal of Engineering and
Technology (IRJET), Volume 3 Issue 3, PP:1118-1122
BIOGRAPHIES:
Bhushan Shankar Kamble1
Assistant Professor,
KIT’s College of Engineering, Kolhapur, Maharashtra.
Area of Interest: Material science casting and virtual simulation
SudhirBaburao Mahadik2
U.G [Production Engineering] Student Dept. of Production Engineering KIT’s College of Engineering, Kolhapur,
Maharashtra[email protected]
m
Ganesh Raosaheb Dhaware2
U.G [Production Engineering] Student Dept. of Production Engineering KIT’s College of Engineering, Kolhapur,
Maharashtra[email protected]
Kapil Ganesh Mehta2
U.G [Production Engineering] Student Dept. of Production Engineering KIT’s College of Engineering, Kolhapur,
Maharashtra[email protected]
DhanajiAnanda Gundap2
U.G [Production Engineering] Student Dept. of Production Engineering KIT’s College of Engineering, Kolhapur, Maharashtra