PERFORMANCE EVALUATION OF NETWORK TOPOLOGY FOR
AD-HOC WIRELESS SENSOR NETWORK USING ANT COLONY
OPTIMIZATION ROUTING TECHNIQUE
Ali H. Hamad
Department of Information and Communication Engineering, Al-Khwarizmi College of Engineering, University of Baghdad, Baghdad, Iraq
E-Mail: [email protected]
ABSTRACT
In an ad-hoc wireless sensor network systems, the life time of sensor nodes is a crucial issue to ensure sustained functionality of the network. For a multi hop wireless sensor network the routing protocol used plays an important role in prolong the life time of the nodes. In this work, a routing technique based Ant Colony Optimization technique has been used and performance evaluation of different network topology is studied such as flat and clustered network. The system has been tested using six Telosb sensor nodes programmed with nesC language based Tinyos 2.1.2 under Linux operating system. Also a python program has been used to monitor the performance of the network and collect the required data.The obtained results shows a good performance in power consumption when using clustering technique rather than other network topologies.
Keywords: telosb, Ant colony optimization, wireless sensor network, Ad-hoc network, cluster network, LEACH.
1. INTRODUCTION
In general, wireless sensor network (WSN) consists of a small device (nodes) with limited resources such as energy, computation, and storage. An energy efficient algorithm in these limited and restricted resources is required [1, 2]. From network point of view, a WSN is different from other conventional network in three main aspects which are: First, a lot of redundant nodes may exists where the nodes number could be large; second, network topology can be changed easily since it uses ad-hoc network; third, battery may not be able to recharge especially in environmental monitoring or military systems [3].
Different key techniques are found in WSNs such as network topology, routing protocols, node localization and deployment, data aggregation, security issues, and etc. one of most important key in multi hop WSN is the routing technique[4]. Routing in WSNs is more challenge because of the limited resources of the sensor nodes such power and transmission capabilities, this will increase power consumption unless an appropriate routing algorithm is used. Usually, the WSN topology is application dependent which in turn will affect the routing technique used [5]. There are two main routing technique flat and hierarchical [6]. The clustering algorithm is usually done based on same rules such as hop and residual energy. The low energy adaptive clustering routing hierarchy (LEACH) is the most clustering routing algorithm used in multi hop WSN.
Enhancing the life time of WSN for a multi hop topology has been proposed by[5] where a mechanism to reap PEGASIS and APTEEN protocol is presented.[7]
metaheuristic in WSN. [9] Presents an ant colony based routing algorithm using improved heuristic function such that the life time of network is prolong. A modified ant colony optimization technique (mACO) has been proposed by [10] to find the energy efficient route for WSN to prolong the life time of the network. [11] Proposed an enhanced ant colony optimization algorithm (EACO) for critical node in a mobility wireless sensor network with optimization of routing path.
This paper is organized as follows; section 2 describes the hardware specification of the sensor nodes used in this work and also the required software tools. Section 3 shows the proposed routing technique based ACO while section 4 discuss the results obtained of power consumption with different network topologies. Finally, in section 5 the conclusion and future work are discussed.
2. HARDWARE AND SOFTWARE DESCRIPTION In this work, a Telosb sensor node has been used for testing the propose algorithm which can measure different environmental signals with a built in sensors such as humidity, light, temperature, and light. Also additional sensor can be added externally to this node. Telosb is an ultra-low power supported with a wireless module based IEEE 802.15.4, a 16-bit MSP430 microcontroller, and double AA size batteries [12].
change others.
[image:2.595.64.272.261.427.2] Sense message packet: This message carry the sensing values of different sensor within the node.
Figure-1. Three packet construction of the proposed using Tinyos..
3. ROUTING TECHNIQUE BASED ACO
ALGORITHM
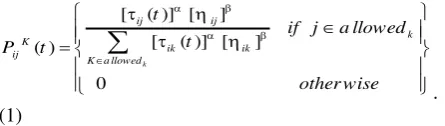
The ACO algorithm is designed such that each ant (node) can find its shortest path within the network. The ant moves from source s to destination d (next node) and hopping between nodes until reach the base station node. Ant k within sensor node i can move to the next node j based on probability function [13]:
[ ( )] [ ] [ ( )] [ ] ( ) 0 k ij ij k K ik ik ij
K a llowed
t
if j a llowed
t P t other wise
. (1)Where:τij is the pheromone concentration between source i and destination j and can be updated by the following equation:
𝜏𝑖𝑗(𝑡 + 𝑛) = 𝜌 ∗ 𝜏𝑖𝑗(𝑡) + ∆𝜏𝑖𝑗 (2)
hop count of one would broadcast a message to other nodes in the range. Now, if any node have any value of hop count other than zero would ignore this message otherwise, it would set its hop as the received count plus one. By doing so, nodes would be organized as a levels represented the hops from the base station (which have level zero).
In the second step, which is the normal work flow of the WSN each node would implement its own routing table consists of node ID, residual energy, and hop cont. This table would be rearranged by the ACO algorithm and sorted such that the highest priority node would be at the top of table (node with minimum hop count and maximum power).For any node in any level have a packet to be sent to the base station, it will apply the ACO algorithm to decide to which neighbour node it will send the packet. The routing table is updated continuously even though there is no packet to be sent (only node’s power is being changed). Each node broadcast a message telling other neighbour nodes by its currently status of the remaining power.Figure-2-a shows a schematic diagram of the proposed routing technique while Figure-2-b shows the flowchart of the proposed algorithm.
The ACO algorithm consider that as the node energy (τ) and the hop count (η) are high it will set this node with the highest probability. But in multi hop network as the node has lowest hop count it will be considered better since it will be nearest to the base station , thus the node hop count is converted using the following equation:
η=100*(0.5)hop count
(3)
Table-1. The converted hop count values.
Hop count η
1 50
2 25
[image:2.595.51.274.572.635.2]Each node in the network apply the ACO algorithm to find the best path to the base station except nodes in level one they will forwards their packets directly to the base station without need to apply ACO algorithm. Figure-4-a, b, c, d, e, and f shows sensor nodes power consumption which being 6%-9% for a transmission duration of 8 hours and 1 minute sampling time while the radio of all nodes is set on during the test time. Note that node 1 is the most power consumption in 9% since it communicate with all other nodes. The radio of the sensor nodes are set on along the
Figure-4. Power consumption of nodes: 1-a,2-b,3-c,4-d,5-e, and 6-f.
Case2:
The same network topology of case 1 is used as shown in Figure-5 in this case but with radio set on and off for power saving. Nodes 2, 3,4,5,6 send its packets to node 1 since it has the highest probability. Tables 2 and 3 shows the routing table for nodes 4 and 5. Figure-6-a, b, c, d, e, and f shows that the average power consumption of all nodes is about 6% which if compared with that of case 1 shows a little difference.
Figure-5. Case 2- two level network topology.
Table-2. Routing table of the Node 5.
ID Energy Hop Probability
1 80 1 0.33
2 81 2 0.24
4 79 2 0.22
3 74 2 0.20
Table-3. Routing table of the Node 4.
ID Energy Hop Probability
1 80 1 0.33
2 81 2 0.24
5 79 2 0.22
Figure-6. Power consumption of nodes: 1-a, 2-b, 3-c, 4-d, 5-e, and 6-f.
Case 3:
The network arrangement has been set as shown in Figure-7 with three levels up to the base station each level has two nodes such that the radio of nodes in level three (6 and 5) can communicates with nodes 4 and 3 in level two but cannot communicates with nodes 1 and 2 in level one due the far distance between different levels (up to 30 meters between each level). The routing table of
Figure-7. Case 3- three level network topology.
Table-4. Routing table of the Node 3.
ID Energy Hop Probability
2 75 1 0.42
4 81 2 0.35
5 77 3 0.22
Table-5. Routing table of the Node 6.
ID Energy Hop Probability
4 78 1 0.59
3 73 2 0.27
Figure-8. Power consumption of nodes: 1-a, 2-b, 3-c, 4-d, 5-e, and 6-f.
Case 4 Clustering
From the results shown in the previous cases a conclusion can be obtained that if the number of nodes is decreased in each hop level, power consumption can be decreased. This can lead to divide the nodes in area into a clusters each cluster has minimum number of nodes as possible. In this work, two cluster has been chosen and again the ACO algorithm is used to decide which node is the cluster head. Each cluster initially elect a cluster head
(node with minimum hop count and maximum power). Nodes within the cluster would apply the ACO algorithm as described in the previous cases. The cluster head node would act as a base station for this cluster such that nodes would forwards their packets to this node which in turn forwards the packets to other cluster heads and finally to the base station. The network arrangement is shown in Figure-9 while Figure-10 a, b, c, d, e, and f shows a major difference in power consumption in all nodes about 1%
Figure-9. Case 4 clustering network topology.
5. CONCLUSIONS
This work discuss the effect of network topology in power consumption of an ad-hoc wireless sensor network. From the obtained results it can be shown that
Figure-10. Power consumption of nodes: 1-a,2-b,3-c,4-d,5-e, and 6-f.
REFERENCES
[1] A.F. Marhoon, A.H. Hamad. 2015. A new real-time resource-efficient algorithm for ECG denoising, feature extraction and classification-based wearable sensor network. Int. J. Biomedical Engineering and Technology. 18(2).
[2] W. Zhang, L. Li, G. Han and L. Zhang. 2017.
[3] X. Liu, S. Li, M. Wang. 2016. An Ant Colony based Routing Algorithm for Wireless Sensor Network. International Journal of Future Generation Communication and Networking. 9(6).
[8] R. Latha, P. Vetrivelan and M. Jagannath. 2017. Balancing Emergency Message Dissemination and Network Lifetime in Wireless Body Area Network using Ant Colony Optimization and Bayesian Game Formulation, Informatics in Medicine Unlocked.
[9] Palvinder Singh Mann and Satvir Singh. 2017. Energy efficient clustering protocol based on improved meta heuristic in wireless sensor networks. Journal of Network and Computer Applications.
[10] Y. Sun, W. Dong and Y. Chen. 2017. An Improved Routing Algorithm Based on Ant Colony Optimization in Wireless Sensor Networks. IEEE Communications Letters. 21(6).
[11]V. Sharma, A. Grover. 2015. A Modified Ant Colony Optimization Algorithm (mACO) for Energy Efficient Wireless Sensor Networks. Optik - International Journal for Light and Electron Optics.
[12] M. Umadevia, M. Devapriyab. 2015. An Enhanced Ant Colony Based Approach to Optimize the Usage of Critical Node in Wireless Sensor Networks. Procedia Computer Science. 47, pp. 452-459.
[13]Moteiv. 2004. Telos Ultra low power IEEE 802.15.4 compliant wireless sensor module Revision B: Humidity, Light, and Temperature sensors with USB. Telos (Rev B): Preliminary Datasheet.