2018 2nd International Conference on Modeling, Simulation and Optimization Technologies and Applications (MSOTA 2018) ISBN: 978-1-60595-594-0
Abnormal Data Screening Method of Thermal Power
Based on BP Neural Network Algorithm
Meng LI
1, Peng WANG
1, Jun-feng HU
1,
Chun-lei ZHOU
2,
Shuan-zhu SUN
2and Jiang LIN
31
North China Electric Power University, China
2
Jiangsu Fangtian Electric Technical Corporation, China
3
Lawrence Berkeley National Laboratory, The United States
Keywords: Emission model, BP neural network, Abnormal data screening.
Abstract. As China has been the biggest carbon dioxide emissions country in the world and taken electric power industry as a breakthrough to build carbon market, it is necessary to promote the use of carbon continuous emission monitoring system to improve the accuracy of carbon emissions accounting. Carbon emission model is built to convert CO2 flow rate and concentration to mass. The CO2 emissions per gas inflow is a relatively stable value with a random fluctuation and will be affected by gas inflow, which is called per CO2 emissions. Based on the BP neural network algorithm, we take per CO2 emissions, gas inflow, gas turbine load, steam turbine load as input layers to obtain a real value prediction interval of per CO2 emission, and conduct carbon emission abnormal data screening. In the case study, it is proved that the neural network algorithm give an efficient way to screen big CO2 emission abnormal data.
Introduction
The latest report from International Energy Agency shows that global carbon dioxide emissions reached 32.3Gt CO2, and China is the biggest carbon dioxide emissions country which account for 28% of total global CO2 emissions. In china, electric power plants produced 43% of total CO2 emissions, and growing demand for electricity is bound to lead to increase CO2 emissions[1].
China take electric power industry as the breakthrough to launch carbon market in 2017, and CO2 emissions form power plants are calculated according to requirements of the greenhouse gas emission accounting and reporting-part 1: power generation enterprise ruled the primary methods for determining CO2 emissions[2] which is called as emission factor method.
However the above method which is implementing in China is inaccurate. In addition to the emission factor method, in developed countries such as U.S. CO2 form coal-fired plants can be calculated from flue gas composition and volume measurements made by Continuous Emission Monitoring Systems (CEMS), which is named as CEMS method[3-5]. It has been proved that the CO2 emissions measured by CEMS method are more accurate than those calculated by emission factor method [5-7].
It is meaningful to learn from foreign advanced experience and perfect our carbon emission monitoring system. By the end of 2009, China has installed CEMS in most coal-fired plants for monitoring SOx, NOx, and transfer the monitoring data to environmental protection department in real time. This laid a good foundation for continuous monitoring of CO2 emission[8].
It is known that CO2 emissions are closely related to external monitoring parameters (gas turbine load, steam turbine load and gas inflow) measured by CEMS system. As far as we inferred that CO2 emissions per minute of gas inflow is a relatively stable value with a random fluctuation, and is called as per carbon emission which may fluctuate over time with varying gas inflow, and its random fluctuation range will also be affected by gas inflow. Accordingly we use BP neural networks to train CO2 emissions external factors which are gas turbine load, steam turbine load and gas inflow, and then we can get the prediction interval to screen for CO2 emissions anomalous data.
Carbon Emission Model
Continuous Emission Monitoring Systems may record emissions automatically via a computer or it may be necessary for emissions to be calculated manually. In order to convert CO2 emissions volume flow into CO2 emissions mass, CEMS systems is applied to measure CO2 flow and concentration directly. The equations below provides a method to be used to calculate CO2 emissions from direct emissions monitoring under CMES system[10].
The equations use the data gathered from flow rate and gas analyzer equipment to calculate mass emissions:
) 15 . 273 ( 314 . 8
2 2
2
T
C Q P MW
E CO CO
CO (1)
Where ECO2 is the mass of emissions in tonnes of CO2 released per second; MWCO2 is the molecular
mass of CO2 measured in tonnes per kilogram, for carbon dioxide is 44.01*10-3; P is the pressure of
the gas stream in kilopascals at the time of measurement. Q is the flow rate of the gas stream in cubic meters per minute at the time of measurement; CCO2 is the proportion of carbon dioxide in the volume
of the gas stream at the time of measurement; T is the temperature, in degrees Celsius, of the gas at the time of measurement; 8.314 is gas constant; 273.15 is the conversion factor from Celsius to Kelvin.
When measurements of CO2 mass are on a dry basis, use the following equation:
) 100
% 100
( 2
*
2 2
O H E
E CO
CO
(2) Where %H2O is moisture content of gas in the stack, percent.
Correlation Analysis Model
Select CEMS systems carbon emission external data(gas inflow, gas turbine load and steam turbine load) and CO2 mass calculated by CO2 emissions model to do correlation analysis, and take gas
inflow with the highest correlation coefficient to do correlation warning analysis[11].
Data Preprocessing
Excluding the measurement data with the non-zero port calibration and discharge failure in carbon emission continuous monitoring system.
Apply carbon emission model to convert CO2 concentrations into mass.
As flow rate and gas analyzer equipment has zero drift problem, we determine to do an equipment zero return. When the gas turbine load is zero, both gas inflow and CO2 emissions are zeroed.
The Significant of the Relationship
Verify the significant relationship between gas inflow and CO2 emissions, if the value P which is
obtained by the significance test method is less than 0.05, it is considered that there is a significant difference between two sets of data, and the calculated correlation coefficient at the time will reflects the true correlation of the data.
Pearson Correlation Coefficient Method
Assume that CO2 emissions is X, gas inflow is Y, and use following equipment to calculate the linear
correlation between gas inflow and CO2 emissions.
2 2
,
) ( ) (
) )( (
Y Y X X
Y Y X X y
x
(4) Where X, Y is the mathematical expectation of CO2 emissions and gas inflow.
Carbon Emissions Abnormal Data Screening Based on Bp Neural Network Algorithm
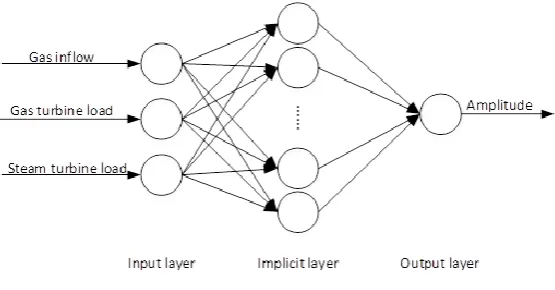
BP neural network is a typical multi-layer forward neural network which has one input layer, multiple implicit layer and one output layer, So we use three-layer BP network to design the model of carbon emissions abnormal data screening[11-14].
Input Layer Design
In this paper we define that CO2 emissions per gas inflow as per carbon emissions, and it will fluctuate
randomly around the stable value. We analyze that random amplitude fluctuation of per carbon emissions vary with time, in other words, it vary with gas inflow. This model take carbon emission external data of CEMS systems(gas inflow, gas turbine load and steam turbine load) and per carbon emissions as the input of abnormal data screening neural network model, which is
xi1,xi2,xi3,xi4
x
is vector of the simple i.
Output Layer Design
Per carbon emission is the output of abnormal data screening neural network model.
Implicit Layer Design
It has been proved that a three-layer network with Implicit layers can approximate any nonlinear function. There is no explicit formula for determining the number of neurons in the Implicit layer design, only some empirical formulas, so the final determination of the number of neurons is based on experience and experiments.
In this paper, the following empirical formula is used to select the number of neurons in the Implicit layer:
a m n
l (5)
Where: n is the number of neurons of input layer; m is the number of output layer; a is the number of implicit layer.
Figure 1. Training structure of BP neural network model.
Selection of Excitation Function
In this paper we choose tansig as the excitation function of implicit layer neurons. The output of the network is normalized to the rage of [-1,1], so the model also selects tansig as the excitation function of output layer neurons.
Case Analysis of Carbon Emissions Abnormal Data Screening
At first, calculated correlation coefficients between CEMS systems carbon emission external data(gas inflow, gas turbine load and steam turbine load) and CO2 emissions within a month and show
correlation of 0.81,0.79,0.46 which means CO2 emissions is related to external data. And then it is
considered that per carbon emission is relatively stable value with a random fluctuation, both stable value and amplitude which is calculated by the test value minus stable value are vary with time of changing gas inflow. So we design a BP neural network, take gas inflow, gas turbine load, steam turbine load and amplitude of per carbon emission as training set to obtain an predicted network. By choosing real value of each internal as testing set we can obtain an predicted interval to screening series of abnormal carbon emission data.
Data Selecting
Take an unnamed gas-fired unit which has installed CEMS system as the test unit, get a series of data measured by CMES systems in five months and use CO2 emission model to calculate CO2 mass.
Data Preprocessing
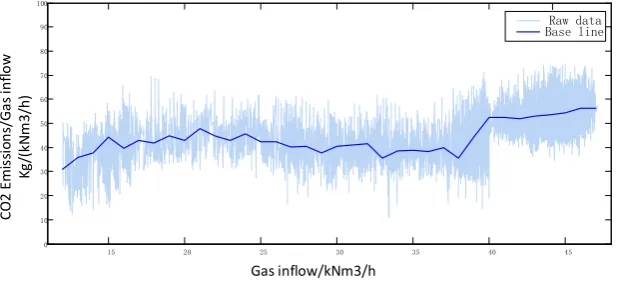
First of all, we select CEMS system monitoring data in may, delete time point when gas turbine load is zero or gas inflow is less than zero, and plot per carbon emission as a function of gas inflow. And then delete abnormal points when per carbon emission is more than 100 or less than 10 and unstable points which gas inflow is less than 12. Since the data when gas inflow is under 40 is too small, we added data when gas inflow is less than 40 in first four months and do above data preprocessing. Through data preprocessing we get 7757 data points where gas inflow is below 40 and 9121 data points where gas inflow is above 40, the number of total training data sets are 16878.
state of starting or stopping, the gas inflow is changing in this period, so the insufficient combustion of natural gas lead to a lower per carbon emission. While when the gas inflow is above 40, gas-fired unit is in stable operation and the load rat is above 75%, the full combustion makes a lager per CO2 emission. Finally we need to calculate the amplitude by using the test value minus based value which will be discussed in next step.
15 20 25 30 35 40 45
0 10 20 30 40 50 60 70 80 90 100
Raw data Base line
Gas inflow/kNm3/h
CO
2
Em
is
si
o
n
s/
G
as
in
fl
o
w
Kg
/(
kN
m
3
/h
[image:5.595.143.452.155.296.2])
Figure 2. The baseline of per carbon emission.
Amplitude Prediction Network of Per Carbon Emission
The BP network input layer has three nodes which are gas inflow, gas turbine load, steam turbine load and per carbon emission amplitude. the output layer only have one node which is per carbon emission amplitude, and the number of implicit layers nodes determined by empirical formula and equipment which we determined to chose 10, it has a better convergence.
Using MATLAB Neural Network Toolbox 8.2 to train abnormal data screening neural network, 16878 series of sample values were studied and trained, set the training 10000, the curve convergence and the optimal fit training error is 1.67%.
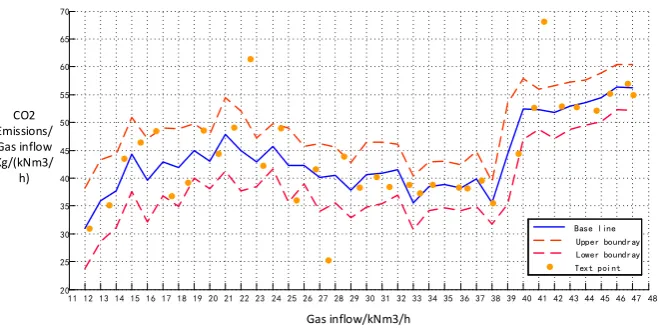
Real Value Prediction Interval
11 12 13 14 15 16 17 18 19 20 21 22 23 24 25 26 27 28 29 30 31 32 33 34 35 36 37 38 39 40 41 42 43 44 45 46 47 48 20
25 30 35 40 45 50 55 60 65 70
Base line Upper boundray Lower boundray Text point
Gas inflow/kNm3/h CO2
Emissions/ Gas inflow Kg/(kNm3/
[image:6.595.135.465.71.235.2]h)
Figure 3. Predication interval of per carbon emission.
Conclusions
In this paper, the CO2 emission data screening is analyzed. Carbon emission model is built to convert
CO2 flow and concentration to mass, and the carbon emission abnormal data screening based on
three-layer BP neural network algorithm is established, the training test results shows that the neural network algorithm not only has high efficiency but also has intelligence, it gives an efficient way to screen big CO2 emission abnormal data. The main cause of abnormal CO2 emission data is CEMS
system measurements errors which are need to be discussed in the further.
China presently use emission factor method to calculate CO2 emissions through gas inflow, the per
CO2 emission is a horizontal line which cannot reflect the change of value as gas inflow changes. At
the same time the emission factor tends to a smaller value to obtain a lower CO2 emissions, it requires
monitoring measures to avoid such practices. Due to the inaccuracy and high supervision check cost of emission factor method, it is recommended to use CEMS method. Because there is the deviation of CEMS system equipment, it is necessary to establish a reasonable and efficient carbon emission screening mechanism to check the abnormal CO2 emission data.
References
[1] International Energy Agency, CO2 Emissions from fuel combustion: overview (2017 edition) [EB/OL]
[2] State General Administration of the People"s Republic of China for Quality Supervision and Inspection and Quarantine, Standardization Administration Of The People's Republic Of China, “GB/T 32151.1-2015 Requirements of the greenhouse gas emission accouting and reporting-Part 1:Power generation enterprise”, China Standardization press, 2015.11.19;
[3] Ackerman, Katherine V., Sundquist, Eric T., “Comparison of two U.S. power-plant carbon dioxide emissions data sets”, Environmental Science and Technology, 2008, v 42, n 15, p 5688-5693;
for an energy supply utility”, Journal of the Air & Waste Management Association, 64:10, 1164-1173, DOI: 10.1080/10962247.2014.930078.
[7] Jeffrey C. Quick (2014), “Carbon dioxide emission tallies for 210 U.S. coal-fired power plants: A comparison of two accounting methods”, Journal of the Air & Waste Management Association, 64:1, 73-79, DOI: 10.1080/10962247.2013.833146
[8] Zhang Buwei, Zhang Xiaoyong, Cai Tongfeng,”The Differential Analysis of the Smoke-Letting Monitoring Data Between the Reference Ways and the Continuous Emissions Monitoring Systems(CEMS) in Power Plant”, Environmental Science and Management, 2009.9, vol 34 ,No 9, pp. 112-116;
[9] K R Gurney, J Huang, K Coltin, “Bias present in US federal agency power plant CO2 emissions data and implications for the US clean power plan”, Environmental Research Letters, 2016, 11 064005;
[10] Australia Government Department of the Environment and Energy, National Greenhouse and Energy Reporting Scheme Measurement Technical Guidelines for the estimation of emissions by facilities in Australia [EB/OL], 2017.10;
[11] Hongcheng Yan, Wenyi Liu, Xiuying Liu, et. al, “Predicting net asset value of investment fund based on BP neural network”, 2010 International Conference on Computer Application and System Modeling (ICCASM 2010), 2010, V10-635-V10-637.
[12] Yong Cao, Liwei Tian, Hongwei Zhao, “The application of BP neural net real-time data forecasting model used in home environment”, 2015 IEEE International Conference on Cyber Technology in Automation, Control, and Intelligent Systems (CYBER), 2015, pp. 1486–1490.
[13] Qiong Wu, Xiangmo Zhao, “AHS_BP algorithm and application in traffic parameters prediction”, 2017 29th Chinese Control and Decision Conference (CCDC), 2017, pp. 4073-4077.