Tunable and long-range energy transfer efficiency through a graphene nanodisk
Vasilios D. Karanikolas, Cristian A. Marocico, and A. Louise Bradley*
Photonics Group, School of Physics and CRANN, Trinity College Dublin, College Green, Dublin 2, Ireland
(Received 2 October 2015; revised manuscript received 11 December 2015; published 15 January 2016) In this paper, we present a theoretical investigation of the energy transfer efficiency between a pair of quantum emitters placed in proximity to a conducting graphene nanodisk. The energy transfer efficiency quantifies the contribution of the energy transfer process to the relaxation of the donor quantum system, as compared to the spon-taneous emission rate of the donor in the absence of the acceptor. We use in our calculations the Green’s tensor for-malism in the electrostatic limit. This approximation works very well for the nanodisks considered here, for which the radius is much smaller than the emission wavelength of the donor. The approximate analytical solutions ob-tained are used to investigate the decay rate of a single quantum emitter and the energy transfer rate between quan-tum emitters in the vicinity of the graphene nanodisk. We find that these rates are enhanced several orders of magni-tude compared with their free-space values. We determine the resonance frequencies of the spontaneous emission rate of a single quantum emitter to a graphene nanodisk, and the energy transfer rate between a pair of quantum emitters in proximity to a graphene nanodisk. We identify the surface modes which give the largest contributions to the energy transfer function. We connect the resonance frequency values and their surface plasmon wave numbers, which depend on the radius of the graphene nanodisk, with the dispersion relation of an infinite graphene mono-layer at the same chemical potential. Analyzing the distance dependence of these rates, we are able to fit the full numerical results with a simple analytical expression which depends only on the geometrical characteristics of the graphene nanodisk, i.e., its radius. We show that the interaction distance depends on the transition dipole moment orientation and the different order resonance frequencies. The interaction distance between a pair of quantum emit-ters increases from a free-space value of 20 nm to reach values of 120 nm in the presence of a graphene nanodisk. DOI:10.1103/PhysRevB.93.035426
I. INTRODUCTION
Graphene is a material with exciting properties which may be incorporated in the near future as a platform for all optical devices due to its tunable material properties [1,2]. In partic-ular, graphene plasmonics has emerged as a field of intense experimental [3–11] and theoretical investigation [12–18] over the last decade. Graphene has important advantages compared with conventional plasmonic materials, such as noble metals, where large material losses cannot be easily avoided [15]. Some of the desirable properties of graphene are better mechanical properties [19], the fact that graphene does not require a substrate, its low losses [15], and, due to its two-dimensional nature, huge optical enhancements when interacting with quantum emitters in close proximity [12,20]. The spontaneous emission (SE) rate of quantum emitters in proximity to a graphene sheet is enhanced several orders of magnitude compared with its free-space value [21–23]. This effect is due to the extreme confinement of light due to the two-dimensional nature of the graphene sheet [20]. Further confinement of light, by reducing the dimensionality, enhances these interactions even more [12] and has motivated this study. Another process of particular interest is the energy transfer (ET) process between a pair of quantum emitters which, in close proximity to a graphene sheet, can also be extended over large distances due to the excitation of propagating surface plasmon modes [23]. When the one-dimensional (1D) confine-ment of light is considered, as in graphene nanoribbons [12,20] and nanotubes [24,25], the propagation length of the surface plasmon is increased and thus so is the interaction distance.
For the case of a graphene nanodisk, the confinement of light in all three dimensions [12,26,27] produces large field enhancements which might be used in order to extend the interaction between quantum emitters to larger distances.
Graphene nanodisk structures have been investigated in depth over the last few years. Electrically gated patterned graphene nanostructures [5,28], nanodisks and nanorings, interact strongly with the incoming light and the confinement parameter is large compared with the radius of these nanos-tructuresλ3/R31. A patterned array of graphene nanodisks has been predicted to provide 100% absorption [29]. Similar predictions have been made concerning a photonic crystal consisting of nanoholes patterned in a graphene substrate in the near-infrared optical regime [30]. Furthermore, a graphene sheet decorated with small metallic nanoparticles, with zero chemical potential, can support strong absorption [31]. These interactions have been predicted to be blue-shifted when considering more layers of graphene nanodisks, instead of a single nanodisk [32,33]. Edge states and an applied magnetic potential can further influence the response of these nanostruc-tures [34,35]. Further quantum effects have been considered in the regime where nonlinear effects emerge in the coupled quantum emitter-graphene nanodisk system [36,37].
·nD|2σA(λ). (2)
For both these expressions, the quantity encapsulating the response to the graphene nanodisk is the Green’s tensor
G(rA,rD,ω). Classically, the Green’s tensor represents the response of the geometry under consideration to excitation by a pointlike dipole. Thus, we can see that rather than the field enhancement, it is the field strength that is most important. Furthermore, Eq. (2) shows that the ET rate is dependent on the SE rate of the donor QE. This has been verified by modeling experimental results concerning the ET efficiency between quantum emitters in the presence of gold nanospheres [43].
When the transition dipole moment of the QEs is oriented along z, a mode of particular importance can be excited, the breathing mode. Upon excitation by an electron beam it is found that it has the largest contribution to the electron energy loss spectrum [44,45]. This mode is analyzed in this paper and its connection with the graphene nanodisk radius is demonstrated. It has been proposed that the breathing mode of a graphene nanodisk can also be tuned through mechanical vibrations created by acoustic waves [46].
In this contribution we investigate the SE of a single quantum emitter and the ET function between a pair of quantum emitters in the presence of a graphene nanodisk. As quantum emitters, we consider two-level systems. Their quantum nature is taken into account in the non-Hermitian quantum electrodynamic description of light-matter interac-tions and of the SE and ET rates, introduced in Ref. [40]. We use an electrostatic method developed in Ref. [47], used recently in Ref. [18] and extended here, to calculate an electrostatic approximation of the Green’s tensor. We will see that this approximation works well for the near-field distances considered in our calculations, provided that the graphene nanodisk radius is large enough such that quantum effects are unimportant [48], but small compared with the emission wavelength of the QEs. Using this semianalytical method we can examine the dependence of the SE and ET rates and the ET efficiency on the separations between the quantum emitters and the graphene nanodisk, which is of significant importance when considering experiments such as in Refs. [8,11] where the graphene layer doping and distance dependence are considered for quantum emitters at telecommunication wavelengths. Our findings show that the interaction length between a pair of quantum emitters in the presence of a graphene nanodisk is enhanced up to one order of magnitude compared to the free-space value,
and a comparison with an infinite graphene monolayer is also provided. Furthermore, our findings suggest that, due to the electrostatic nature of the interaction, the main influence comes from the geometrical characteristics of the graphene nanodisk. We also identify the correlation of the resonance frequencies and their surface plasmon wavelengths with the dispersion relation of an infinite graphene monolayer. The surface plasmon wavelengths are determined purely by the radius of the graphene nanodisk and the radial mode number. Our results are quite general and can be applied to any two-dimensional material provided its conductivity is known and the electrostatic regime applies.
II. THEORETICAL INTRODUCTION
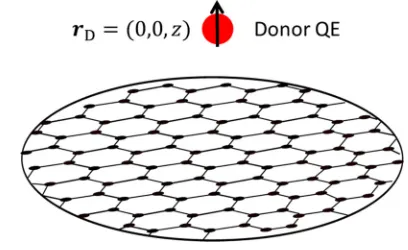
In this section, we introduce the basic quantities used throughout this paper to investigate the system sketched in Fig.1. We begin in Sec. II A by introducing the model which describes the conductivity of the graphene nanodisk. In Sec. II B, we construct the electrostatic Green’s tensor with the aid of which we will calculate the spontaneous emission (SE) of a quantum emitter and the energy transfer (ET) between a pair of quantum emitters in the presence of a graphene nanodisk.
A. Graphene conductivity
We calculate the graphene in-plane conductivityσ in the random phase approximation [49,50]. This quantity is mainly determined by electron-hole pair excitations, which can be divided into intraband and interband transitions. It can be expressed via the chemical potential μ, the temperature T, and the scattering energyESas
σ =σintra+σinter, (3)
where the intraband and interband contributions are [51]
σintra=
2ie2kBT π(ω+i/τ)ln
2 cosh
μ 2kBT
, (4a)
σinter= e 2
4
1 2 +
1 πarctan
ω−2μ 2kBT
− i 2πln
(ω+2μ)2 (ω−2μ)2+(2kBT)2
[image:2.608.330.534.71.196.2]
The intraband termσintradescribes a Drude model response corrected for scattering by impurities through a term contain-ingτ, the relaxation time. Throughout this paper we consider room temperatureT =300 K and a value of the relaxation time ofτ =1 ps and we vary the value of chemical potential μ[52].
B. Induced Green’s tensor in the electrostatic limit The main quantity needed in order to calculate the SE rate kSE of a single QE [Eq. (1)] and the ET rate kET between a pair of QEs [Eq. (2)] is the Green’s tensor. As discussed earlier, the QEs are represented through two-level systems and their quantum nature is fully taken into account. Further details on the relationship between the SE and ET rates and the Green’s tensor can be found in Refs. [40,42] where the macroscopic non-Hermitian QED description of light-matter interactions is presented. The emission wavelengths of the donor QE considered in this paper are above 1μm, while the graphene nanodisk radius is smaller than 40 nm and the donor-acceptor QE separations are smaller than 100 nm. We deal, therefore, with the near-field regime of the donor QE and the electrostatic approximation used in this paper is thus justified. We also verify this approximation by comparing its results with those obtained from a full numerical solution using the boundary element method (BEM) via the general public license softwareMNPBEM[53,54].
In the Appendix we derive the induced electrostatic Green’s tensor created by a point dipole excitation in the presence of a graphene nanodisk with radius R. We consider a free-standing graphene disk, thus, the host medium has a dielectric permittivityε=1. We consider the case for which the transition dipole moments of the donor and acceptor QEs are along thexaxis, with the donor QE placed atr=(0,0,z). Using Eq. (A24), the induced Green’s tensor has the expression
Gindxx(r,r,ω)= c 2
ω2
n=0
cn1(z,ω)cos(θ)
× ∞
0
[J0(pr˜)−J2(pr˜)]J2n+2(p)e−|z|/Rpdp,
(5)
where the acceptor position is given in cylindrical coordinates asr=(r,θ,z) and we have introduced ˜r=r/R, whileJk(x) is thek-order Bessel function of the first kind. When the acceptor QE is also placed in the middle of the graphene nanodisk,r=
(0,0,z), the integral in Eq. (5) can be performed analytically, leading to the full result
Gindxx(z,z,ω)=− c 2
2ω2 ∞
n=0
c1n(z,ω)[
(z/R)2+1−z/R]2n+2
(z/R)2+1 .
(6)
The zz component of the electrostatic induced Green’s tensor corresponds to the case when the transition dipole moments for both the donor and acceptor QEs are along thez axis. When the donor QE is placed atr=(0,0,z) and the acceptor at r=(r,θ,z), the zz component is given by the
expression
Gindzz(r,r,ω)= ∓c 2
2ω2
n=1
cn0(z,ω)
× ∞
0
J0(pr˜)J2n+2(p)e−|z|/Rpdp, (7)
where the minus (plus) signs holds for z >0 (z <0), ˜r = r/R, and Eq. (A24) is used. Again, when the acceptor QE is placed atr=(0,0,z), the integral in Eq. (7) can be calculated analytically, yielding
Gindzz(z,z,ω)=∓c 2
2ω2 ∞
n=1
cn0(z,ω)[
(z/R)2+1−z/R]2n+1
(z/R)2+1 .
(8)
The expansion coefficientscl
n(z,ω) are given as solutions of the matrix equation (A14) and their values depend on the position of donor QE, the angular eigenmodel, and the radial eigenmoden. Furthermore, they also account for the resonance behavior for specific values of the frequency, with more details presented in Sec. III. When the transition dipole moments are along the x axis, then l=1 [cf. Eq. (A19)], while for z-oriented transition dipole moments, we havel=0. This is due to the rotational symmetry and more details are given in the Appendix. The integrals over the Bessel functions in Eqs. (5) and (7) are calculated following Ref. [55].
III. RESULTS AND DISCUSSION A. Spontaneous emission
The spontaneous decay rateγis proportional to the strength of the transition dipole moment and the electromagnetic field strength acting on it. We introduce the normalized spontaneous emission rate as
γ
γ0
=1+6π c
ω Im[nQE·G(r
,r,ω)·n
QE], (9)
where the free-space spontaneous emission is given by γ0(ω)=ω3|p|2/3π 0c3 andnQE is a unit vector along the direction of the transition dipole moment of the quantum emitter.
In Fig.2, we present a contour plot of the SE rate as a function of the emission frequencyωof the quantum emitter and the radius of the graphene nanodiskR, when the dipole emitter is located atrD=(0,0,10 nm) and the value of the chemical potential is fixed atμ=1 eV. In Fig.2(a), the dipole is oriented along the x axis, while in Fig. 2(b) it is along thezaxis. For both orientations, as we increase the radius of the graphene nanodisk, more resonances emerge; this is due to the fact that radial eigenmodes with a higher orderncan now contribute in Eqs. (6) and (8). The values of the resonance frequencies are found by setting the external excitation to zero in Eq. (A14) and then numerically solving the equation
σ ωl n
ωl n
=2iε0R ζl
n
, (10)
where ζl
(a) x-oriented dipole (b) z-oriented dipole
FIG. 2. Normalized spontaneous emission rate of a quantum emitter placed 10 nm above the center of a graphene nanodisk for a fixed value of the chemical potentialμ=1 eV, as a function of the emission energy and disk radiusRfor (a)x-oriented and (b)z-oriented transition dipole moments of the emitter. The dashed lines represent numerical solutions of Eq. (10).
the disk geometry independent of radius, and ωl
n are the relevant eigenfrequencies for each radius R. Considering only the intraband contribution to the surface conductivity σ(ω)=8iπ αckBTln[2 cosh(μ/2kBT)]/[π(ω)], whereαis the fine-structure constant, ignoring the relaxation timeτ, and noting that μ/kBT 1, for the chemical potential values considered in this paper, we obtain the following expression for the resonance frequencies:
ωln=
4acζl
nμ
R . (11)
This expression gives the approximate physical dependence of the resonance frequencies on the geometric resonancesζnl, the chemical potentialμ, and the graphene nanodisk radiusR. We observe in Eq. (11) that forl=1,x-oriented dipole, and l=0,z-oriented dipole, we excite different sets of resonance frequencies. In addition, we can easily see that, as we increase the radius, the resonance frequencies are red-shifted, following
a √1/R dependence. The dashed lines in Fig. 2 represent precise numerical solutions of Eq. (10) and it is clear that the sharp resonance peaks in the SE rate follow the trend described by Eq. (11) for the resonance frequencies. Moreover, in Figs.2 and3 we observe that the SE resonances, corresponding to the higher-order modes from Eq. (10), are absent for energies above the chemical potential valueωl
n> μ. At these energies, the interband contribution of the surface conductivity [Eq. (3)] dominates and coupling of the emitter to these modes of the graphene nanodisk is dramatically reduced. Similar behavior is subsequently observed in Figs.5 and 6 when the energy transfer function is discussed.
Equation (11) also easily accounts for the behavior of the SE rate with varying chemical potential, following a √
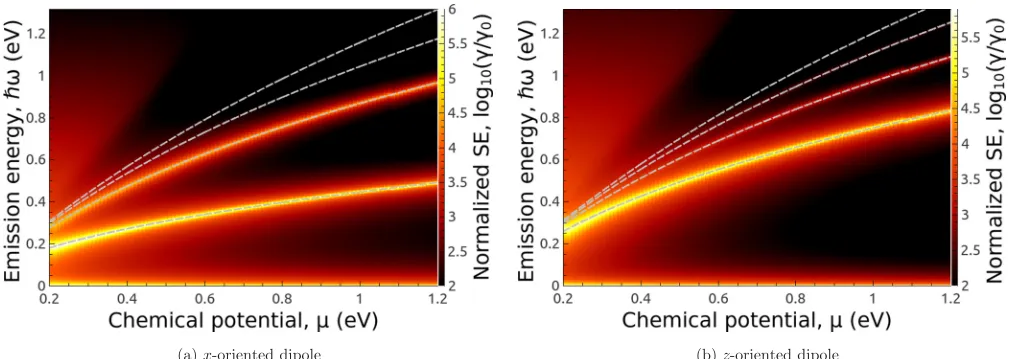
μ dependence, as seen in Fig. 3. Here, we present a contour map of the SE rate of a quantum emitter placed at rD=(0,0,10 nm), above a graphene nanodisk of radius R=15 nm, as a function of the emission frequency of the
(a) x-oriented dipole (b) z-oriented dipole
[image:4.608.52.559.527.707.2]FIG. 4. The spontaneous emission of a quantum emitter as a function of its positionrD=(0,0,z) above the graphene nanodisk for a
chemical potential,μ=1 eV and radii R=10 and 25 nm, is presented. The points represent values extracted using Eq. (18). (a) Mode expansion. The fits havem=3.96 and 3.90 when thez-transition dipole moment of the QE is considered forR=10 and 25 nm, respectively. For thex-transition dipole moment of the QE,m=6.0 fits for both values of the radiusR. (b) Boundary element method. The fits have m=3.91 and 3.95 when thez-transition dipole moment of the QE is considered forR=10 and 25 nm, respectively. For thex-transition dipole moment of the QE,m=5.9 fits for both values of the radiusR.
quantum emitter and the chemical potential of the graphene nanodisk. The emerging resonances are now blue-shifted with increasing chemical potential. Thus, by changing the value of the chemical potential, the graphene nanodisk resonances can be tuned to selectively couple to specific quantum emitters.
As we increase the distance between the quantum emitter and the graphene nanodisk, their interaction decreases, and at large distances it reverts to its free-space behavior. The orientation of the dipole moment of the quantum emitter has a large influence on the distance dependence. The spontaneous emission rate is given by the field induced by the dipole
source, which can be found from Eqs. (6) and (8). From these expressions, the induced field can be written asGind(r,r,ω)= resonance×geometrical dependence. The resonance term is given by M=[−ωG+(ω)K]−1 which is maximum at the resonance frequencies calculated from Eq. (10). The geometrical term is connected with the expansion coefficients of the dipole source [see Eqs. (A21) and (A23)].
Considering the distance dependence of the SE rate of a quantum emitter placed atr=(0,0,z) and with a transition dipole moment oriented along thexaxis, focusing only on the n=0 term, the induced electrostatic Green’s tensor then has
(a) x-oriented dipole (b) z-oriented dipole
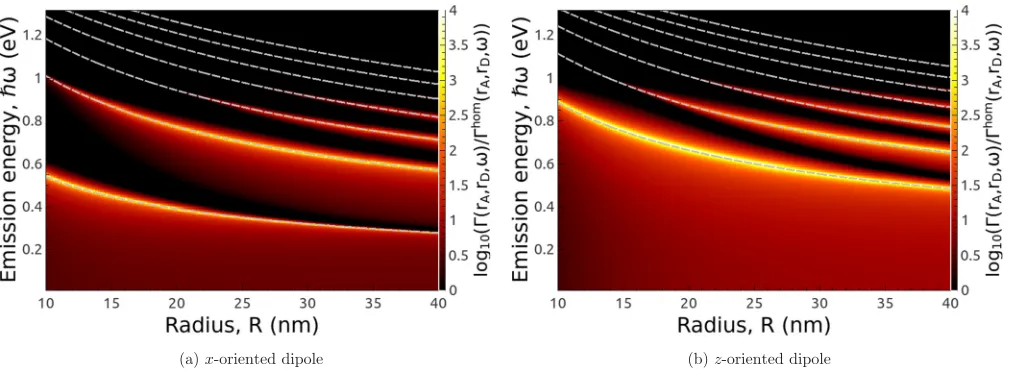
FIG. 5. Normalized ET function between a pair of quantum emitters, when the donor is positioned atrD=(0,0,10 nm) and the acceptor is
positioned atrA=(0,0,−10 nm), for a fixed value of the chemical potentialμ=1 eV, as a function of disk radiusR, for two orientations: (a)
[image:5.608.54.559.514.701.2](a) x-oriented dipole (b) z-oriented dipole
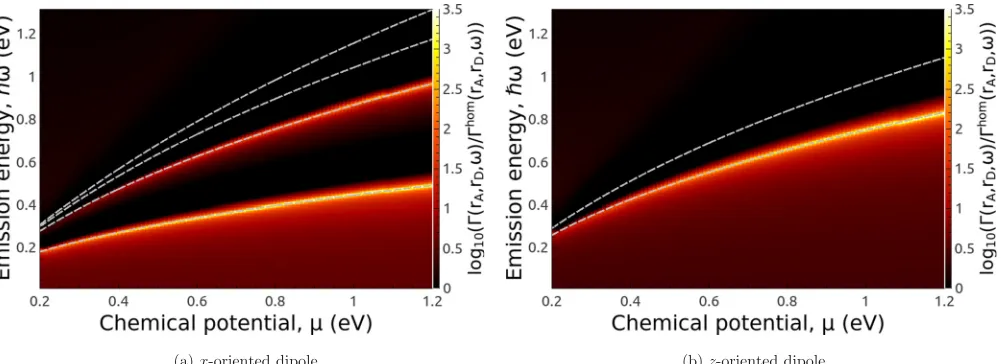
FIG. 6. Normalized ET function between a pair of quantum emitters, when the donor is positioned atrD=(0,0,10 nm) and the acceptor
is positioned atrA=(0,0,−10 nm), for a fixed radius of the graphene nanodiskR=15 nm, as a function of the chemical potentialμ, for
two orientations: (a)xorientation and (b)zorientation of the transition dipole moments of the donor and acceptor. The dashed lines represent numerical solutions of Eq. (10).
the form
Gindxx,n=0(r,r,ω)= −1 2c
1 n=0
[(z/R)2+1−z/R]2
(z/R)2+1 (12)
with
c10= iω R2σ(ω)M
1 i0D00
1 R2
1
0
x3
[x2+(z/R)2]3/2dx. (13)
From this, the distance dependence of the Green’s tensor becomes
Gindxx,n=0(r,r,ω)=resonance term× 1 R9
[√z2+R2−z]4 z2+R2 .
(14) If the transition dipole moment of the quantum emitter is along thezaxis, i.e., perpendicular to the graphene nanodisk, the distance dependence of the Green’s tensor is somewhat more complicated. Nevertheless, focusing on then=2 term, the induced electrostatic Green’s tensor has the form
Gindzz,n=2(r,r,ω)= −c0n=2[
(z/R)2+1−z/R]5
(z/R)2+1 (15)
with
c02= iω R2σ(ω)M
0
ijDjjd20. (16)
After some algebraic manipulation, the distance dependence is obtained as
Gindzz,n=2(r,r,ω)=resonance term× 1 R4
[√z2+R2−z]6 z2+R2 .
(17) In order to examine these approximate forms of the depen-dence of the SE rate on the distance away from the graphene nanodisk, we present in Fig.4several examples where the full calculations are fitted using an expression of the form
f(z,R)∝(z2+R2−z)m/
(z2+R2), (18)
with m being the fitting parameter. The choice of this expression is suggested naturally by Eqs. (14) and (17). We find a good agreement of the fitting with the full numerical calculation, which shows that the distance dependence follows the analytical expressions introduced earlier. In particular, in Fig.4(a)we see that for thez-oriented dipole and radiiR=10 and 25 nm, the value of the fitting parameterm=6 coincides precisely with the value given by Eq. (17). For thexorientation we find that m=3.9 is very close to the analytical value m=4 given by Eq. (14). The general behavior is, of course, more complicated than described by Eqs. (17) and (14), since different radial ordersncontribute to each resonance. For the case when we have a dipole source oriented along thezaxis and for then=2 order, we can see from Eq. (A25c) that there are different values ofmthat we can use as a fitting parameter. Nevertheless, the general distance dependence behavior can be explained with the fitting expression.
In order to compare the electrostatic approximation with full numerical results, we have used the boundary element method open source codeMNPBEM [53,54]. In MNPBEMthe graphene disk is modeled as a thin layer of thickness d = 0.5 nm with a dielectric permittivity described by [56]
ε(ω)=1+4iπ σ(ω)
ωd , (19)
where the surface conductivity is given by Eq. (3). Importantly, the full numerical results in Fig.4(b) give almost the same fitting parametersm.
Thus, we see that the dependence of the SE rate of a quan-tum emitter on its distance to a graphene nanodisk is primarily given by the geometrical characteristics of the structure and not by the material characteristics of the graphene nanodisk. For comparison, we consider the distance dependence of a quantum emitter above an infinite graphene sheet, which behaves as exp(−z/δSP), where δSP is the penetration depth of the surface plasmon on an infinite graphene sheet, given by δSP=Im(1/kSP
z ) withkSPz = √
k2−k2
[image:6.608.49.297.331.413.2]the penetration depth is δSP=24 nm at ω=0.35 eV and δSP=7 nm atω=0.6 eV. Figure4(a)shows, on the other hand, that the QE can interact with the graphene nanodisk at up to 80 nm for thezorientation and up to 200 nm for thex orientation, distances considerably larger than the penetration depth.
B. Energy transfer function
In this section, we present results for the enhancement of the ET function between a pair of quantum emitters placed in proximity to the graphene nanodisk. To do so we use the full Green’s tensor which has the form
G(rA,rD,ω)=Gind(rA,rD,ω)+Ghom(rA,rD,ω), (20)
where the induced part of the electrostatic Green’s tensor is given by Eqs. (5) and (7) for the x- and z-oriented transition dipole moments, respectively, and Ghom(r,r,ω) is the electrostatic homogeneous Green’s tensor which is given by the expression
Ghomij (rA,rD,ω)= c2
4π ω2R2(3 ˆRiRˆj−1), (21) withR=rA−rD. The ET function is defined as
(rA,rD,ω)= 2π
2
ω2 c2ε 0
2
|p·G(rA,rD,ω)·p|2, (22)
where pandp are the acceptor and donor transition dipole moments, respectively.
We start by considering the donor placed at rD= (0,0,10 nm) and the acceptor placed exactly on the opposite side of a graphene nanodisk, rA=(0,0,−10 nm), and we investigate the enhancement of the ET function between them. First, in Fig. 5 we present a contour plot of the logarithm of the normalized ET function ˜(rA,rD,ω)= (rA,rD,ω)/ hom(rA,rD,ω) for a fixed value of the chemical potentialμ=1 eV, as a function of the radius of the graphene diskR. Second, in Fig.6we show the normalized ET function
˜
(rA,rD,ω) for a fixed radius of the graphene nanodiskR= 15 nm, as a function of the chemical potentialμ. Comparing Figs. 5 and6 with Figs. 2 and3, we observe a behavior of the ET function very similar to the behavior of the SE rate, particularly the locations of the resonances.
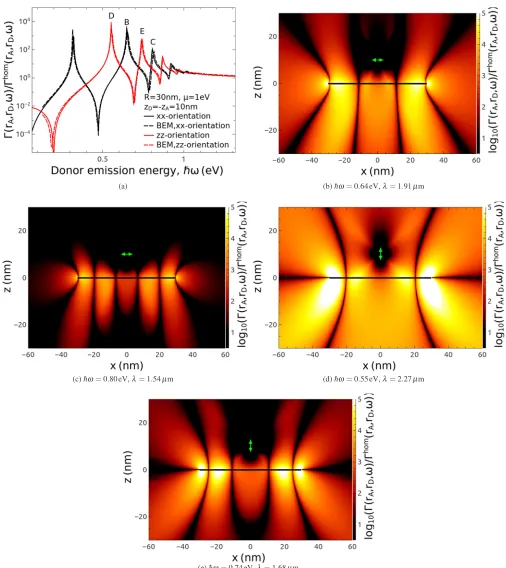
In Fig.7(a), we consider fixed positions for the donorrD= (0,0,10 nm) and acceptor rA=(0,0,−10 nm) for a single value of the chemical potential μ=1 eV for a disk radius ofR=30 nm. Furthermore, we consider two different dipole orientationsx andz, and clearly see the different resonance frequencies for the different orientations. We also observe that the normalized ET function ˜(rA,rD,ω) follows an asymmetric resonance of Fano type, and not a Lorentzian shape, as when considering the normalized SE rate. The dashed lines in Fig.7(a)represent numerical simulations usingMNPBEMand a good agreement is obtained between the two methods. In this regime, the electrostatic approach is expected to hold, when the donor-acceptor separations are smaller than the emission wavelength of the donor|rA−rD| λ.
Figures7(b)–7(e)present contour plots of the normalized ET function ˜(rA,rD,ω), when the donor is placed at a fixed position rD=(0,0,10 nm) and the acceptor scans the xz
plane rA=(x,0,z). Figures 7(b) and7(c) show the case of x component of the transition dipole moment of both the donor and acceptor, while Figs.7(d)and7(e)show the case ofzcomponent. The emission frequencies of the donor have been chosen from the peak values in Fig.7(a), in order to have the largest response of the graphene nanodisks. Details of the relevant parameters are found in the caption and below the individual panels. The scale of the color maps of Figs.7(b)–7(e)is fixed to allow direct comparison.
We first observe that when both donor and acceptor transition dipole moments are along thexaxis, the largest ET function enhancement occurs in the region of the circumfer-ence. When both donor and acceptor transition dipole moments are along thezaxis, the normalized ET function is reduced at points beyond the edge of the disk in the z=0 plane. Furthermore, as the emission frequency is increased, higher radial n-order resonances are involved and, consequently, the number of lobes increases, a general characteristic of plasmonic finite structures when localized surface plasmons are excited. As the number of lobes is increased, the field is more tightly confined to the graphene nanodisk.
In order to investigate the spatial extent of the ET rate presented in Fig.7, we focus on the induced part of the Green’s tensor given by Eqs. (5) and (7), for thex- andz-transition dipole moments of the donor and acceptor QEs. The different orders of the induced part of the Green’s tensor are given by
Gindzz,n(r,r,ω)=∓c 2
2ω2c 0 n(z,ω)
∞
0
J0(pr˜)J2n+2(p)e−|z|/Rpdp,
(23)
forn=1,2,3, . . .and
Gindxx,n(r,r,ω)= c 2
ω2c 1 n(z,ω)
∞
0
J02(pr˜)J2n+2(p)e−|z|/Rpdp,
(24)
whereJ02(r)=[J0(r)−J2(r)] cos(θ), forn=0,1,2. . .. The induced Green’s tensor is given as a summation of the radial eigenmodesn, each term having real and imaginary parts, as well as positive and negative contributions. Thus, through their summation, some terms may cancel. The spatial distribution is predominantly given by a dominant term, connected with the order of the resonance frequencyωl
n. The absolute value of the different orders presented in Fig.8is artificial since we cannot physically separate the radial modes due to the fact that the near field of the QE provides large wave numbers, thus being able to couple with different strengths to the different radial modes. Nevertheless, their spatial distribution can provide information on how the different eigenmodes influence the induced part of the Green’s tensor and can explain the extent of the field out of the plane of the graphene nanodisk.
FIG. 7. Normalized ET function between a donor-acceptor pair, when the donor is positioned atrD=(0,0,10 nm) for a fixed radius
R=30 nm, and a fixed value of the chemical potentialμ=1 eV. (a) Acceptor positioned atrA=(0,0,−10 nm) for two orientations, along
thexandzaxes. For the peak frequencies labeled B–E we present contour plots of the spatial distribution in thexzplane of the normalized ET function in panels (b)–(e). The transition dipole moment orientation in panels (b)–(e) is indicated by a green arrow.
breathing moden=1 has the out-of-plane distribution with the largest spatial extent. For the higher-order radial modes n >1, the induced part of the Green’s tensor [Eq. (23)] has more lobes and the field is more tightly confined to the
(a)(0,1) (b)(0,2) (c) (0,3) (d)(0,4)
[image:9.608.53.556.70.240.2](e) (1,0) (f) (1,1) (g) (1,2) (h)(1,3)
FIG. 8. Contour plots in thex-zplane of the logarithm of the absolute value of the induced part of the Green’s tensor log10(|Gind(r,s,ω)|2) for
a graphene nanodisk radius ofR=30 nm and a value of the chemical potentialμ=1 eV. The donor QE position is fixed atrD=(0,0,10 nm).
(a)–(d) The breathing model=0 for different orders of the radial eigenvaluen=1,2,3,4 for emission frequency ofω=0.74 eV is presented. The QE orientation is alongz. (e)–(h) The dipolar model=1 for different orders of the radial eigenvaluen=0,1,2,3 for emission frequency ofω=0.80 eV is presented. The QE orientation is alongx. The plotted eigenmodes are given as (l,n) pairs in each subfigure caption.
In Figs.8(e)–8(h), we show the different radial ordersn= 0,1,2,3 of the induced part of the Green’s tensor [Eq. (24)] corresponding to the SP dipolar mode l=1. The emission energy of the donor QE emitter isω=0.8 eV, corresponding to Fig. 7(c) which shows the l=1, n=2 resonance peak, labeled with C in Fig.7(a). When considering the spatial extent of the induced Green’s tensor, it can be observed that the higher-order modes are more tightly confined to the graphene nanodisk. The field distribution of the mode with n=2 in Fig.8(g)is seen to dominate the total induced Green’s tensor shown in Fig. 7(c). The dipolar mode l=1 for the radial eigenvalues n=0,1,2,3 has the largest values of the field distribution close to the graphene nanodisk [Figs.8(e)–8(h)]. The color map scales for eachlmode are fixed allowing for direct comparison.
We now investigate the available modes in more detail. In Fig.7(d)we present the enhancement of the ET function at an emission frequency corresponding to the l=0,n=1 breathing mode, which is a dark mode that cannot be excited by direct light illumination. Its properties have been analyzed in Ref. [44] which considers the plasmon modes of a metallic disk probed by electron energy loss spectroscopy. The response of this mode has the highest contribution to the loss spectrum of the electron beam. These modes can be described as standing plasmon waves which are confined to the graphene nanodisk and their surface plasmon wavelength is related to the radius of the nanodisk via λSP=2R/n, where n is the radial eigenmode. In Fig. 9, we plot the dispersion relation ω(kSPGM) for a free-standing infinite graphene monolayer with two different values of the chemical potential,μ=0.5 and 1 eV. Here,kSPGMis the in-plane surface plasmon wave vector and λGM
SP =2π/kGMSP is the surface plasmon wavelength of the propagating plasmon along the graphene monolayer. The surface plasmon wavelength λGMSP is the distance between successive maxima or minima of the propagating surface plasmon field. The graphene nanodisk geometry confines the SP in all three dimensions and only specific surface charge distributions are allowed, associated with the angular l and radial n eigenmodes. The resonance eigenfrequencies ω0
n,
which are solutions of Eq. (10), are presented in Fig. 9 as points, for the relevant SP wave numbers kSP=2π/λSP= nπ/Rfor radiiRfrom 10 to 40 nm and two values of the chem-ical potentialμ=0.5 and 1 eV. For the breathing modes, with l=0, the resonance eigenfrequenciesω0n, withn=1,2,3, for the different radii valuesR, overlap the dispersion branch of the infinite monolayer, for both values of the chemical potentialμ. In addition to the breathing mode, the graphene nanodisk supports dipolarl=1 and higher-l-order modes. Due to the fact that the position of the donor QE is at the center of the graphene nanodisk, it does not couple to the higher-l-order
FIG. 9. The surface plasmon dispersion ω(kSP) relation of an
infinite, free-standing, graphene monolayer is given as continuous lines for two values of the chemical potentialμ=0.5 and 1 eV. The eigenfrequencies of the plasmon resonancesωl
nof a graphene
nanodisk are given for the different values of the resonance wave numberkSP=nπ/R, for thel=0 withn=1,2,3 resonances and
kSP=1/R for the l=1, n=0 mode. The same values of the
[image:9.608.313.559.459.647.2](d)(1, 0) (e) (1, 1) (f) (1, 2)
FIG. 10. Contour plot of the real part of the surface charge density modes ρl
,n in the x-y plane excited by a donor QE placed at
rD=(0,0,10 nm). The graphene nanodisk has a radiusR=30 nm and chemical potentialμ=1 eV. (a)–(c) The transition dipole moment of
the QE is alongzand its emission energy isω=0.55 eV. The radial modes of ordersn=1,2,3 are presented. (d)–(f) The transition dipole moment of the QE is alongxand its emission energy isω=0.64 eV. The radial modes of ordern=0,1,2 are presented. The surface charge densityρ is normalized in the interval (−1,1) in all the panels and its eigenmodes are given as (l,n) pairs.
modes. These modes are highly confined at the edge of the graphene nanodisk. Thus, the field intensity connected with the dipolar mode with eigenfrequencyωln==10has a 1D profile due to confinement at the edge of the nanodisk. The SP wave number of this dipolar mode is given bykSP=2π/λSPwhere now the SP wavelength is given byλSP=2π R [44]. The dispersion relation of this dipolar mode overlaps the infinite graphene monolayer dispersionω(kGM
SP ). The SP wavelengthλSPfor the dipolar mode is related with the distance between minima along the periphery of the graphene nanodisk. More details of this analysis can be found in Ref. [45]. The contribution of these modes to the ET function can be seen in Figs.7(b) and7(c).
In order to further investigate the spatial distributions of the SP modes on the graphene nanodisk surface we consider now the modes of the surface charge densityρ (r), given by the expression
ρl,n(˜r)=r˜lcos(lθ)cnl(z,ω)Pn(l,0)(1−2˜r2), (25)
where ˜r=r/R,cl
n(z,ω) are expansion coefficients calculated from the matrix (A14), andP(l,0)
n (r) are the Jacobi polynomi-als. The expansion coefficientscl
n(z,ω) depend only on the position z and the emission frequencyω of the donor QE, and have a constant value once they have been calculated at the graphene nanodisk surface. In Fig. 10, an x-y contour plot of the charge density distributionρl,n(r) is presented. We focus on the case of a graphene nanodisk of radiusR =30 nm and a chemical potentialμ=1 eV. In Figs.10(a)–10(c)we presentx-y contour plots of the charge densityρ (r) created
by a QE for the case considered in Fig. 7(d). Due to the dipole orientation, alongz, only the breathing mode is excited, l=0, and the plots are shown for the three lower radial eigenmodesn=1,2,3. We observe that the distance from the center to the first minimum is determined by the disk radius and corresponds to the surface plasmon wavelengthλSP=2R/n. In Figs.10(d)–10(f), the surface charge distributionρ (r) is considered for the case shown in Fig.7(b), where the QE is oriented alongx, thus the dipolar mode is excited. The first three radial ordersn=0,1,2 are plotted. The SP wavelength λSPof the dipolar model=1 is confined at the edge, thus, its connection with the radius is through the relationλSP=2π R. The form of the charge distributionρl
,n(r) remains valid for all the different emission energies of the QE emitters, while only its strength changes, thus, the color maps presented in Fig.10 have been normalized to (−1,1).Through the distribution of the surface charge density, we can also account for the number of lobes appearing for the higher-order frequency resonances ωnl in Figs.7(b)–7(e). In Fig.10(b), the number of maxima and minima determines the number of lobes in Fig.8(b). The sur-face charge density is only confined to the graphene nanodisk.
(a) x-oriented donor and acceptor (b) z-oriented donor and acceptor
[image:11.608.55.560.67.449.2](c) x-oriented donor and acceptor (d) z-oriented donor and acceptor
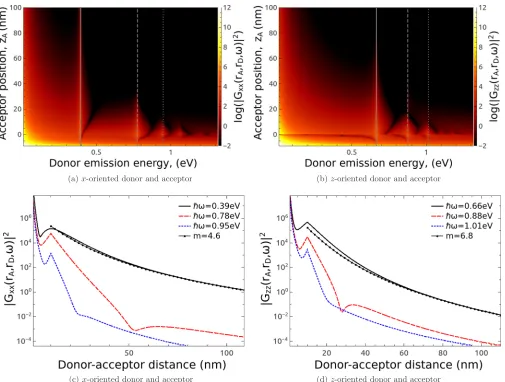
FIG. 11. Frequency and acceptor position dependence of the ET function for a donor placed atrD=(0,0,−10) nm for the case where both
donor and acceptor transition dipole moments are along the (a)xaxis and (b)zaxis. Donor-acceptor distance dependence of the ET function for frequencies marked by vertical lines in (a) and (b) when both donor and acceptor transition dipole moments are along thexaxis [cf. panel (c)] andzaxis [cf. panel (d)]. In all cases, the chemical potential isμ=1 eV and the graphene nanodisk radius isR=20 nm.
Once the required surface plasmon wavelength λSP for the nanodisk is known, the appropriate disk radius R can be determined.
Figures11(a)and11(b) present a contour plot of the ET function(rA,rD,ω)∝ |Gind(rA,rD,ω)+Ghom(rA,rD,ω)|
2 as a function of frequency and acceptor position for a fixed donor position rD=(0,0,−10) nm, when the donor and acceptor transition dipole moments are along the x axis [Fig. 11(a)] and along thezaxis [Fig.11(b)]. The acceptor is positioned atr=(0,0,zA). The chemical potential isμ=1 eV, and the radius isR=20 nm. We observe that for the x orientation, the normalized ET function has larger values which extend over larger distances compared with thezorientation. We also observe that the higher-order resonances decay faster than the main resonance, which is then=0 order for thexorientation and then=1 order for thezorientation.
We will now focus on the resonance frequencies from Figs. 11(a) and 11(b) and investigate the dependence of the normalized ET function on the donor-acceptor distance. The components of the induced Green’s tensor are given by
Eqs. (6) and (8), where we again separate these expressions in resonance and geometrical contributions. The situation is somewhat simplified now because the donor position is kept fixed. The xx component of the induced Green’s tensor is
G1xx,n(r,r)=resonance term×[
(z/R)2+1−z/R]2n+2
(z/R)2+1 , (26)
while thezzcomponent reads as
G0zz,n(r,r)=resonance term×[
(z/R)2+1−z/R]2n+1
(z/R)2+1 . (27)
In Figs.11(c)and11(d), the data obtained from the simulations are fitted with the function
f(z)∝(z2+R2−z)m/
resonance gives a value ofm=6.8, again close to the value m=6 forn=1 given by Eq. (27). Furthermore, the minimum in the next higher-order resonance occurs even closer to the graphene nanodisk, at a donor-acceptor distance of 25 nm. The appearance of a minimum can be seen atx =0 below the nanodisk in Fig.7(e)where we considered the normalized ET function (22) and it can be attributed to the nontrivial contribution of each radial eigenmode in the induced part of the Green’s tensor. The ET function(rA,rD,ω) falls off more rapidly for the higher-frequency resonances (similar behavior is seen in Fig.8). We consider the distance dependence further in the next section.
C. Energy transfer efficiency
When the donor is excited, it generally has two ways of relaxing to the ground state: by transferring its excitation energy to the acceptor with an ET rate kET, or by relaxing with decay rate kSE. The decay rate kSE takes account of photon emission into the far-field, intrinsic nonradiative recombination paths and coupling to surface plasmon modes. The SE and ET processes are, therefore, in competition with each other and we introduce an energy transfer efficiency to describe this competition. We will consider, in what follows, donors with a quantum yield of oneY0=1.0, which assumes no intrinsic losses such as phonon relaxation, etc.
Using the expressions we have introduced in Eqs. (1) and (2) for the SE and ET rates of ensembles of emitters and donor-acceptor pairs, we now define an energy transfer efficiencyη as [43]
η= kET
kSE+kET
. (29)
This quantity gives the relative contribution of the energy transfer process to the total decay rate of the donor. If the ET efficiencyηhas a valueη >50%, then the decay of the excited state of the donor occurs mainly by energy transfer to the acceptor, rather than relaxation into photon or SP modes.
When we consider real quantum emitters, the donor emis-sion spectrafD(λ) and acceptor absorption spectraσA(λ) are described by Gaussian distributions and not by the idealized δ distribution. The donor emission and acceptor absorption spectra are given by
Aqe−(λ−λq) 2/λ2
q, (30)
and3).
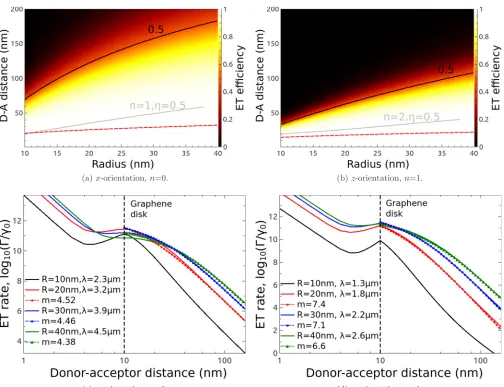
In Figs.12(a)and12(b), we present contour plots of the ET efficiency as a function of the radius of the graphene nanodisk R and the donor-acceptor distance rDA, when the donor position is kept fixed atrD=(0,0,10 nm) and the position of the acceptor varies. The value of the chemical potential is μ=1 eV. For each panel in the figure, the peak values of the donor emission and acceptor absorption spectra [Eq. (30)] are taken to be the resonance wavelength, calculated from Eq. (10). In Fig.12(a), for which the donor and acceptor transition dipole moments are oriented along the x axis and the resonance wavelength corresponds to n=0, we see that the interaction distance increases with the disk radius. The free-space 50% efficiency contour is given as the dashed red line. It corresponds to the so-called F¨orster radius. The interaction distance is considerably increased, reaching values well above 100 nm for the larger disk radii considered. In Fig. 12(b), for which the dipole moment orientation is along thez axis and the resonance wavelength corresponds ton=1, we observe that the interaction distance is smaller compared with the x orientation of the transition dipole, while still being larger than the free-space value. This is not surprising since the SE rate and the ET function follow similar trends, and more insight is given by Eqs. (A21) and (A23) where the different distance dependencies, for the different orientations of the transition dipole moment, are apparent. Furthermore, we consider the next higher-order resonances in Figs. 12(a) and 12(b) where we plot the 50% distance forn=1 and 2 resonances, respectively. We observe that the interaction distance is smaller than for the main resonances. This is a general characteristic for structures supporting localized surface plasmons, such as nanospheres, nanoboxes, etc. For these higher-order reso-nances, the interaction distance is also larger than in free space.
(a) x-orientation, n=0. (b) z-orientation, n=1.
(c) x-orientation, n=0. (d) z-orientation, n=1.
FIG. 12. (a), (b) Contour plot of the ET efficiency as a function of graphene nanodisk radius and donor-acceptor distance, for a fixed donor positionrD=(0,0,10 nm) and variable acceptor positionrA=(0,0,zA), and for different resonances calculated using Eq. (10). The solid
black line represents the 50% efficiency contour, while the dashed red line represents the same in free space. The gray line represents the 50% efficiency for then=1 (a) andn=2 (b) frequency mode resonances. (c), (d) ET rate as a function of donor-acceptor distance for the same fixed position of the donor. The chemical potential is everywhereμ=1 eV.
fact that the contribution from the induced part of the Green’s tensor [Eq. (20)] becomes dominant. When considering a z orientation for the transition dipole moments, similar results are obtained, with a fitting parameterm=6.6, for radius of R=40 nm, compared with the theoretical valuem=6. This discrepancy is attributed to the contribution of higher-order modes. The main difference between the behavior of the ET rate forx- andz-oriented donors and acceptors is the fact that the absolute values of the ET rate decay faster with distance for thezorientation, explaining the shorter distances over which efficient ET can occur. Furthermore, we want to point out, again, that the distance dependence of the energy transfer for a donor-acceptor pair is fully characterized by the geometrical dependence. This is one of the key results of this paper. This is in contrast with the case considering the interaction of a donor-acceptor pair in the presence of an infinite graphene sheet, for which the perpendicular distance depen-dence is characterized by the SP penetration depthδSP (see Sec.III A) [23].
[image:13.608.54.558.65.452.2](a) x-orientation, n=0. (b) x-orientation, n=1.
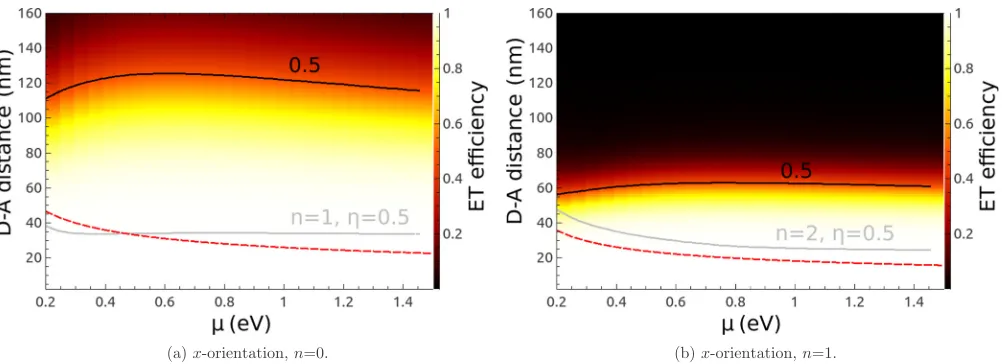
FIG. 13. (a), (b) Contour plot of the ET efficiency for varying the acceptor positionrA=(0,0,z), with a fixed position of the donor
rD=(0,0,10 nm),d=10 nm−z. The value of the chemical potentialμis varied for a fixed value of the radius of the graphene nanodisk
R=20 nm, with different resonance frequencies considered [Eq. (10)]. The solid black line represents the 50% efficiency contour, while the dashed red line represents the same in free space. The solid gray line represents the 50% efficiency for then=1 (a) andn=2 (b) frequency mode resonance.
IV. CONCLUSIONS AND OUTLOOK
In this contribution, we investigated the SE of a single quantum emitter and the ET function for a donor-acceptor pair in the presence of a gated graphene nanodisk. While investigating the SE and ET rates we saw that sharp resonances, due to the excitation of localized surface plasmon modes, can enhance these rates several orders of magnitude compared with their free-space values.
Furthermore, due to the competition between the donor SE rate and the ET rate from the donor to the acceptor, an energy transfer efficiencyηis introduced. In the case that the donor and acceptor are placed in the middle of the graphene nanodisk, and on opposite sides, the ET efficiency is enhanced compared with its free-space value, even for the higher-order resonances which are close to the telecommunication wavelengths.
Moreover, we investigated the distance dependence of the SE and ET functions and the ET rate. Our findings show that the distance dependence has a nontrivial behavior which depends on the radius of the disk. The full numerical results describing the interaction distance of a quantum emitter-graphene nanodisk and of a pair of quantum emitters in the presence of a graphene nanodisk are fitted with an analytical expression which depends on the nanodisk radius. In contrast, the perpendicular interaction between a pair of QEs in the presence of an infinite graphene sheet is dictated by the SP penetration depth [23], which is influenced by the value of the chemical potential and the emission energy of the QE. The interaction distance between a pair of QEs in the presence of a graphene nanodisk is increased, through the interaction with the localized surface plasmon modes of the disk. The interaction distance compared with the free space is increased by one order of magnitude, for the x-transition dipole orientation of the donor-acceptor QEs for disk radii above 15 nm. Furthermore, when the orientation of the transition dipole moments of the donor-acceptor QEs is along x, the interaction distance is larger compared with z-oriented transition dipole moments.
The eigenfrequencies of the breathing modes l=0, and their resonance wavelengths are connected with the dispersion relation of an infinite graphene monolayer. The surface plasmon wavelengths of the graphene nanodisk can be found for each radial eigenmode n from the graphene nanodisk radius. Similarly, we connected the dipolar model=1 with the dispersion relation of an infinite graphene layer. The dipolar modes are confined to the edge of the graphene nanodisk.
The knowledge of the distance dependence of the SE rate of a single QE and of the ET rate between a pair of QEs in the presence of a graphene nanodisk and the tunability of the interaction between them, through the applied voltage, is crucial for a plethora of applications. We also demonstrate a simple way that one can extract from the dispersion relation of an infinite graphene monolayer, the radius of a disk which has the desired resonance frequencies. The gating of an array of graphene nanodisks has been experimentally demonstrated in Ref. [5] and the tunability of the SE rate of the QEs interacting with a gated graphene sheet in Ref. [11]. Thus, the experimental investigation of the interaction of QEs with graphene nanodisks described in this paper is feasible. Possible applications such as tunable plasmonic rulers [7], surface-enhanced Raman scattering [61,62], quantum infor-mation [36], sensing devices [63,64], and light harvest-ing [65] could benefit from tunharvest-ing the interaction distance and efficiency.
[image:14.608.56.557.68.250.2]ACKNOWLEDGMENT
This work was supported by the Science Foundation Ireland under Grant No. 10/IN.1/12975.
APPENDIX: EIGENFREQUENCIES AND EIGENFUNCTIONS OF THE ELECTROSTATIC
POTENTIAL
In this appendix we provide more details for the calculation of the induced part of the electrostatic Green’s tensor of a gated graphene nanodisk. This method was first developed in Ref. [47] and used recently in Ref. [18] to describe the response of a graphene nanodisk to a plane-wave excitation. Here, we extend this formalism to account for a point like dipole excitation.
The electrostatic potentialφ(r) in the case of a graphene nanodisk is given by the Poisson equation
∇2φ(r)= − 1 ε0ε(r)
ρ(r), (A1)
where the charge density of the graphene nanodisk is given by ρ(r)=δ(z)ρ (r,θ)(R−r), which vanishes for r > R, the background dielectric permittivity is given byε(r)=ε+θ(z)+ ε−θ(−z), with ε+=ε−=1. We take advantage of the az-imuthal symmetry of the problem under consideration to write the electrostatic field in the formφ(r)=φ (r)φz(z) exp(ilθ), with the conditionφz(0)=1. Similarly, the charge density has the formρ (r )=ρ (r) exp(ilθ). We start by considering only modes with angular dependence l=0. Applying a Hankel transform on Eq. (A1) for the lth order, when z=0, the electrostatic potential has the form
φ(r)= ∞
0
pφ(p,z)Jl(pr)eilθdp. (A2)
Substituting Eq. (A2) into (A1), we obtain the following differential equation:
d2 dz2 −p
2
φ(p,z)=0. (A3)
A general solution of this equation reads as φ(p,z)= A±exp(∓pz). Applying the relevant boundary conditions that the potentialφ is continuous and its normal derivative has a discontinuity of the form
ε+∂φ(p,z) ∂z
z=0+
−ε−∂φ(p,z) ∂z
z=0−
=ρ (p), (A4)
we find the coefficients to have the form A±= 21ε
±ρ (p) 1 p. The total field is given by the inverse Hankel transform of φ(p,z), which, when used in Eq. (A2) yields
φ(˜r)= R 2ε0
1
0
dr˜Kl(˜r,r˜)ρ (˜r)˜r, (A5)
where ˜r=r/R and Kl(˜r,r˜)=0∞dp Jl(pr˜)Jl(pr˜). From now on, for simplicity we will make the change of variable ˜
r→r, unless otherwise specified.
We continue by using Ohms law J=σ(ω)E and the continuity equationiωρ(r)=∇·Jto find the expression
φ(r)= iω σ(ω)
1
0
drGl(r,r)ρ(r)r, (A6)
where 1 r ∂ ∂rr ∂ ∂r − l2 r2
Gl(r,r)= −δ(r−r )
r , (A7)
subject to the boundary conditions thatGl(0,r) is bounded and∂rG(r,r)|r=1−=0. The solution of Eq. (A7) is
Gl(r,r)= 1 2l
(rr)l+
r< r >
l
, (A8)
wherer>=max(r,r) andr<=min(r,r), forl=0.
Using Eqs. (A4) and (A6) and including the external potentialφext(r,r), we obtain the expression
2(ω) 1
0
drKl(r,r)ρ (r)r
−ω2
1
0
drGl(r,r)ρ(r)r= −φext(r,r), (A9)
where 2(ω)= −iωσ(ω)/2ε
0R. To solve Eq. (A9), we expand the charge density using the Jacobi polynomials
ρ (r)=rl ∞
j=0
cljPj(l,0)(1−2r2). (A10)
In order to calculate the integrals in Eq. (A9) and replace the integral equation with matrix equations, we make use of the orthogonality conditions of the Jacobi polynomials
1
0
dr Pi(l,0)(1−2r2)Pj(l,0)(1−2r2)r2l+1= δij 2(l+2j +1),
(A11)
and the integral identities 1
0
dr rl+1Jl(pr)Pj(l,0)(1−2r2)= 1
pJl+2j+1(p) (A12)
and ∞
0
p−2Jl+2i+1(p)Jl+2j+1(p)dp
= (−1)i−j+1
π[4(i−j)2−1](l+i+j+1/2)(l+i+j +3/2).
(A13)
Substituting the expansion of the charge density (A10) into the integral equation (A9), using Eqs. (A12) and (A13), we obtain a matrix equation
[−ω2G+2(ω)K]c= iωσ(ω)
R2 Dd. (A14)
When one neglects the external potentialφext(r,r), one is left with an eigenvalue problem
Kcln=ζ l nGc
l
+ δi,j+1
8(l+2j+1)(l+2j +2)(l+2j+3), (A16b)
Kijl = (−1)
i−j+1
π[4(i−j)−1](l+i+j +1/2)(l+i+j +3/2).
(A16c)
The above expressions are valid for l=0. When these angular modes are considered, there is no net induced charge density [see Figs.10(d)–10(f)]. The situation for the breathing model=0 is different, as we need to modify the boundary conditions at ˜r=1.
Equation (A8) is no longer valid forl=0 and the boundary condition is modified to read as∂rG(r,r)|r=1−=1, in which case the Green’s function has the form
G(r,r)= −ln(r>), (A17)
wherex>=max(r,r). Forl=0 the expansion of the charge density ρ is still valid and the Jacobi polynomials become the Legendre polynomials. Following similar considerations, we find that the matrix equation (A14) is still valid. Also, the matrices (A16) are correct except for the fact thati,j = 1,2,3. . .. More details can be found in Ref. [47].
The induced electrostatic potential can be written as
φind(r,r)= R 2ε0
∞
l,n
cln(r,ω) cos(lθ)
× ∞
0
p−1e−|z|/RpJl(pr)Jl+2n+1(p)dp,
(A18)
where forl=0,n=1,2,3. . ., and forl >1,n=0,1,2. . .. In Eq. (A18),randrare the non-normalized vectors.
We consider as an external excitation in Eq. (16) the potential produced by a point dipole source in order to investigate the interactions between quantum emitters in the presence of a doped graphene nanodisk. In the absence of the graphene nanodisk, the potential atrcreated by a dipole source positioned atr=(0,0,z) and oriented along ˆxis given by
φext(r,r)= p0 4π ε0
|x−x|
[(x−x)2+(y−y)2+(z−z)2]3/2
= p0 8π ε0R2
r(eiθ +e−iθ)
[r2+(z−z)2]3/2, (A19)
4π ε0R2
0 (r2+(z/R)2)3/2
where only thel=1 terms survive in the expansion, due to the orientation of the dipole source alongx. Thedi1 are then the components of the vectord of Eq. (A14). Then, we can easily compute the expansion coefficientscl
i of Eq. (A18). Similarly, the electrostatic potential atrcreated by a dipole source positioned atr=(0,0,z) and oriented along ˆzis given as
φext(r,r)= z−z
[(x)2+(y)2+(z−z)2]3/2
= 1 R3
z−z
[r2+(z−z)2/R2]3/2. (A22)
Due to the orientation of the dipole source, alongz, only the l=0 term in the expansion will survive and like Eq. (A21) we have for the expansion coefficients the relation
di0=2(2i+1)z
R3 1
0
rPi(0,0)(1−2r2)
(r2+z/R2)3/2, (A23)
where di0 are the coefficients of the vectord of the matrix equation (A18), wherei=1,2,3. . ..
The induced electrostatic Green’s tensor is given by the expression
Gind(r,r,ω)=ε0c2/(ωp0)∇φind(r,r) (A24)
[cf. Eqs. (5) and (7)].
The integrals in Eqs. (A21) and (A23) can be calculated analytically for each ordern, and in the following we provide the expressions for a few values ofn:
dnl==10= 2 R3
(√R2+z2−z)2 √
R2+z2 , (A25a)
d10= −6 z R3
R
z √
R2+z2−z √
R2+z2 −2
(√R2+z2−z)2
R√R2+z2
,
(A25b)
d20= −10 z R3
R z
√
R2+z2−z √
R2+z2 −6
(√R2+z2−z)2 R√R2+z2
+higher-order terms