7376
A MULTI-LEVEL E-COMMERCE ANOMALY DETECTION
MODEL USING OMSVM
1WOONG PARK, 2HYUNCHULAHN
1Ph.D. Candidate, Graduate School of Business IT, Kookmin University, Seoul, Republic of Korea
2Associate Professor, Graduate School of Business IT, Kookmin University, Seoul, Republic of Korea
E-mail: 1[email protected], 2[email protected]
ABSTRACT
In our modern digital society, enterprises have been forced to make rapid changes, called Cloud and Digital Transformation. Maintaining reputation by effectively managing risks and uncertainties pressures enterprises whose readiness cannot afford them. e-Commerce provides enterprise service-based internet platforms. These rapid changes have also manifested in the form of e-Commerce services; there is no doubt that sustaining a stable e-Commerce service is at the core of competitiveness in the coming digital transformation era. However, this involves architectural complexity. Thus we suggest a proactive approach that manages risks based on a machine learning algorithm, called anomaly detection. In particular, we propose a novel anomaly detection model that considers ordinal and multi-class cases that is effective in complex environments. Particularly, we propose OMSVM(Ordinal Multi-class Support Vector Machine) method for a multi-level e-Commerce anomaly detection. We also suggest a practical model evaluation method that exploits hidden information and provides numerical insights. Finally we discuss imbalanced data’s impact on multi-classes and solutions.
Keywords: Anomaly Detection, E-Commerce, Multi-class Support Vector Machine, Ordinal Pairwise Partitioning, OMSVM
1. INTRODUCTION
In the modern internet and digitally adherent society, e-Commerce service failure hinders the establishment of trust between customers and enterprise. The customers’ reactions appear varied but narrow into a single behavior that abandons e-Commerce Services that let them down and their favor switches to competitors. This phenomenon is defined as the Negative Spillover Effect that concludes in negatively impacting revenue [1]. An enterprise may inevitably have to implement radical changes to keep pace with the so-called Cloud and Digital Transformation. Customers will mainly experience the change on Commerce or e-Commerce-like platforms. Thus, it is obvious that maintaining e-Commerce reliability is highest priority behavior during and after the transformation.
We suggest that reliability can be proactively maintained using a machine learning-based anomaly detection technique that implements multi-class classification. Until now, most studies in anomaly detection have adopted binary classification approaches. However, we believe that a multi-class approach that considers the system complexity of
different levels of anomaly would be more appropriate [2].
We frequently encounter ambiguous cases in which detected outliers are determined to be either normal or abnormal. A multi-class anomaly detection model is required to respond properly and deal with them effectively according to the level of risk. Thus, we propose a multi-class classification model that considers ordinality. The proposed model classifies anomaly status into three different levels: class 1 as anomaly, class 2 as the status between abnormal and normal, and class 3 as normal.
7377 2. THEORETICAL BACKGROUND
In this section, we first briefly review anomaly detection techniques, focusing mainly on identifying the failure components of application crashes. Understanding differences between modern techniques and techniques used in the past may provide insight into how we can align our study with intelligent approaches. We also introduce the basic principles of conventional anomaly detection techniques. We then explain a machine learning algorithm, Support Vector Machine (SVM) and its associated multiclass approaches before discussing Ordinal Pairwise Partitioning (OPP) to clarify our suggested model.
2.1 Anomaly Detection
Anomaly detection has focused on the investigation of undesirable behavior changes. These negative changes are, at times, interchangeable with the term anomaly in machine learning research.
Path-based Failure Detection is an example of a
method previously used to identify negative changes [3] that was later embedded in other advanced approaches. The macro approach has focused on application component interactions rather than simple monitoring or code-level debugging [3]. The interaction approach is significant because tracing interaction behavior could help identify specific application patterns. The macro approach has increasingly extensive applications and has been renamed Pinpoint, after its anomaly determinant method was changed from statistical analysis to data mining [4]. Though past studies have tried to detect anomalies like application component failures, they have not concentrated exclusively on anomaly data analysis. Instead, they have tended to focus on identifying failure symptoms themselves. Thus, these approaches have not been well suited to the fluid modern enterprise environment. A model that contains specific features such as decreased effort, increased quickness, and high intelligence would be more well-suited to contemporary circumstances.
[image:2.612.295.531.37.173.2]The anomaly state can be defined as the existence of an undesired object or an unexpected behavior. Anomalies are patterns occurring beyond ordinary expectations [3, 5, 6]. In the e-Commerce context, anomalies are undesirable behaviors [2, 7] or threats associated with criminals [6]. In statistics, they are often referred to as outliers. Visualization helps to identify anomalies because they are positioned far from the means [7]. Figure 1 presents typical e-Commerce services anomalies.
Figure 1: A Typical E-Commerce Anomaly Pattern
[image:2.612.314.522.303.438.2] [image:2.612.316.521.502.625.2]Anomalies can be divided into 4 types: Point, Collective, Contextual [2, 8], and Pattern Anomalies [2, 9].
Point anomaly: Point anomalies are data points that deviate from mean groups or solid dots outside of normal groups [2]. Figure 2 shows a typical point anomaly. They are commonly used to provide insight regarding application latency or system resource utilization [2].
Figure 2: Point Anomalies
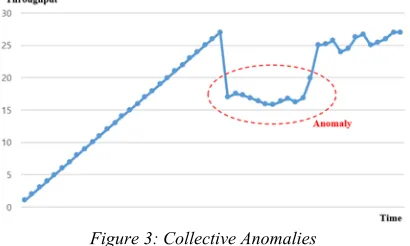
Collective anomalies: Collective anomalies are homogeneous data points or groups of anomalies representing sudden changes of throughput, as shown in Figure 3 [2].
Figure 3: Collective Anomalies
7378 Pattern anomalies: A performance trend can identify anomalous behaviors [2, 7], which recur in similar patterns.
These days, the role of anomaly detection has expanded and it has acquired research applications beyond already known domains. Technically, it is used to detect network intrusions and machine defects or errors while, socially, it contributes to the investigation of criminal activity including fraud detection in Anti-Money Laundering, Insurance Claims, and so on. The healthcare and medical domains are additional representative research areas where anomaly detection techniques play important roles [6].
In this study, we applied anomaly detection in the e-Commerce domain to identify and predict undesirable behavior. In other words, we extended the role of anomaly detection into the user experience (UX) domain, which could mitigate negative effects on customers.
2.2 Support Vector Machine
[image:3.612.92.294.522.681.2]Prior to kernel method emerging, linear basis learning theory was a suitable and appropriate classification method even though it had optimization problems such as local minima, greedy, heuristics, and misclassification risk [11]. The kernel method mitigates former optimization problems via convex optimization; meanwhile, statistical learning theory pursues generalized rule abstraction from training data [11, 12], and reduces misclassification risks. These capabilities lead us to assume that the combination of kernel and statistical learning theory could achieve high accuracy and it would be an ideal classifier.
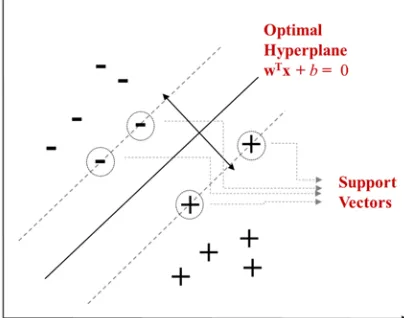
Figure 4: Support Vectors and Separating Hyperplane
SVM is a well-known kernel classifier [11, 13] and corresponds to our expectation. It achieves
maximum generalization so that the innate capability makes SVM applicable in solving various problems. SVM seeks an optimal hyperplane that decides the maximum margin and determines a closest example near the hyperplane called the support vector in the Figure 4. In the case of non-linear problems, the margin allows a certain range of misclassification by setting slack variables ξi ≥ 0.
Components such as the maximum margin, slack variables, and support vectors improve the linear accuracy but these components are insufficient for resolving real world problems. It is highly recognized that many problems are not linearly separable; rather, they are associated with non-linear problems. The kernel function(Ф) maps and shifts the linear discriminant equation (1) to the feature space equation (2) so that the kernel function transforms linear problems into a non-linear feature space.
𝑓 x w x 𝑏 (1)
𝑓 x ∑ 𝛼 Φ 𝑥 Φ 𝑥 𝑏 (2)
where w is weight, x is the training entity, and b is bias
Kernel function removes the non-linear drawback with complexities. Explicitly computing non-linear features consumes resources and requires large costs due to the quadratic complexity, particularly when they involve very high dimensional features [11, 12]. Thus, kernel function implicitly maps inner products that bound and define kernel K x, x
Φ x Φ x′ . The discriminant function is now:
𝑓 x ∑ 𝛼 K 𝑥, 𝑥 𝑏 (3)
where αi is dual representation
The equation reduces the quadratic complexity [11, 12, 14] and this implicit mapping process is called the “kernel trick". SVM kernel based optimization and generalization capabilities are effective when the training data size is small [11, 12, 14, 15, 16, 17]. This is possible because SVM trains on support vector composed of a small subset of the training data [18].
2.3 Multi-class Support Vector Machine
7379 (DAGSVM), and Error-Correcting Output Code techniques are other decomposition binary classifiers, whereas Weston and Watkins, and Crammer and Singer are techniques that consider all data simultaneously [14]. This section briefly explains decomposing algorithms, which are among the most popular approaches for solving multiclass problems [12].
One-Against-All: Extending conventional binary classification into the realm of multi-class problems, one-against-all is a well-known and commonly used method that separates one class from the rest. One-Against-All for k-class classification constructs k
binary classifiers in accordance with kth versus the rest. For example, it classifies class 1 versus all other classes and class 2 versus all other classes and repeats this process until the k versus resets [14, 19].
One-Against-One: One-Against-One, another commonly used approach, solves multi-class problems by constructing kC2 = k(k-1)/2 pairwise
classifications [14, 20]. For unidentified patterns, the maximum voting (also known as ‘Max Wins,’ and
‘Winner-Takes-All’) strategy is used [14, 20, 21] to
simplify unknown class selection processes in terms of effectiveness [20].
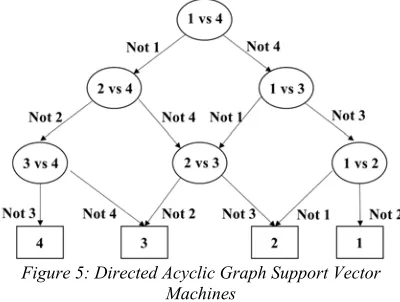
[image:4.612.94.294.544.695.2]Although it is comparably less popular, another significant multi-class method is Directed Acyclic Graph Support Vector Machines (DAGSVM) whose training methods are combined with one-against-one SVM and Decision DAG (DDAG) algorithms. It was introduced to mitigate known disadvantages of the one-against-one approach such as overfitting, slow evaluation caused by growth of classes, and unbounded generalization errors when combined with Max Wins [22]. DAGSVM helped bound generalization errors and significantly improved training and evaluation performance [22, 23].
Figure 5: Directed Acyclic Graph Support Vector Machines
DDAG is a learning method whose structure resembles a decision tree [23] called a rooted
binary-decision directed acyclic graph [14, 20]. DDAG learning methods require rooted binary-decision directed acyclic graphs that consist of k(k-1)/2 nodes and binary SVM classifiers at each nodes [14, 20, 23]. Figure 5 clarifies the concept of DDAG outlined in this section.
Despite SVM’s advanced features, SVM decreases accuracy in a certain domain. According to our experimental observations and those of other studies, it is obvious that SVM generalization significantly affects prediction performance in specific domains, particularly in anomaly and novelty detection, due to the fundamental drawback, of data imbalance [24, 25]. Therefore, we proposed a model, concentrated on e-Commerce application service anomaly detection, and we expected that this model will mitigate these exposure problems when it combined with a novel method.
2.4 Ordinal Pairwise Partitioning (OPP)
Traditional statistical classifications may be insufficient for emerging analytics requirements and analysis domains with ordinal data such as bankruptcy prediction or bond rating. OPP has evolved as kind of supplementary however very efficient in terms of an ordinal nature. OPP implicated on a bond rating problem and testified its advanced prediction rate with an unconventional method such as Neural Networks.
The main idea of OPP is to partition output data based on ordinal and pairwise approaches [26] and OPP has suggested combining the two partitioning and computation methods. Called OPP1, the first combination partitions (k-1) & k classes with forward and backward computation. For instance, OPP1 and the forward method divide datasets as (1 & 2), (2 & 3)…(k-1 & k), where k refers to classes. The backward method is a reverse form of the OPP1 and forward method combination. Called OPP2, the second combination partitions (k) & (Remaining Classes) with forward and backward methods. Dataset partitioning is a prerequisite of OPP2 and its forward and backward combination is formed as (1, 2 & 3) and (3, 2 & 1) [26].
7380 OPP approach and much applicable on the multi-class identification that expected to leverage prediction performance together with the Support Vector Machine algorithm. We presented this novel approach in section 3 as our suggested research model.
3. ORDINAL MULTI-CLASS SUPPORT VECTOR MACHINE FOR E-COMMERCE ANOMALY DETECTION
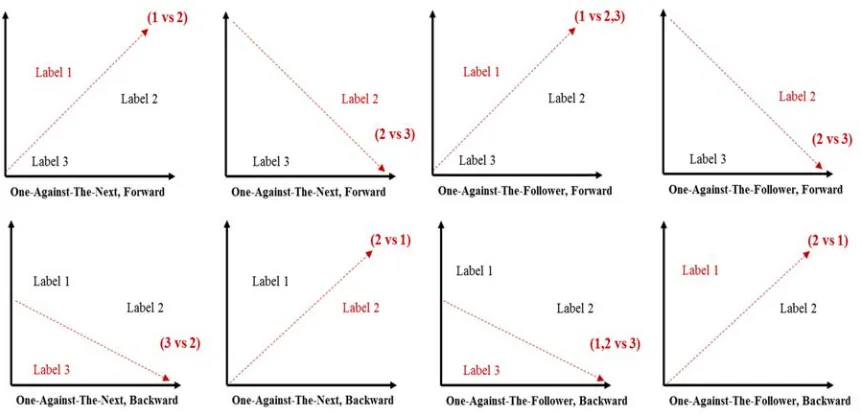
[image:5.612.319.520.308.449.2]OMSVM is a hybrid model that implements ordinal matter that is composed of Ordinal Pairwise Partitioning (OPP) [14] and Multi-class SVM. The main idea of OPP is that it divides datasets into sub-datasets (a dataset refers to a model) in a pairwise and ordinal manner [14]. Initially, OPP combined with Artificial Neural Network Technique to predict bond rating while OMSVM assembled OPP with MSVM to predict credit rating [7, 14]. OMSVM provides the more efficient partitioning methods One-Against-the-Next and One-Against-Followers that reduce classes (k-1 binary classifier); these methods respectively correspond to conventional One-Against-One and One-Against-All. OMSVM consists of four classification processes that combine two fusing methods, its comprehensive OMSVM structure [7] is shown in Table 1. The typical OMSVM implementation process is: 1) divide sub-datasets based on partitioning and ordinal manner for training purposes. Models 1,2,3, and 4 present the model examples. 2) Fusing binary classified datasets both forward and backward. 3) Finally, resolve input data appropriately to classes 1, 2, and 3. Figure 6 describes OMSVM partitioning progress.
Table 1: OMSVM Fusing And Partitioning
Partitioning
One-Against-the-Next
One-Against-The-Follower
Fusing Forward Model 1
(1 vs. 2) Model 2 (2 vs. 3)
Model 3 (1 vs. 2,3)
Model 2 (2 vs. 3)
Backward Model 2
(3 vs. 1) Model 1 (2 vs. 1)
Model 4 (3, vs. 2,1)
Model 1 (2 vs. 1)
Once the OMSVM process is complete, the proposed model consolidates three e-Commerce service statuses into pre-defined categories: Normal, Change, and Critical. The whole picture of the proposed model from data collection to anomaly detection is described in Figure 7.
[image:5.612.91.522.514.721.2]Figure 7: OMSVM Anomaly Detection And Classification
7381 4. EXPERIMENTAL DESIGN
4.1 Data Collection
We conducted experiments and ensured external validity, by training and validating a series of practical data, sourced from an insurance company. The key performance metrics that refer to independent variables were selected based on reliable studies [2, 27, 28]. The chosen independent variables were as follows: CPU, Java Heap Memory, Input/output disk ratio, and Network connections toward a Database. Our dependent variable, was the metric, of network connection to an e-Commerce service. We named the metric AppCnt, which stands for Application Connection Count. According to our observations, system resource changes are triggered by the number of application connection changes, thus we can assume that AppCnt reflect e-Commerce performance changes. It indicates that AppCnt is able to preserve a representative role that traces and determines e-Commerce service status.
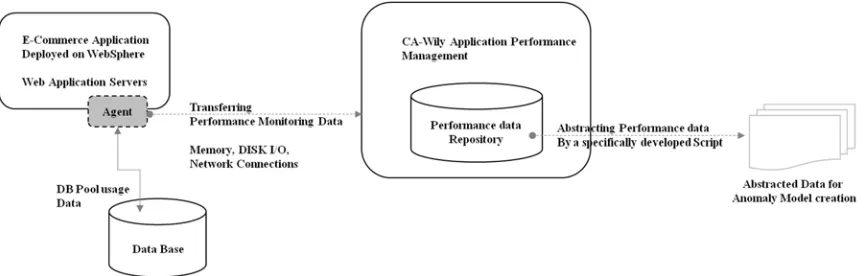
In the experiment, data collection practices are critical but challenging in many aspects. Data should be accumulated consistently, because inconsistent data collection intervals will generate unintended or unexpected results. We ensured data consistency, by utilizing a commercial Application Performance Management (APM) product called Wily and coded a specified script language. The e-Commerce service has been deployed on 10 WebSphere Application Servers (WAS) and the APM Agent stores their performance data according to pre-defined intervals. We collected data in three steps. First, we installed the APM agent in a Web Application Server to collect a variety of application performance metric data including the core performance metrics listed in Table 2. Second, we transferred these collected data to the APM database to conduct e-Commerce performance analysis. Finally, we abstracted our
[image:6.612.316.519.154.355.2]selected data using a script language and conducted our anomaly detection. Figure 8 depicts the three data collection steps as an architecture of streaming performance data.
Table 2: Performance Metrics Metric Description
CPU System CPU utilization Memory: JAVA
HEAP
e-Commerce, influenced by JAVA HEAP memory rather than system memory. DISK IO:
Input/Output ratio
Input ratio and output ratio measure DISK IO Network
Connection: DB Pool
DB Pool reflects a network connection especially focused on transaction between application server and database system. Network
Connection: AppCnt
Application Connection is a key indicator of performance or e-commerce behavior changes.
[image:6.612.91.525.571.709.2]4.2 Empirical Challenges and Resolutions Although we have practical data, an imbalanced dataset caused by data scarcity is a serious disadvantage because anomaly detection with imbalanced data often makes inappropriate classifications [24, 25, 28]. We ameliorated the effects of this drawback, by oversampling anomalous data and undersampling normal data. Typical anomaly detection methods train on normal data to predict anomalies however, the generic anomaly detection algorithm was not applicable in the multi-class basis approach in this study, so we enlarged the training dataset to improve the training capability of these few of anomaly classes, the process of which is called oversampling.
7382 The small number of anomaly classes are made equal in size to the normal class by duplicating data within the same class rather than generating minority data through artificial techniques such as Synthetic Minority Over-sampling Technique (SMOTE) [29]. The prepared dataset is consolidated in Table3. The original and oversampled datasets are listed under Train 1 and Train 2.
Table 3: E-Commerce Service Class And Size Label Train1 Train2 Valid
1 61 410 18
2 76 410 29
3 410 410 90
TOTAL 547 1230 137
The performance measurement unit varies for each metric. For instance, maximum CPU usage is 100%, whereas JAVA Heap Memory measurement has a range of 1.2E+09 and 2.9E+09. We precisely applied individual metric effects, and normalized and re-scaled data to between 0 and 1 by computing V’=(V-Vx) / (Vmax- Vmin).
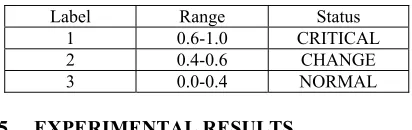
[image:7.612.91.297.584.649.2]We are willing to predict anomalies and classify their probabilities based on the pre-defined range in Table 4. The status of e-Commerce is decided by the independent variable AppCnt. Initially, we asserted that AppCnt reflects performance changes. The influence is quantitatively calculated to suggest decision ranges that determine status and label. For instance, Range 0.4-0.6 defines Label 2 status, whereas e-Commerce performance behavior begins to change. Meanwhile, CRITICAL status indicates significant changes that are probably anomalous and CHANGE status indicates the signature of an application behavior that is beginning to change. However observed data in this range are usually, not triggered with an anomaly, but rather require attention. NORMAL status is an ideal that e-Commerce services pursue.
Table 4: Label, Range And Status Label Range Status
1 0.6-1.0 CRITICAL 2 0.4-0.6 CHANGE
3 0.0-0.4 NORMAL
5. EXPERIMENTAL RESULTS
We designed eight partitioning and fusing 66 kernel parameter matrices to determine optimum parameters. Prior studies searched for best accuracy;
however, it has measurement limitations when the dataset is multi-class and when they are sensitive to data imbalance problems. Accuracy is intuitive, but much less sensitive to the minority class detection rate, instead they only calculate the total prediction rate. This motivated us to conduct low-level identification that enables us to expose meaningful hidden information.
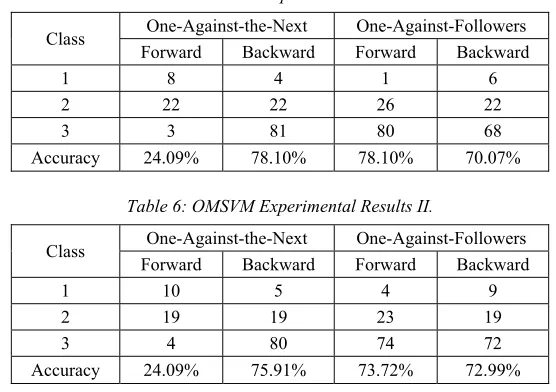
The best performance rate of 78.10% was selected among 66 OMSVM experimental results based on accuracy. The results and number of discrete classes are presented in Table 5.
One-against-the-next with the backward method and one-against-the-follower with the forward method result in equal accuracy, but it is obvious that the former classifier performs the best. We can select it because low- level identification revealed hidden information that actually classified numbers 4, 22, and 81, mapped with classes 1, 2, and 3.
A simultaneous process is effective commencement for low-level identification by finding a case of maximized true positive, minimized detection error, and reasonable accuracy rate. The findings are in Table 6, which shows lower accuracy than Table 5 but higher sensitivity for minority classes.
The cost of a false negative, which determines true class 1 as false class 2 or 3 is more severe than the cost of a false positive, determining false class 2 or 3 as 1 [30],[31]. In this norm, a higher minority detection rate is a suitable evaluation criterion. Comparing Tables 5 and 6, one-against-followers with the backward method’s accuracy of 72.99% has the best performance
For accuracy, 78.10% and 70.07% in Table 5, are reasonable but the detection ability is significantly lower for minority classes. Consequently, the best performance does not solely depend on accuracy itself in the case of multi-class basis classification.
7383
Table 5: OMSVM Experimental Results I.
Class One-Against-the-Next One-Against-Followers Forward Backward Forward Backward
1 8 4 1 6
2 22 22 26 22
3 3 81 80 68
Accuracy 24.09% 78.10% 78.10% 70.07%
Table 6: OMSVM Experimental Results II.
Class One-Against-the-Next One-Against-Followers Forward Backward Forward Backward
1 10 5 4 9
2 19 19 23 19
3 4 80 74 72
Accuracy 24.09% 75.91% 73.72% 72.99%
[image:8.612.94.295.450.526.2]Commonly accepted evaluation methods are accuracy, precision, recall, and F-score if the problem is binary. However, we recognize that these approaches are somewhat vague for realizing the proposed model’s value. Thus, it would be worthwhile to compare OMSVM performance with its interchangeable models such as Case Base Reasoning (CBR) and Multiple Discriminant Analysis (MDA). The comparison results are in Table 7.
Table 7: Model Comparison
Class OMSVM CBR MDA
1 9 8 4
2 19 16 22
3 72 82 78
Accuracy 72.99% 77.40% 75.9%
For OMSVM, prior to partitioning and fusing, the optimum parameters are selected from the results of several binary classifications, which are configured with the Radial Basis Function (RBF) kernel, cost
C=10 and σ2=0.04. CBR results are generated by
K-Nearest Neighbors method, configured with Kmin=1
and Kmax=10. And MDA presents stepwise
classification results. According to the numbers, we cannot insist that OMSVM is the most eligible model with which to fulfill the research purpose, though it seems an adequate model for minority classification in classes 1 and 2. Instead, we can assert that the proposed model is a novel approach because 1) classified anomalous to a certain degree, and 2) empirical measurement rather than accuracy dependency is suggested to determine competitive performance.
Parameter-free classification [32] that consider rules for each class is an essential and considerable algorithm. It may resolve the constraints that come from data imbalance and multi-class classification. By reproducing the philosophy, we attempted to treat three classes individually and abstract improved rules so that classes 1,2, and 3 resulted in 10, 29, 87, respectively. Since the approach is not a proven method, we carefully mention it as an alternate approach.
6. CONCLUSIONS
OMSVM has excellent records in certain domains such as credit rating [14] and bond rating [26] where ordinal and multi-classification matters are important.
We employed OMSVM to measure practical e-Commerce service status by classifying anomalies and extending its research domain. During the experiments, we noticed that imbalanced data significantly reduced SVM performance [12, 18] and testified to this phenomenon. The data imbalance impact is largely spread in e-Commerce anomaly detection domain because of smaller outliers than in typical anomaly detection such as network intrusion detection [33] whose anomaly data is larger and sufficient for training.
7384 classification. Nevertheless, we believe that continuous research into this novel approach is worthwhile because Cloud and Digital Transformation require sophisticated detection such as multi-level bottleneck detection, and multi-class approaches can enable it.
We testified not only model performance but also feasibility by identifying the low-level classes behind accuracy. Despite of meaningful experimental and result, they are not fully satisfied the research object rather they remain a limitation that we need plenty of verification practice with abundant data to ensure the proposed model credibility.
Plenty of verification will be available once we obtain sufficient data; however, anomalous e-Commerce data is very rare in the real world due to the high expectations of service reliability. We dealt with this data scarcity issue, by considering two options: devoting sufficient time to data collection or sharing data between researchers and industry practitioners, which brings mutual benefits but strict industry and government regulations impede it.
In further study, we will manipulate classifiers sophisticatedly. Once it is effective, we will be able to predict multi-levels of anomalies before they can pollute your enterprise’s reputation.
REFRENCES:
[1] Tan CW, Benbasat I, and Cenfetelli RT, “An Exploratory Study of The Formation and Impact of Electronic Service Failures”, MIS Quarterly. Vol. 40(1), No. 1, 2016, pp. 1-29.
[2] Ibidunmoye O, Hernández-Rodríguez F, and Elmroth E, “Performance Anomaly Detection and Bottleneck Identification”, ACM Computing
Surveys, Vol. 48(1), No. 4, 2015. DOI:
10.1145/2791120.
[3] Chen MY, Accardi A, Kiciman E, Lloyd J, Patterson D, Fox A, and Brewer E, “Path-Based Failure and Evolution Management”,
Proceeding of 1st conference on Symposium on Networked Systems Design and Implementation
(NSDI), March 29-31, 2004, pp. 23-23.
[4] Chen MY, Kiciman E, Fratkin E, Fox E, and Brewer E, “Pinpont: Problem Determination in Large, Dynamic Internet Service”, Proceedings of International Conference on Dependable
Systems and Networks (DSN), June 23-26, 2002,
pp. 23-26.
[5] Abdulsahib AK, “Anomlay Detection in Text Data That Represented as A Graph Using
DBSCAN Algorithm”, Journal of Theoretical
and Applied Information Technology, Vol. 95,
No. 9, 2017, pp. 2096-2101.
[6] Patcha A and Park JM, “An Overview of Anomaly Detection Techniques: Existing Solutions and Latest Technological Trends”,
Computer Networks, Vol. 51(12), 2007, pp.
3448-3470.
[7] Das K. Detecting Patterns of Anomalies [doctoral thesis]. [Pittsburgh (PA)]: Carnegie Mellon University; 2009. 150p.
[8] Chandola V, Banerjee A and Kumar V, “Anomaly Detection: A survey”, ACM
Computing Surveys (CSUR), Vol. 41(3), No. 15,
2009.
[9] Gunther NJ. Analyzing Computer System Performance with Perl::PDQ. Springer-Verlag Berlin Heidelberg; 2015.
[10] Kim S. Detecting. Contextual Network Anomaly in the Radio Network Controller from Bayseian Data Analysis [master’s thesis]. Stockholm: KTH Royal Institute of Technology, 2015. 31p. [11] Cristianini N and Schölkopf B, “Support Vector
Machines and Kernel Methods: The New Generation of Learning Machines”, AI
Magazine, Vol. 23, No. 3, 2002.
[12] Vapnik VN. Statistical Learning Theory. Wiley; 1998.
[13] Shawe-Taylor J and Cristianini N. Kernel Methods for Pattern Analysis. Cambridge University Press; 2004.
[14] Kim KJ, and Ahn HC, “Corporate Credit Rating Model Using Multi-class Support Vector Machines with an Ordinal Pairwise Partitioning Approach”, Computers & Operations Research, Vol. 39(8), 2012, pp. 1800-1811.
[15] Vapnik V. The Nature of Statistical Learning Theory. Springer-Verlag New York; 2000. [16] Kim KJ, “Financial Time Series Forecasting
Using Support Vector Machines”,
Neurocomputing, Vol. 55(1-2), 2003, pp.
307-319.
[17] Ahn H, Kim KJ, and Han IG, “Purchase Prediction Model using the Support Vector Machine”, Journal of Intelligence and
Information Systems, Vol. 11(3), 2005, pp.
69-81.
[18] Boser BE, Guyon IM, and Vapnik VN, “A Training Algorithm for Optimal Margin Classifiers”, Proceedings of the fifth annual workshop on Computational Learning Theory
7385 [19] Lui YI, and Zheng YF, “One-Against-All
Multi-Class SVM Multi-Classification Using Reliability Measures”, Proceedings of 2005 IEEE International Joint Conference on Neural
Networks (IJCNN), July 31 – August 4, 2005,
pp8. 49-854.
[20] Hsu CW, and Lin CJ, “A Comparison of Methods for Multi-class Support Vector Machines”, IEEE Transactions on Neural
Networks, Vol. 13(2), 2002, pp. 415-425
[21] Milgram J, Cheriet M, and Sabourin R, “One Against One” or “One Against All”: Which One is Better for Handwriting Recognition with SVMs?”, Tenth International Workshop on
Frontiers in Handwriting Recognition(IWFHR),
October 23-26, 2006.
[22] Platt JC, Cristianini N, and Shawe-Taylor J, “Large Margin DAGs for Multiclass Classification”, Proceedings of the 12th International Conference on Neural Information
Processing Systems (NIPS), November
29-December 03, 1999, pp. 547-553.
[23] Martínez J, Lglesias C, Matías JM, Taboada J, and Araujo M, “Solving the Slate Tile Classification Problem Using a DAGSVM Multiclassification Algorithm Based on SVM Binary Classifiers with a One-versus-all
approach”, Applied Mathematics and
Computation, Vol. 230, 2014, pp. 464-472.
[24] Clifton L, Clifton DA, Zhang Y, Watkinson P, Tarassenko L, and Yin H, “Probabilistic Novelty Detection with Support Vector Machines”, IEEE
Transactions on Reliability, Vol. 63(2), 2014,
pp. 455-467.
[25] Akbani R, Kwek S, and Japkowicz N, “Applying Support Vector Machines to Imbalanced Datasets”, Proceedings of the 15th European
Conference on Machine Learning (ECML),
September 20-24, 2004. pp. 39-50.
[26] Kwon SK, Han IG, and Lee KC. “Ordinal, Pairwise Partitioning (OPP) Approach to Neural Networks Training in Bond rating”, Intelligent Systems in Accounting, Financial and
Management, Vol. 6, 1997, pp. 23-40.
[27] Cohen I, Goldzmidt M, Kelly T, Symons J, and Chase JS, “Correlating Instrumentation Data to System States: A Building Block for Automated Diagnosis and Control”, Proceedings of the 6th Conference on Symposium on Operating Systems
Design & Implementation (OSDI), December
06-08, 2004, pp. 16-16.
[27] Willnecker F, Dlugi M, Brunnert A, Spinner S, Kounev S, Gottesheim W, et al., “Comparing the Accuracy of Resource Demand Measurement and Estimation Techniques”, Computer Performance Engineering: 12th European
Workshop (EPEW), Spain, August 31-September
1, 2015, pp. 115-129.
[28] Han IG, Kwon YS, and Lee KC, “Development of Intelligent Corporate Credit Evaluation System: NICE-AI”, Korea Management Review, Vol. 24, No. 4, 1995, pp. 91-118.
[29] Wang X, Liu X, and Matwin S, “A Distributed Instance-weighted SVM Algorithm on Large-scale Imbalanced Datasets”, IEEE International
Conference on Big Data, October 27-30, 2014,
pp. 45-51.
[30] Joo DJ, Hong TH, and Han IG, “The Neural Network Models for IDS Based on the Asymmetric Costs of False Negative Errors and False Positive Errors”, Expert System with
Application. Vol. 25(1), 2003, pp. 69-75.
[31] Lee HU and Ahn H, “An Intelligent Intrusion Detection Model Based on Support Vector Machines and the Classification Threshold Optimization for Considering the Asymmetric Error Cost”, Journal of Intelligence and
Information Systems, Vol. 17(4), 2011, pp.
157-173.
[32] Cerf L, Gay D, Sealmaoui-Folcher N, Crémilleux B, and Boulicaut JF, “Parameter-free Classification in Multi-class Imbalanced Data Sets”, Data & Knowledge Engineering, Vol. 87,
2013, pp. 109-129. DOI:
10.1016/j.datak.2013.06.001.
[33] Wang G, Chen S, and Liu J, “Anomaly-based Intrusion Detection Using Multiclass-SVM with Parameters Optimized by PSO”, International
Journal of Security and its Application, Vol. 9,
No. 6, 2015, pp. 227-242.
[34] Fujimaki R, “Anomaly Detection Support Vector Machine and Its Application to Fault Diagnosis”,
Proceedings of the Eighth IEEE International
Conference on Data Mining (IDCM), December