IJPSR (2014), Vol. 5, Issue 7 (Research Article)
Received on 24 January, 2014; received in revised form, 03 March, 2014; accepted, 03 May, 2014; published 01 July, 2014 FORMULATION AND CHARACTERIZATION OF SOLID DISPERSIONS OF A POORLY SOLUBLE FENOFIBRATE
A. Prashanth Kumar
Prasad institute of Pharmaceutical Sciences, Jalgaon, Telangana, India
.
INTRODUCTION: Immediate release oral dosage forms are most widely used drug delivery systems available. These products are designed to disintegrate in the stomach followed by their dissolution in the fluids of the gastrointestinal tract. Dissolution of the drug substance under physio-logical conditions is essential for its systemic absorption.
QUICK RESPONSE CODE DOI:
10.13040/IJPSR.0975-8232.5(7).3004-17
Article can be accessed online on:
www.ijpsr.com
DOI link: http://dx.doi.org/10.13040/IJPSR.0975-8232.5(7).3004-17
For this reason dissolution testing is typically performed on solid dosage forms to measure the drug release form the drug product as a test for product quality assurance/product performance and to determine the compliance with dissolution requirements when stated in the individual monograph. In limited number of cases, an in vitro – in vivo correlation is established between the drug release and drug product absorption necessary for therapeutic effect. Disintegration test is also a standardized test and is primarily used as a quality assurance tool to confirm complete disintegration of solid oral dosage forms within the prescribed Keywords:
Fenofibrate, Bioavailability, Solid dispersion, Preformulation parameters,
Dissolution enhancement, carriers, solubility.
Correspondence to Author:
A. Prashanth Kumar
Department of Pharmaceutics, Prasad institute of Pharmaceutical Sciences, Jangaon, Telangana, India
Email: [email protected]
time when placed in a liquid medium under the experimental conditions 1, 2, 3.
Solid Dispersion: Dispersion of the drug as very fine particles will increase the surface area available for dissolution. According to the classical Noyes-Whitney equation this will increase the dissolution rate. Particle size reduction may go to the nano-scale. However, even this size reduction will not lead to concentrations above the maximum solubility of the drug in the intestinal fluids 4. Alternatively, solid dispersions can be used to increase the dissolution rate of poorly soluble drug and they have proven to increase the amount of dissolved drug at the absorption site sometimes to supersaturated concentrations and consequently improve the bioavailability 5. Solid dispersions are investigated in many studies because they are highly versatile in their application. They can form the basis of products applied for various routes of administration and for various dosage forms, including the most popular dosage form the tablet (table 1) 6-10.
Advantages of Solid Dispersions:
Solid dispersions of a drug in solid state are helpful in stabilizing unstable of drug. Many advantages of solid dispersions are
derived from their rapid dissolution rate. Solid dispersions are thermodynamically
more active form of a drug and directly influences diffusion and release rate.
The dose of drug that is given in solid dispersion form could be decreased; for
example, the dose of reserpine
spironolactone can be reduced to half by incorporating the drug in a solid dispersion form 11-15.
Solid dispersion of drug in carriers of low solubility offers the potential for sustained release of drug.
Cell toxicity of Acyclovir can be decreased by solid dispersion method.
The ulcerogenic activity of NSAIDS can be decreased by solid dispersion method. An increased diffusion of steroid from the
ointment was obtained, example
Prednisolone urea ointment base.
Solid dispersion can be used to solidify liquid drug for e.g. Clofibrate and benzyl benzoate.
Disadvantages of Solid Dispersions:
There are chances of changes during storage of amorphous or molecularly dispersed drug.
High humidity induced changes in solid dispersions were observed if chosen carriers are water soluble, hygroscopic and moisture sensitive that results in decreased dissolution rates from many dispersions including Diazepam-PEG 6000, Nifidepine and Indomethacin-PVP.
Tackiness and decommissions during
preparation and formulation.
The oral administration of solid dispersions without concomitant reduction in dose may result in higher incidence of adverse effect e.g. Ulceration with Indomethacin -PEG 6000 dispersion 16.
PREFORMULATION STUDIES:
1. Solubility: 2. Flow Properties:
Bulk density
Tapped density
% Compressibility
Hausner’s ratio
3. Particle size distribution 4. Hygroscopic studies
5. Fenofibrate Excipient Compatibility studies
Evaluation studies of tablets
1. Dissolution studies 21-27
dioxide, Magnesium stearate, Isopropyl alcohol are collected from Micro labs.
[image:3.612.73.537.109.648.2]Classification of Solid Dispersions:
TABLE 1: CLASSIFICATION OF SOLID DISPERSIONS: (18-20)
Type of solid dispersion Matrix Drug Remark
1 Eutectic C C The first type of solid dispersion prepared. 2 Amorphous precipitations
in crystalline matrix. C A Rarely encountered.
3
Solid solutions
Continuous solid solutions C M Miscible at all composition, never prepared. Discontinuous solid
solutions C M
Partially miscible, 2 drugs even though drug is molecularly dispersed.
Substitutional solid
solutions C M
Molecular diameter of drug (solute) differs less than15% from matrix (solvent diameter). In that case the drug and matrix are substitutional. Can
be continuous or discontinuous, when discontinuous; 2 phases though drug is
molecularly dispersed.
Interstitial solid solutions C M
Molecular diameter of drug (solute) less than 59% from matrix (solvent diameter). Usually limited miscibility, discontinuous. Example; drug in helical interstitial spaces of PEG. 4 Glass suspensions. A C
Particle size of disperse phase dependent on cooling/evaporation rate. Obtained after crystallization of drug in amorphous matrix.
5 Glass suspensions. A A
Particle size of disperse phase dependent on cooling/ evaporation rate, many solid dispersion
are of this type.
6 Glass solutions. A M
Requires miscibility/solid solubility, complex formation or upon fast cooling/evaporation
during preparation. Many recent examples especially with PVP.
Other related designs
7 Complex formation C/M M
Drug and matrix strongly interact and form complexes in aqueous environment. Ex;
cyclodextrin and solid surfactants.
8 Monotectics C C
Same as eutectics but eutectics melting convergent with pure material, for completely
non-interacting system.
9 Co-precipitates - - Prepared by addition of non-solvents to solution of drug and matrix.
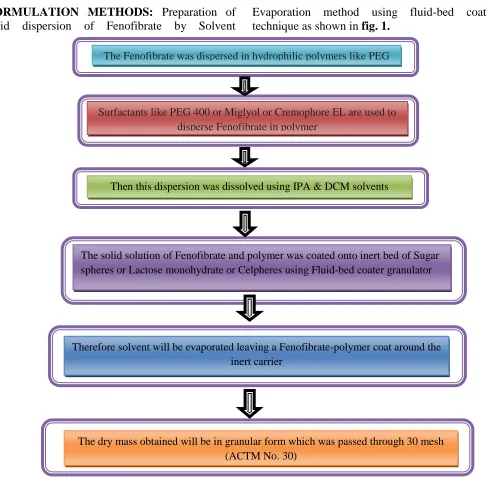
FORMULATION METHODS: Preparation of solid dispersion of Fenofibrate by Solvent
Evaporation method using fluid-bed coating technique as shown in fig. 1.
FIGURE 1: PREPARATION OF SOLID DISPERSION OF FENOFIBRATE BY SOLVENT EVAPORATION METHOD USING FLUID-BED COATING TECHNIQUE
FORMULATION DEVELOPMENT:
1. F1: Bottom spraying of Fenofibrate solution on sugar spheres lead to lump formation due to oily nature of surfactant Cremophore EL. Process was not satisfactory. Trial with different surfactant was planned.
2. F2: Top spraying of Fenofibrate solution on lactose monohydrate lead to bed dampening and fluidization problem because of oily nature of surfactant Miglyol. Process was not
satisfactory. Trial with different polymer and surfactant was planned.
3. F3: Bottom spraying of Fenofibrate solution on celpheres lead to lump formation. The process was not satisfactory. Granulation was planned by top spraying the Fenofibrate solution on lactose monohydrate.
4. F4: Granulation process was satisfactory. But heavy sticking occurred during compression The Fenofibrate was dispersed in hydrophilic polymers like PEG
6000
Surfactants like PEG 400 or Miglyol or Cremophore EL are used to disperse Fenofibrate in polymer
Then this dispersion was dissolved using IPA & DCM solvents
The solid solution of Fenofibrate and polymer was coated onto inert bed of Sugar spheres or Lactose monohydrate or Celpheres using Fluid-bed coater granulator
Therefore solvent will be evaporated leaving a Fenofibrate-polymer coat around the inert carrier
[image:4.612.62.549.49.534.2]because of presence of large quantity of PEG in the formulation.
5. F5: To address the sticking issue, diluent was incorporated in the extragranular part and tablet weight was increased along with increased quantity of lubricant. Slight sticking was observed during compression. Fenofibrate release was negligible with compared to innovator.
6. F6: To improve the Fenofibrate release, superdisintegrant was incorporated in the extragranular part and water insoluble diluents (MCC and PGS) being used to address the sticking issue. Dissolution was faster compared to the innovator.
7. F7: To get the desired dissolution profile, superdisintegration concentration was reduced in the extragranular part but not much difference in the Fenofibrate release was achieved.
8. F8: To achieve the desired release profile, polymer concentration was decreased. The Fenofibrate release was faster at initial stage compared to the innovator.
9. F9: The disintegrant concentration was decreased in the extragranular part to achieve the desired profile. Dissolution was comparable to that of innovator.
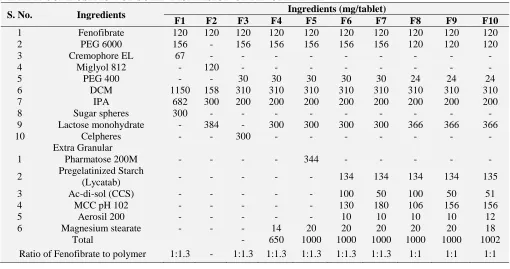
[image:5.612.51.561.294.563.2]10.F10: Reproducible batch was taken to confirm the reproducibility of batch F9 as shown in table 2 and proto-type formulation in table 3.
TABLE 2: COMPOSITION OF SOILD DISPERSION OF FENOFIBRATE
S. No. Ingredients Ingredients (mg/tablet)
F1 F2 F3 F4 F5 F6 F7 F8 F9 F10
1 Fenofibrate 120 120 120 120 120 120 120 120 120 120 2 PEG 6000 156 - 156 156 156 156 156 120 120 120
3 Cremophore EL 67 - - - -
4 Miglyol 812 - 120 - - - -
5 PEG 400 - - 30 30 30 30 30 24 24 24
6 DCM 1150 158 310 310 310 310 310 310 310 310
7 IPA 682 300 200 200 200 200 200 200 200 200
8 Sugar spheres 300 - - - -
9 Lactose monohydrate - 384 - 300 300 300 300 366 366 366
10 Celpheres - - 300 - - - -
Extra Granular
1 Pharmatose 200M - - - - 344 - - - - -
2 Pregelatinized Starch
(Lycatab) - - - 134 134 134 134 135
3 Ac-di-sol (CCS) - - - 100 50 100 50 51
4 MCC pH 102 - - - 130 180 106 156 156
5 Aerosil 200 - - - 10 10 10 10 12
6 Magnesium stearate - - - 14 20 20 20 20 20 18
Total - 650 1000 1000 1000 1000 1000 1002
Ratio of Fenofibrate to polymer 1:1.3 - 1:1.3 1:1.3 1:1.3 1:1.3 1:1.3 1:1 1:1 1:1
TABLE 3: PROTOTYPE FORMULATION (F10)
S. No. Name of the ingredients Category
1 Fenofibrate (Anti-Cholesteramine agent) Active excipient 2. Polyethylene glycol 6000 Polymer (hydrophilic carrier)
3 PEG 400 Wetting agent
4. Lactose monohydrate (Flowlac 100) Inert carrier 5. Microcrystalline cellulose (pH 102) Diluent
6. Pregelatinized Starch Diluent
7. Ac-di-sol (Crosscarmellose sodium) Disintegrant 8. Aerosil (colloidal silicon dioxide) Glidant
9. Magnesium stearate Lubricant
10. Isopropyl alcohol Solvent
RESULTS AND DISCUSSION:
Solubility Studies: Solubility studies were done in different buffers to select the dissolution medium
for the dissolution studies of the solid dispersions as shown in table 4.
TABLE 4: SOLUBILITY STUDIES
Solubility in different media (µg/ml)
Solvent Pure Fenofibrate Solid dispersion
Water 0.2568 2.621
0.1N HCL 0.3637 3.521
pH 4.5 Acetate buffer 0.2568 2.124
pH 6.8 Phosphate buffer 0.1284 0.834
pH 7.5 Phosphate buffer 0.1926 1.221
Flow characterization parameters: The flow indices show that Fenofibrate has very poor flow as shown in table 5.
TABLE 5: FLOW PROPERTIES OF FENOFIBRATE Bulk density (g/ml) 0.27
Tapped density (g/ml) 0.49 Compressibility Index (%) 1.82 Hausner’s Ratio 44.9
Particle size distribution: The particle size
distribution data of Fenofibrate was reported as less than 11.7 microns.
[image:6.612.69.526.410.517.2]Hygroscopic studies: The hygroscopic study of Fenofibrate was done under following temp. & humidity conditions as shown in table 6. The Hygroscopicity study of Fenofibrate Fenofibrate indicates that Fenofibrate is non-hygroscopic in nature as the % weight increase in the samples at the study is less than 0.2%.
TABLE 6: HYGROSCOPICITY DATA
Time Interval % Weight Change
33% RH 53% RH 75% RH
Day 1 0.00 0.0 0.0
Day 2 0.00 0.03 0.0
Day 4 0.00 0.03 0.01
Equilibrium RH
Day 0 0.415
Day 4 0.479 0.523 0.529
Remarks Non-hygroscopic
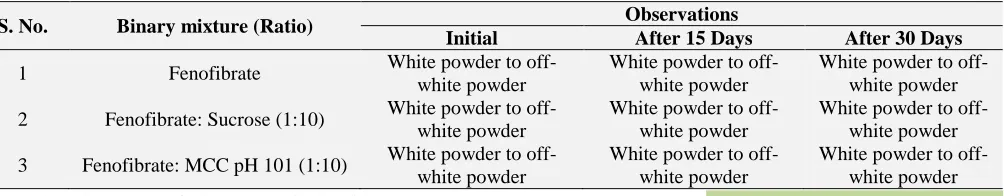
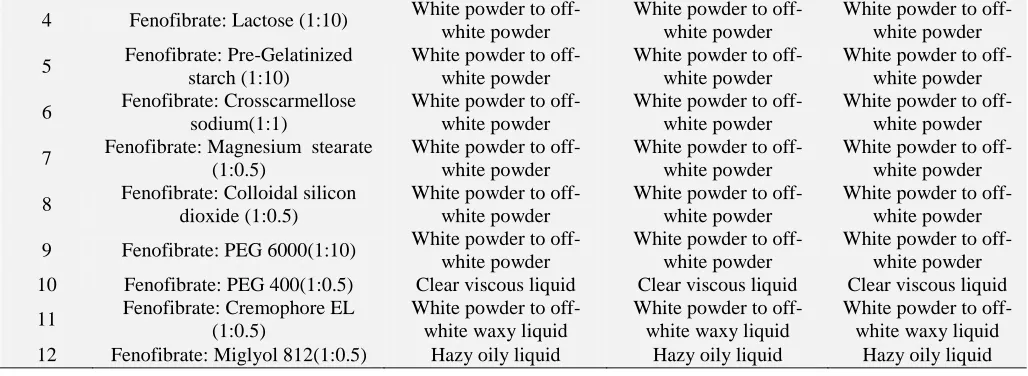
Fenofibrate - excipients compatibility studies: The results of Fenofibrate excipients compatibility studies suggest that there was no change in the physical appearance of mixtures when stored at 40°C ± 2°C / 75% ± 5% RH for 1 month.
Physical observations of Excipients Compatibility
[image:6.612.60.562.648.746.2]Study: The results of Fenofibrate excipients compatibility studies as shown in table 7 suggest that there was no change in the physical appearance of mixtures when stored at 40°C ± 2°C / 75% ± 5% RH for 1 month.
TABLE 7: API – EXCIPIENTS COMPATIBILITY STUDY PHYSICAL OBSERVATIONS (STORAGE CONDITION: 40°C/75%RH)
S. No. Binary mixture (Ratio) Observations
Initial After 15 Days After 30 Days
1 Fenofibrate White powder to off-white powder
White powder to off-white powder
White powder to off-white powder 2 Fenofibrate: Sucrose (1:10) White powder to
off-white powder
White powder to off-white powder
White powder to off-white powder 3 Fenofibrate: MCC pH 101 (1:10) White powder to
off-white powder
White powder to off-white powder
4 Fenofibrate: Lactose (1:10) White powder to off-white powder
White powder to off-white powder
White powder to off-white powder 5 Fenofibrate: Pre-Gelatinized
starch (1:10)
White powder to off-white powder
White powder to off-white powder
White powder to off-white powder 6 Fenofibrate: Crosscarmellose
sodium(1:1)
White powder to off-white powder
White powder to off-white powder
White powder to off-white powder 7 Fenofibrate: Magnesium stearate
(1:0.5)
White powder to off-white powder
White powder to off-white powder
White powder to off-white powder 8 Fenofibrate: Colloidal silicon
dioxide (1:0.5)
White powder to off-white powder
White powder to off-white powder
White powder to off-white powder 9 Fenofibrate: PEG 6000(1:10) White powder to
off-white powder
White powder to off-white powder
White powder to off-white powder 10 Fenofibrate: PEG 400(1:0.5) Clear viscous liquid Clear viscous liquid Clear viscous liquid 11 Fenofibrate: Cremophore EL
(1:0.5)
White powder to off-white waxy liquid
White powder to off-white waxy liquid
White powder to off-white waxy liquid 12 Fenofibrate: Miglyol 812(1:0.5) Hazy oily liquid Hazy oily liquid Hazy oily liquid
[image:7.612.48.562.56.244.2] [image:7.612.43.563.58.309.2]Evaluation of Tablets: (Table 8) TABLE 8: PHYSICAL EVALUATION
S. No. Physical parameter F 1 F 2 F 3 F 4 F 5 F 6 F 7 F8 F9 F10 1 Weight variation (%)
N/A N/A N/A N/A
0.23 0.27 0.19 0.22 0.21 0.15
2 Hardness
(Kp) 6.6-7.7 7.6-8.6 7.6-9.0 13.7-14.5 11.2-14.1 10.2-11.5 3 Thickness
(mm) 6.31-6.35 6.28-6.30 6.34-6.37 6.46-6.50 6.43-6.44 6.51-6.54
4 Friability (%) 0.045 0.042 0.042 0.042 0.033 0.04
5 Disintegration time 22-25 min 11-12
min 12-13 min 18-19 min
17-19 min
14-15 min N/A: Not applicable
Dissolution studies: The dissolution behaviour of pure Fenofibrate and solid dispersions with
hydrophilic carriers prepared in different ratios was observed under the following parameters (fig. 2, 3); Dissolution Parameters:
Medium : Water+0.75% Sodium lauryl sulfate
Apparatus : USP apparatus II (Paddles) RPM : 75 RPM
Quantity : 900 ml Temperature : 37 ± 0.5ºC
Time points : 15 min, 30 min, 45 min, 60 min. Dissolution profile for pure fenofibrate and reference product: (Table 9)
TABLE 9: IN-VITRO DISSOLUTION PROFILE FOR PURE FENOFIBRATE AND REFERENCE PRODUCT S. No. Time (min) Pure Fenofibrate (120 mg) Reference product
1 15 7 59
2 30 18 79
3 45 22 90
4 60 24 99
Cumulative % Fenofibrate release for formulated batches and reference product: (Table 10, 11, 12)
TABLE 10: IN-VITRO DISSOLUTION PROFILE FOR TRIAL BATCHES AND INNOVATOR
Time Innovator F1 F2 F3 F4 F5 F6 F7 F8 F9 F10
15 min 59
N/A N/A N/A N/A
1 68 65 69 57 58
30 min 79 2 88 85 83 80 81
45 min 90 4 98 95 91 89 93
60 min 99 6 100 98 99 98 100
FIG. 2: A) IN-VITRO DISSOLUTION PROFILE FOR PURE FENOFIBRATE &INNOVATOR B) IN-VITRO DISSOLUTION PROFILE FOR F5,F6&REFERANCE PRODUCT C) IN-VITRO DISSOLUTION PROFILE FOR F7, F8 & REFERANCE PRODUCT D) IN-VITRO DISSOLUTION PROFILE FOR F9, F10 & REFERANCE PRODUCT
TABLE 11: DISSOLUTION PROFILE OF REPRODUCIBILITY BATCH (F10) COMPARED TO PURE FENOFIBRATE AND REFERANCE PRODUCT
S. No. Time (min) Pure Fenofibrate (120 mg) Reference product F10
1 15 7 59 58
2 30 18 79 81
3 45 22 90 93
4 60 24 99 100
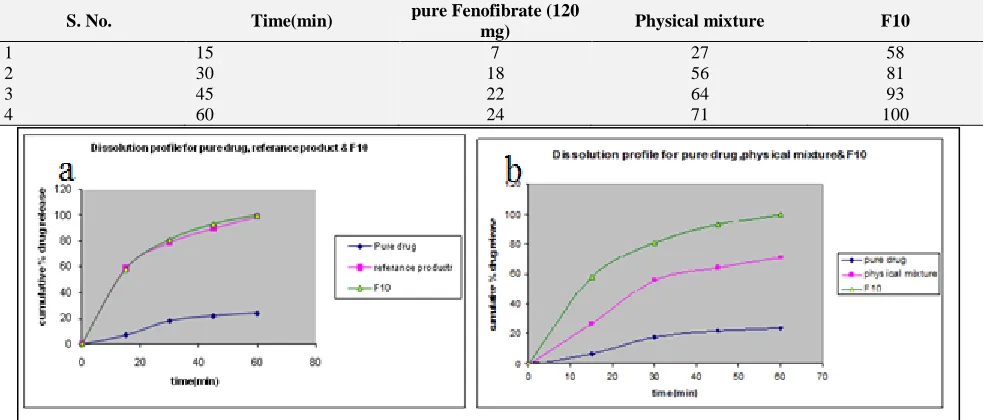
TABLE 12: DISSOLUTION PROFILE OF REPRODUCIBILITY BATCH (F10) COMPARED TO PURE FENOFIBRATE AND PHYSICAL MIXTURE
FIG. 3A): IN-VITRO DISSOLUTION PROFILE FOR PURE FENOFIBRATE, REFERANCE PRODUCT & F10; B): IN-VITRO DISSOLUTION PROFILE FOR PURE FENOFIBRATE, PHYSICAL MIXTURER & F10
S. No. Time(min) pure Fenofibrate (120
mg) Physical mixture F10
1 15 7 27 58
2 30 18 56 81
3 45 22 64 93
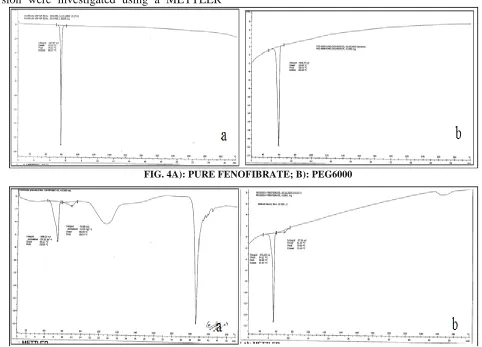
[image:8.612.86.561.56.319.2] [image:8.612.47.570.105.692.2] [image:8.612.62.554.485.695.2]Characterization of Solid dispersion: The solid-state properties of Fenofibrate in the solid dispersion were investigated using differential scanning calorimetry (DSC) since this would
influence the in vitro and in vivo dissolution
characteristics.
Differential Scanning Calorimetry: Thermal
properties of Fenofibrate, polymer and solid dispersion were investigated using a METTLER
differential scanning calorimeter thermal analysis controller with an intracooler-2 cooling. About 3 to 5 mg of product was placed in perforated aluminum sealed 50-μl pans, and the heat runs for each sample was set from 40°C to 250°C at 10°C/min, under an inert environment using nitrogen. The apparatus was calibrated using pure metals like indium with known melting points and heat of
fusion (ΔH fusion) (fig. 4, 5).
FIG. 4A): PURE FENOFIBRATE; B): PEG6000
FIG. 5A): SOLID DISPERSION GRANULES (PRODUCT);B):PHYSICAL MIXTURE OF FENOFIBRATE & PEG
6000
The DSC for Solid dispersion of Fenofibrate shown shift in the melting point towards lower side compared to pure Fenofibrate. This shows conversion of maximum amount of Fenofibrate into amorphous form. The extra peak is due to placebo
interference as shown in fig. 4 and 6.
Stability Studies: After 1month, 2month&3month
period of stability studies Fenofibrate content and % Fenofibrate release studies are done. According
to the data as shown in the table 13, Fenofibrate
content and % release are within the limit.
TABLE 13: STABILITY DATA FOR F10
S. No. % Fenofibrate release (60 min) %Assay Related substances (total impurity)
Initial 99 100.2 0.05
40/75, 1M 97 99.4 0.59
40/75, 2M 98 98.5 0.52
[image:9.612.76.558.184.531.2]As the Fenofibrate content, % Fenofibrate release studies and related impurities are within the limit so the formulation passes the stability test.
Optimization results of different formulations are tabulated in tables 14 - 22.
[image:10.612.75.559.133.307.2]Effect of diluent (pre-gelatinized starch) concentration on the optimized batch:
TABLE 14: OPTIMIZATION OF DILUENT CONCENTRATION
Formulation 13.4%Diluent 8%Diluent 18%diluent
INTRAGRANULAR (mg/tablet)
A.P.I 120 120 120
PEG6000 120 120 120
PEG400 24 24 24
DCM 310 310 310
IPA 200 200 200
Lactose monohydrate 366 366 366
EXTRAGRANULAR (mg/tablet)
Pre-gelatinized starch 135 80.60 181.34
Crosscarmellose sodium 51 51 51
MCC 156 156 156
Aerosil 12 12 12
Magnesium stearate 18 18 18
[image:10.612.58.563.352.423.2]Evaluation Parameters:
TABLE 15: EFFECT OF DILUENT ON TABLET CHARACTERISTICS Formulation
Code
Weight Variation
Hardness (Kg/cm2)
Thickness (mm)
Friability (%)
Disintegration Time (sec)
13.4% 0.15 10.2-11.5 6.51-6.54 0.04 14-15min
8% 0.14 9.8-10.8 6.32-6.38 0.032 12-13min
18% 0.15 10.8-12.1 6.53-6.56 0.042 16-18min
[image:10.612.56.559.461.734.2]Effect of diluent concentration on tablet dissolution profile:
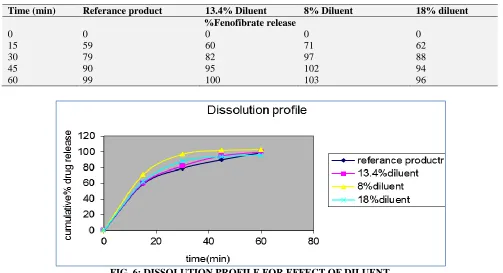
TABLE 16: IN VITRO DISSOLUTION PROFILE
FIG. 6: DISSOLUTION PROFILE FOR EFFECT OF DILUENT
Time (min) Referance product 13.4% Diluent 8% Diluent 18% diluent %Fenofibrate release
0 0 0 0 0
15 59 60 71 62
30 79 82 97 88
45 90 95 102 94
For diluent (pre-gelatinized starch), formulation were evaluated at different levels of 80.6mg and 181.34 mg, wherein significant differences were observed with respect to dissolution profile of the
formulations. Hence pregelatinized starch at a level of 135 mg was required to obtain comparable product with the innovator product shown in fig. 6.
[image:11.612.74.524.143.316.2]Effect of Disintegrant (Crosscarmellose sodium) concentration on the Optimized batch:
TABLE 17: OPTIMIZATION OF DISINTEGRANT CONCENTRATION
Formulation 5%Disintegranl 2.5%Disintegrant 7.5%disintegrant INTRAGRANULAR (mg/tablet)
A.P.I 120 120 120
PEG6000 120 120 120
PEG400 24 24 24
DCM 310 310 310
IPA 200 200 200
Lactose monohydrate 366 366 366
EXTRAGRANULAR (mg/tablet)
Pre-gelatinized starch 135 135 135
Crosscarmellose sodium 51 25.5 76.5
MCC 156 156 156
Aerosil 12 12 12
Magnesium stearate 18 18 18
[image:11.612.72.534.356.419.2]Evaluation Parameters:
TABLE 18: EFFECT OF DISINTEGRANT ON TABLET CHARACTERISTICS
Formulation Code Weight Variation
Hardness (Kg/cm2)
Thickness (mm)
Friability (%)
Disintegration Time (sec)
5% 0.15 10.2-11.5 6.51-6.54 0.04 14-15min
[image:11.612.62.557.456.728.2]2.5% 0.12 10.1-10.8 6.48-6.49 0.042 16-18min 7.5% 0.14 10.3-10.9 6.50-6.52 0.039 9-11min Effect of Disintegrant Concentration on Tablet Dissolution profile:
TABLE19: IN-VITRO DISSOLUTION PROFILE
Time (min) Reference product 5% Disintegrant 2.5% Disintegrant 7.5% Disintegrant %Fenofibrate release
0 0 0 0 0
15 59 60 51 81
30 79 82 70 96
45 90 95 88 100
60 99 100 98 100
Disintegrant levels of 25.5mg and 76.5 mg were studied wherein significant difference was observed with respect to dissolution when disintegrant concentration was changed from 25.5
mg to 75.5 mg. A disintegrant level of 51 mg was required to obtain comparable product with the reference product shown in fig. 7.
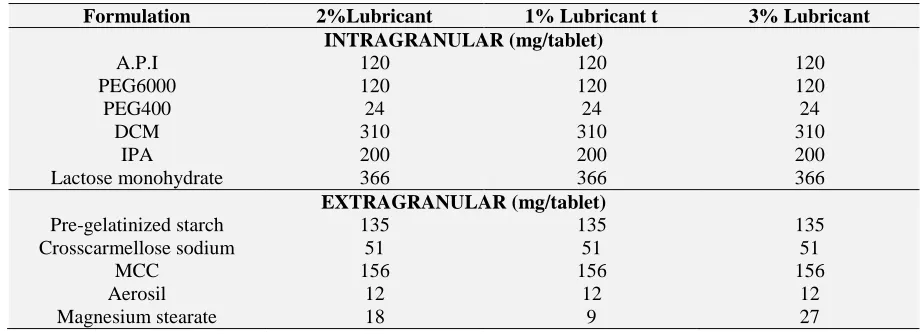
[image:12.612.74.534.145.312.2]Effect of Lubricant (Magnesium stearate) concentration on the Optimized batch:
TABLE 20: OPTIMIZATION OF LUBRICANT
Formulation 2%Lubricant 1% Lubricant t 3% Lubricant INTRAGRANULAR (mg/tablet)
A.P.I 120 120 120
PEG6000 120 120 120
PEG400 24 24 24
DCM 310 310 310
IPA 200 200 200
Lactose monohydrate 366 366 366
EXTRAGRANULAR (mg/tablet)
Pre-gelatinized starch 135 135 135
Crosscarmellose sodium 51 51 51
MCC 156 156 156
Aerosil 12 12 12
Magnesium stearate 18 9 27
Evaluation Parameters:
TABLE 21: EFFECT OF LUBRICANT ON TABLET CHARACTERISTICS
Formulation Code Weight Variation
Hardness (Kg/cm2)
Thickness (mm)
Friability (%)
Disintegratio n Time (sec)
5% 0.15 10.2-11.5 6.51-6.54 0.04 14-15min
2.5% 0.14 10-10.7 6.41-6.43 0.039 13-16min
7.5% 0.15 10.5-11.8 6.45-6.52 0.041 20-21min
Effect of Disintegrant concentration on Tablet Dissolution profile:
TABLE 22: IN VITRO DISSOLUTION PROFILE
Time (min) Reference product 2%Lubricant 1% Lubricant t 3% Lubricant %Fenofibrate release
0 0 0 0 0
15 59 60 66 59
30 79 82 80 75
45 90 95 96 90
[image:12.612.74.532.450.694.2]60 99 100 99 96
FIG. 8: DISSOLUTION PROFILE FOR EFFECT OF LUBRICANT
In case of lubricant, blend characteristics, physical attributes and dissolution profile of the formulation
respect to tablet characteristics and Fenofibrate release at lubricant concentration of 5 mg and a slower Fenofibrate release were observed at a concentration of 27 mg. The blend characteristics, physical attributes and dissolution profile of the formulation was acceptable at a lubricant concentration of 18 mg per tablet shown in fig. 8.
CONCLUSION: Immediate release oral dosage forms are most widely used Fenofibrate delivery systems available. These products are designed to disintegrate in the stomach followed by their dissolution in the fluids of the gastrointestinal tract. Dissolution of the Fenofibrate substance under physiological conditions is essential for its systemic absorption.
In this study, solid dispersion of poorly soluble Fenofibrate is prepared to enhance its solubility and Fenofibrate release profile.
Model Fenofibrate is of fibrate class used in the treatment of hypercholesterolemia and hyper-lipidemia. It reduces low-density lipoprotein (LDL) and very low density lipoprotein (VLDL) levels, as well as increasing high-density lipoprotein (HDL) levels and reducing triglycerides level.
The Preformulation studies of API were carried out and Fenofibrate-Excipients compatibility studies were performed by physical observation. The physical observations have showed API-Excipients does not show any color changes and they were similar to that of initial samples, it showed that no physical changes were observed and found to be compatible.
The solid dispersion of model Fenofibrate was prepared by solvent evaporation method using Fluid-bed coater granulator.
F1 to F10 batches were prepared using hydrophilic polymer PEG 6000, surfactants PEG 400, cremophore EL, miglol and solvents IPA, DCM, inert carriers like lactose monohydrate, sugar spheres, celpheres. The Extragranular excipients used are micro-crystalline cellulose, pharmatose 200M, pregelatnized starch, Crosscarmellose sodium, aerosil 200, magnesium stearate
In preparation of batches F1 to F4 fluid- bed coater granulator process was not smooth due to presence of large amount of surfactants. For batches F5 to F8 process was smooth but Fenofibrate release profile is not matching with innovator. Batch F9 has similar dissolution profile as that of innovator so a reproducibility batch of F10 is done.
The solubility studies of solid dispersion in different media are done; there is increase in solubility compared to API.
The tablet parameters like weight variation, hardness, thickness, friability, disintegration time are passing all the specifications for batches F5 to F10.
Stability samples of F10 batch were analyzed for %Fenofibrate release and Fenofibrate content, they are within the limits.
Effect of diluent, disintegrant and lubricant concentrations was studied and the optimum concentration was selected based on Fenofibrate release profile.
Characterization of solid dispersion is done for batch F10 by DSC.
From the results. it could be concluded that solid dispersions can be prepared using fluid-bed coater granulator.
ACKNOWLEDGEMENT: The author is grateful to our respected principal, Mr. Srikanth and all the lecturers of Prasad College of Pharmaceutical Sciences for providing necessary guidelines to do this work.
REFERENCES:
1 Seager H. Fenofibrate-delivery products and the Zydis fast-dissolving dosage form. J Pharm Pharmacol 1998; 50:375-82. 2 Herbert A. Lieberman, Leon Lachman and Joseph Schwartz,
Pharmaceutical Dosage Forms: Tablets, volume 3, 2nd edition, reprint in 2005.
3 Fenofibrate solubilizing strategies, applying nanoparriculate formulation and solid dispersion approaches in Fenofibrate developments, Carsten Timpe, Ph. D, Novartis Pharma AG Basel.
4 Solid dispersion: A Review, Dheerendra K., Lewis S., Udupa N., and Atin K., Manipal College of Pharmaceutical Sciences, Manipal, Karnataka, India .
6 Anil J Shinde Solubilization of Poorly Soluble Fenofibrates: A Review 2007; 5.
7 Goldberg A, Gibaldi M, Kanig J L, Increasing dissolution rates and gastrointestinal absorption of Fenofibrates via solid solutions and eutectic mixtures III - experimental evaluation of griseofulvin- succinic acid solid solution, J. Pharm. Sci.,1966; 55; 487-492.
8 Serajuddin A., solid dispersion technique, J.Pharm.Sci. 1999; 88(10); 891-900.
9 Wei W. et.al. Enhanced dissolution of silymarin/polyvinyl pyrrolidine solid dispersion prepared bya one step fluid bed coating technique. Powder technology.2008:182:72-80. 10 Wei W. et.al. Physical characterization of lansoprazole/PVP
solid dispersion prepared by fluid-bed technique 11 P.Srinarong.et.al. strong enhanced dissolution rate of
fenofibrate solid dispersion tablets by incorporation of superdisintegrants, European Journal of Pharmaceutics and Biopharmaceutics 2008.
12 Alazar N. Ghebremeskel et al. Use of Surfactants as Plasticizers in Preparing Solid Dispersions of Poorly Soluble API: Stability Testing of Selected Solid Dispersions, Pharmaceutical Research, Volume 23, Number 8 / August, 2006.
13 Van Den Mooter G et al. Formulation and characterization of ternary solid dispersions made up of Itrconazole and two excipients, TPGS 1000 and PVPVA 64, that were selected based on super saturation screening study, European Journal of Pharmaceutics and Biopharmaceutics 2008.
14 Vanden Mooter. G et al. Mechanism of increased dissolution of diazepam and temazepam from polyethylene glycol 6000 solid dispersions. Int J Pharmaceutics. 2002:249:45-58.
15 Anant Paradkar- et al Preparation and evaluation of glibenclamide- polyglyclazide glycerides solid dispersion with silicon dioxide by spray drying technique, European Journal of Pharmaceutics and Biopharmaceutics 2008.
16 Sang-Chul Shin, Physicochemical characterization of solid dispersion of furosemide with TPGS ,International Journal of Pharmaceutics January 2003; 251(1-2), 30: 79-84
17 Ilse Weuts, Salt formation in solid dispersions consisting of polyacrylic acid as a carrier and three basic model compounds resulting in very high glass transition temperatures and constant dissolution properties upon storage. European Journal of Pharmaceutical Sciences, July-August2005; 25(4-5): 387-393. 18 Shawn A. Mitchell, methylcellulose, International Journal of
Pharmaceutics January 2003; 250(1): 2: 3-11.
19 D.Q.M. Craig. The dissolution of nortriptyline HCl from polyethylene glycol solid dispersions, International Journal of Pharmaceutics January 1992; Volume 78, Issues 1-3, 1: 175-182.
20 Vanden Mooter G et al. Physicochemical characterization of solid dispersion of the anti-viralagent UC-781with PEG6000 and Gelurice 44/14. European Journal of Pharmaceutics and Biopharmaceutics 2008.
21 Siriporn Okonogi et al 14 European Journal of Pharmaceutics and Biopharmaceutics 2008.
22 Jennifer Dressmanet al. Improving Fenofibrate solubility for oral delivery using solid dispersions. European Journal of Pharmaceutics and Biopharmaceutics 2008.
23 Norbert Rasenack, Microcrystals for dissolution rate enhancement of poorly water-soluble Fenofibrates, International Journal of Pharmaceutics 26 March 2003; 254, (2): 137-145.
24 Bruno Sarmento et al. Solid dispersions as strategy to improve oral bioavailability of poor water soluble Fenofibrates. 25 Deepa. P, Solid dispersions of meloxicam: Factorially designed
dosage form for geriatric population. Acta Pharm. 2008:58:99-110.
26 Chaudari P.D. Current trends in solid dispersion techniques. Pharma info .net. 2006:4.
27 Zhiyong Qian et al. Biodegradable poly (-caprolactone)-poly (ethylene glycol) copolymers as Fenofibrate delivery system.
All © 2013 are reserved by International Journal of Pharmaceutical Sciences and Research. This Journal licensed under a Creative Commons Attribution-NonCommercial-ShareAlike 3.0 Unported License This article can be downloaded to ANDROID OS based mobile. Scan QR Code using Code/Bar Scanner from your mobile. (Scanners are available on Google Playstore)
How to cite this article: