An Automatic Detection Algorithm of River
Surface Velocity Estimation
Sheng-Fuu Lin
*, Yi-Chieh Sun
Department of Electrical Engineering, National Chiao Tung University, Taiwan
Copyright ©2016 by authors, all rights reserved. Authors agree that this article remains permanently open access under the terms of the Creative Commons Attribution License 4.0 International License.
Abstract
In the 21st century, we are deeply impactedby global warming and extremely climate change. Meanwhile, relative organizations around the world carry out disaster prevention research. Since along with the tendency to enhance disaster occurred, the number of relevant monitoring system is used along with the growth of the field of disaster prevention. However, there are several limitations in the system of conventional monitors. For example the traditional monitor system usually needs people to keep an eye on those disasters, which makes the changes of disasters cannot be passed instantly and correctly. This paper will propose a set of image algorithms for disaster analysis detection technology. Through the non-contact measurement mode, analyze information of rivers in Taiwan and extract crucial information of river surface velocity in hydrological disaster prevention. With driftwood in rivers, bubble waves, swirling waves and other changes of images, using Retinex theory and correlation with related technical principles of the application, it will overcome the interference effect of light and shadows in harsh environments. This mode can also correctly estimate instantaneous surface velocity of the river, and through experiment of several images information to verify the river surface velocity by the instrument in the same time, confirmed the development of this system has its value and reliability. It is expected to achieve effectiveness of real time information detection and automatic notification system of disaster prevention.
Keywords
Monitoring Systems, Image AnalysisTechniques, River Surface Velocity Estimation, Retinex Theory, Correlation
1. Introduction
In recent years, under the influence of global extreme climate change, extreme rainfall patterns and constantly changing disaster scale, making the area around Taiwan and urban district cannot achieve ideal drainage and dredging in
a short time, which causes floods. In order to prevent extreme rainfall and subsequent disaster caused by the expansion of the downstream area, monitoring changes of river velocity and river flow has become one of the major natural disaster prevention tasks.
In general, in hydrological observation technologies, river velocity and river flow are important hydrological information. River flow is mainly based on the hydrological analysis of water level, river velocity and river flow curves and calculations, but such method will cause large error to measured data when it is applied during the flood. The breaking surface is affected by the scouring and silting of river, which makes the measurements a difficult job. In the same manner, it is difficult to obtain an accurate average of velocity measurement. However, the monitoring instrumentation for the velocity of water level in the flow use contact tools most, including the traditional use of helical flow meter or buoy method, which assumed that the vertical velocity distribution of river velocity to meet certain laws, such as power-law, logarithmic law and other velocity formula [1-2].
In the non-contact measuring instrument, one of common image measurements of river surface velocity analysis is particle image velocimetry (PIV), which estimates velocity gradient distribution in the target area by the image analysis techniques, widely applied in research of flume velocity flow field of laboratory scale. But for the application of river basins in the field, it is still easy to be limited by natural factors such as the scale of the space sites, river reflection and weather, which makes the analysis and calculation of water surface velocity measurement not ideal at all [2-5].
Universal Journal of Electrical and Electronic Engineering 4(4): 104-112, 2016 105
2. Methods
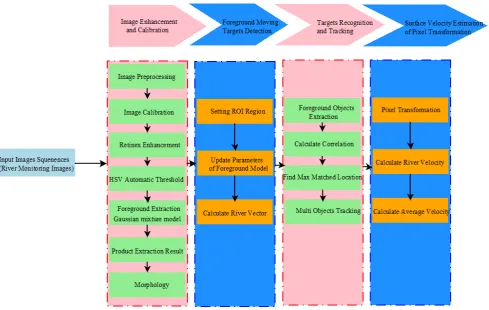
Automatic monitoring system mainly utilizes digital image analysis technology for disaster-related information measurement and interpretation. And during the information estimation of the river velocity, the primary problem faces the harsh and changeable outdoor environment, because image-related monitoring instruments are easy to be influenced by dramatic changes of ambient light. If only use traditional Gaussian mixture model background algorithm [6], we cannot effectively extract real-time information about changes of river velocity. In order to overcome the interference of above-mentioned environmental factors and estimate the river velocity accurately, this paper proposed and implemented a set of application of image analysis on river surface velocity detection system structure. The structure can be divided into four parts, including: image
enhancement and calibration, the foreground moving targets detection, targets recognition and tracking, and surface velocity estimation of pixel transformation. And the process of system architecture has shown in Figure 1 below.
2.1. Image Enhancement and Calibration
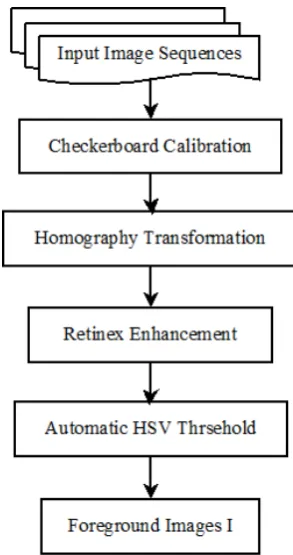
[image:2.595.50.540.295.605.2]Generally, when obtaining the related images of surveillance camera, the erection mode, imaging principles and shooting techniques will cause geometric distortion. Moreover, monitoring images are usually limited to the environment, climate change and light interference, so the use of several co-related calculus can carry out camera calibration and monitoring image enhancement, as Figure 2 shown.
Figure 2. The flow chart of image enhancement and calibration
First, images must be calibrated in order to obtain relevant 3D images information from 2D images, by shooting three-dimensional checkerboard, to obtain relevant intrinsic parameter and extrinsic parameter. The intrinsic parameters are the transformation between the image coordinate system and the camera coordinate system, while the external parameter represents the transformation between the camera coordinate system and the world coordinate system. Through the projection mapping relationship matrix, each corresponding point there will have two corresponding formulas, like the following formula (1) and (2)[7].
(
)
(
)
(
3131 3232 3333)
(
1121 1222 1323)
x XA YA A XA YA A
y XA YA A XA YA A
+ + = + +
+ + = + + (1)
11 12 13 21 22 23
31 32 33
1
xw
A
A
A
X
yw
A
A
A
Y
w
A
A
A
=
(2)A desire to convert the homography coefficient, the actual coordinates of a known point transformation required by at least four or more, such as formula shown in (3) [7].
11
1 1 1 1 1 1 1
12
1 1 1 1 1 1 1
2 2 2 2 2 2 2
2 2 2 2 2 2 2
3 3 3 3 3 3 3
3 3 3 3 3 3 3
4 4 4 4 4 4 4
4 4 4 4 4 4 4
1 0 0 0
0 0 0 1
1 0 0 0
0 0 0 1
1 0 0 0
0 0 0 1
1 0 0 0
0 0 0 1
A
X Y x X x Y x A
X Y y X y Y y
X Y x X x Y x
X Y y X y Y y
X Y x X x Y x
X Y y X y Y y
X Y x X x Y x
X Y y X y Y y
− − − − − − − − − − − − − − − − − − − − − − − − 13 21 22 23 31 32 33 0 A A A A A A A = (3)
[image:3.595.299.539.637.712.2]After completion of the camera geometric calibration, it requires follow-up image enhancement through Retinex theory. This color theory is proposed by Edwin Land in 1971, which proposed an image enhancement method from theory on the basis of color constancy. According to the Retinex theory, the brightness of the image is composed of two coefficients: the illumination and reflection. Thus, the human visual images will transfer with different light wavelengths and frequencies change, but the color of the object is determined by the frequency and intensity of reflection of light. As shown in Figure 3 [8]:
Figure 3. Retinex theory of the incident and reflected light
Universal Journal of Electrical and Electronic Engineering 4(4): 104-112, 2016 107
the actual source of the radiation energy, so the function must have a non-zero value, and limited. Function can represent two components: illumination and reflection, which represent the ambient illumination light on the object reaction, reflection brightness of the object itself, and are labeled ( , )L x y and ( , )R x y , while the product of two functions is expressed as ( , )F x y , as (4) shown in formula.
F x y
( , )
=
L x y R x y
( , ) ( , )
(4) To reduce the impact of changes in light and convenient matrix numerical calculation, it will be the formula (4) take the log can be calculated by the formula (5).log( ( , )) log( ( , )) log( ( , ))
F x y
=
L x y
+
R x y
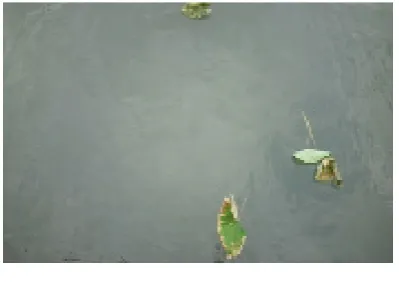
(5) However, the incident light may directly determine an image pixel dynamic range which can be achieved, while the reflective object determines the intrinsic features of the image. The purpose of using Retinex theory is to obtain the reflective properties of the target object from the image, which excludes shadows and light caused by waves, and has reached the goal of image enhancement. As shown in Figure 4.Figure 4 is image enhancement from the Retinex calculation, and then through the HSV color space automatic threshold, the results show that it can effectively suppress noises generated by light and shadow of waves in the original river image, also retaining characteristics of drifting objects. Meanwhile, this algorithm can quickly get foreground information image.
(a)
(b)
[image:4.595.318.519.92.404.2] [image:4.595.64.264.435.576.2](c)
Figure 4. Retinex image enhancement.(a) the input image; (b) Retinex calculation result; (c)binary target foreground image
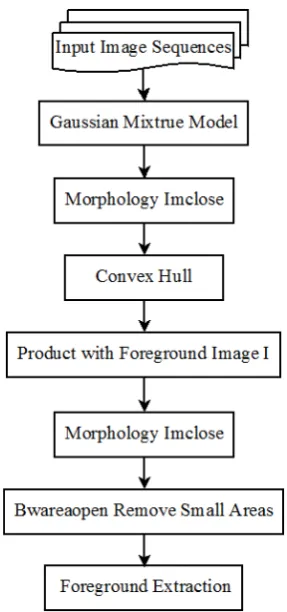
2.2. Foreground Moving Targets Detection
Figure 5. The flow chart of foreground moving targets detection
Gaussian mixture model (GMM), which is the main concepts of each image pixel statistics, establishes k Gaussian distributions for changes in pixel value of each point. According to establishment based on each point of the k pixel mixed Gaussian distribution, determine whether the pixel is a moving object and update background information. Since Gaussian mixture model has robustness for dynamic background and illumination changes, it is regarded as one of important ways to split the foreground and background. Gaussian mixture formula has defined the most important three main parameters, including mixture weights, mean vector and covariance matrix. Each pixel should be described by the following parameters. As shown in the formula (6) [6].
{
, ,
2}
, 1, 2, , .
i i i
w
i
M
λ
=
µ σ
=
(6)i
w
represents mixture weights, µi represents the meanvector, 2
i
σ
represents covariance matrix, and M is the number of Gaussian distribution. If the image data,{
1, , ,2}
N n
X = X X X , is distributed into N-dimensional space, the similarity of GMM represents as the following formula (7) and (8):
2 1
(
N| )
M i(
N, , )
i i iP X
λ
w X
η
µ σ
=
=
∑
(7)( , , )2 1 exp 1( ) 1( )
2 2
T
N i i N i i N i
i
X X X
η µ σ µ µ
pσ
−
= − − −
∑
(8)2
(XN, , )i i
η
µ σ
is the i, the Gaussian distribution of probability density function, and the mixture weights must be met1
1
M
i i= W
=
∑
. Classify each data point of the dimension into K groups through the use of K-means classification. After several iterations of convergence, the parameters grouping, the center value and variance are the initial numbers of Gaussian mixture model. After calculation above, if pixel meets the condition, it is the background pixels. Otherwise it belongs to foreground pixels.2.3. Target Recognition and Tracking
Universal Journal of Electrical and Electronic Engineering 4(4): 104-112, 2016 109
be expressed as the formula (9) and (10) [2-4].
1 1
1 1 1 1
( , ) (
,
)
( , )
( , )
( , )
M N
x y
fg M N M N
x y x y
f x y g x m y n
m n
f x y
g x y
ϕ
= == = = =
+
+
=
∑∑
∑∑
∑∑
(9)( , )
f x y and ( , )g x y are gray values of image. In the limited space (9) of the denominator regarded as constant, it can be redefined.
1 1
( , )
M N( , ) (
,
)
fg
x y
m n
f x y g x m y n
f
= =
=
∑∑
+
+
(10) [image:6.595.318.515.77.212.2]Wherein M and N are the original image size, and m and n are the amount of the displacement. Therefore, the calculation procedure is shown in Figure 6. Through two continuous images in continuous image sequence, the cross-correlation analysis function is calculated in entire image and gets the peak value of the maximum amount of displacement. Then the displacement direction and position of the drifting object on the river and the corrugated information can be obtained.
Figure 6. Calculate a schematic cross-correlation image
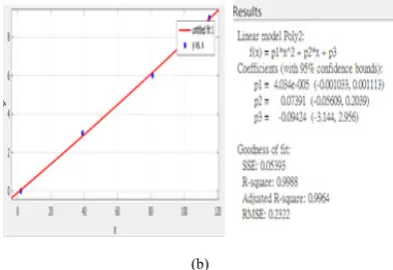
2.4. Surface Velocity Estimation of Pixel Transformation If the river velocity is estimated directly, it would be error and cannot accurately estimate the river velocity. Hence, with the placement on the image screen or the relevant feature points, and though several obvious feature points which are corresponding to different distances, the relevant information of the 3D real world coordinate would be obtained from 2D image. And Figure 7 will show the image scale reference feature points in tributaries of Wu River and linear quadratic fitting polynomial of pixel transformation real distance.
(a)
(b)
Figure 7. Tributaries of Taichung Wu River experiment. (a) image scale reference feature points; (b) linear quadratic fitting polynomial result
After obtaining the relevant function between the image coordinate and the real distance, and through the estimation of relevant river velocity which is extended from the concept of speed = distance / time, the velocity value
V
i can becalculated from position x and y which are obtained from the correlation of two frames in continuous image sequence.
x
iand
y
i represents the difference of the x-coordinate and y-coordinates. Through square root calculation after sum of square ofx
i andy
i. Then the result will be multiplied byrate
F
(Frame rate) and divided byd
i which is the totalnumber of all frames that objects move in continuous image sequence, like the formula (11) [9]. At the same time, we take every ten continuous data to calculate the mean value,
V
[9].2 2 2 2
1
1
;
i i n
i i rate
i i
i
i rate i
x
y
x
y F
V
V
V
d F
d
n
=+
+
=
=
=
∑
(11)3. Results and Discussions
There are three main experimental results in this paper. First, the proposed algorithm compared with the traditional algorithms, the difference of the tracking result and the suppressive effect to light in outdoor would be discussed. Second, through the estimations of the actual river velocity in outdoor river environment, it is considered as the validation of the river velocity identification system. Meanwhile we use the velocimeter instrument to verify the robustness and the functionality of this system. There are four kinds of outdoor experimental river environment, including Wufeng ditch, tributaries of Taichung Wu River, Hsinchu Youluo River and Southern Region Water Resources Office Tai Po observation station of Taiwan [10]. Third, we use the formula to verify the experimental percent error of the river velocity by image estimation and discuss the experimental results.
3.1. The Proposed Algorithm Compared with Traditional Algorithms
[image:6.595.47.277.364.449.2]method of image tracking adopts the median algorithm or other methods to establish the background model. The main concept of the median algorithm is that after getting a section of continuous images, the median pixel value will be regarded as the background. However, the disadvantages of this background are easily influenced by light, shadows change and wave interference, as shown in Figure 8 and Figure 9. It is clear that this method is not useful to suppress the noise interference and make error for detecting the objects. As a result the proposed algorithm is more robust and reliable than other traditional algorithms in the outdoor environment and in field of hydrologic information detection.
(a)
(b)
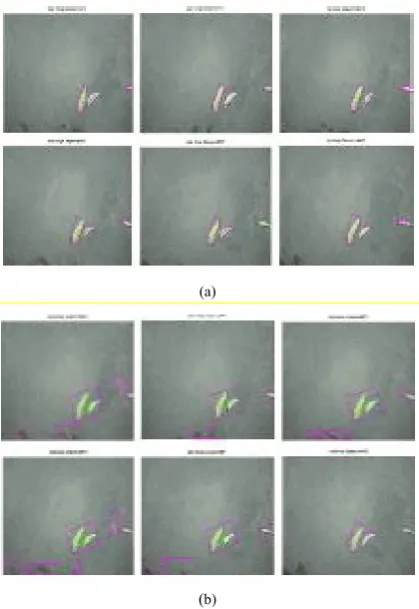
Figure 8. Comparison RGB tracking results. (a) the proposed algorithm
tracking results; (b) the traditional algorithm tracking results
(a)
[image:7.595.59.269.231.536.2] [image:7.595.61.271.572.697.2](b)
Figure 9. Comparison binary foreground results. (a) the proposed algorithm foreground extraction results;(b) the traditional algorithm foreground extraction results
3.2. Experiment Results
In order to verify the accuracy of image river surface velocity estimation, we use SVR400 instrument to measure actual river surface velocity. SVR400 velocimeter permit the estimation of its velocity range between0-321km/h, and the accuracy of velocity is±0.1km/h. By using a handheld radio wave and Doppler principle, it can achieve the motion radial velocity measurement of the river surface. After verifying experimental data and results in four different cases inclusive of Wufeng ditch, tributaries of Taichung Wu River, Hsinchu Youluo River and Southern Region Water Resources Office Tai Po observation station [10], it prove that image analysis on river surface velocity estimation is provided with accuracy and promotability. However, limitations on space only show experimental results of Taichung Wu River and Tai Po Observation Station.
Universal Journal of Electrical and Electronic Engineering 4(4): 104-112, 2016 111
[image:8.595.70.518.77.176.2](a) (b)
[image:8.595.64.520.211.450.2]Figure 10. Tributaries of Taichung Wu River experiment results. (a) RGB tracking results of Wu River; (b) binary extraction results of Wu River
Table 1. Image river surface velocity of tributaries of Wu River
Period and time Image river surface velocity (m/s) Period and time Image river surface velocity (m/s) 2015/10/11 13:28:17 0.475 2015/10/11 13:28:37 0.451
2015/10/11 13:28:19 0.427 2015/10/11 13:28:39 0.447 2015/10/11 13:28:21 0.465 2015/10/11 13:28:41 0.434 2015/10/11 13:28:23 0.499 2015/10/11 13:28:43 0.426 2015/10/11 13:28:25 0.492 2015/10/11 13:28:45 0.427 2015/10/11 13:28:27 0.491 2015/10/11 13:28:47 0.422 2015/10/11 13:28:29 0.485 2015/10/11 13:28:49 0.417 2015/10/11 13:28:31 0.479 2015/10/11 13:28:51 0.406 2015/10/11 13:28:33 0.469 2015/10/11 13:28:53 0.370 2015/10/11 13:28:35 0.424 2015/10/11 13:28:55 0.370
[image:8.595.67.518.216.452.2](a) (b)
Figure 11. Tai Po Station hit by typhoon experiment results. (a) RGB tracking results of Tai Po Station; (b) binary extraction results of Tai Po Station
Table 2. Image river surface velocity of Tai Po Station hit by typhoon
Period and time Image river surface velocity (m/s) Period and time Image river surface velocity (m/s) 2015/8/8 17:08:35 1.288 2015/8/8 17:08:55 1.275
2015/8/8 17:08:37 1.288 2015/8/8 17:08:57 1.273 2015/8/8 17:08:39 1.288 2015/8/8 17:08:59 1.273 2015/8/8 17:08:41 1.277 2015/8/8 17:09:01 1.273 2015/8/8 17:08:43 1.277 2015/8/8 17:09:03 1.273 2015/8/8 17:08:45 1.266 2015/8/8 17:09:05 1.273 2015/8/8 17:08:47 1.266 2015/8/8 17:09:07 1.273 2015/8/8 17:08:49 1.266 2015/8/8 17:09:09 1.309 2015/8/8 17:08:51 1.266 2015/8/8 17:09:11 1.309 2015/8/8 17:08:53 1.278 2015/8/8 17:09:13 1.464
Tai Po Observation Station is located at Zengwen Dam and which is on the Zengwun River. It is the third tallest dam in Taiwan, and forms the largest reservoir in Taiwan by volume. About Tai Po Station hit by Sudi Le typhoon field experiment [10], which data sampling on August 7 to 10, 2015, the image resolution is 720 × 480 and the number of samples are 1143. For inclement weather conditions, although the historical monitoring data did not appear obviously large-scale drift wood or other objects, it extracted waves and torrent features to estimate river surface velocity. And shooting the photographs which may be impacted by
wind, rain and turbid stream causes unclear. In spite of only using historical video data, confirm river surface velocity via experiences judged by professionals of Southern Region Water Resources Office. And the professionals of Southern Region Water Resources Office preliminary view river surface velocity as 1.3 ~ 1.5m/s, describe in Figure 11 and shown Table 2.
3.3. Discussions
[image:8.595.74.504.487.612.2]external impact during the experiment, in order to figure out that the experimental percent error between the river surface velocities of instrument measuring and using image analysis on river surface velocities estimation, we analyze experimental percent error, estimator of experimental error and valid data processing. Through computing percent error, we can get references of valid data. So actual value and
theoretical value represents river surface velocity estimation by paper and river surface velocity measured by velocimeter respectively, such as the formula (12) [11].
| - |
100% | |
100% actual value theoretical value Percent error
theoretical value error
theoretical value
= ×
= × (12)
After experimental percent error calculation, we can get that the percent error of Taichung Wu River data is 15%, and the percent error of Tai Po Observation Stations hit by typhoon data is 10%. According to the experimental percent error results, we can know that this paper proposes a set of image processing techniques of automatic river surface velocity estimation, which can make non-contact river surface velocity estimation detection more accurate and effective.
4. Conclusions
In this paper, through experimental results, it is difficult to control the changes in the actual environment of the river and the uncontrollable factors, such as the water shimmering reflections, severe shadow changing and etc. Therefore, compared with the traditional algorithm, there are several breakthroughs and innovations in this paper. First, this paper establishes the background information by using the Gaussian mixture model. Through the Retinex and HSV automatic threshold algorithm, the noises which are the water shimmering reflections and shadow will be filtered. Hence, it is effective to reach the purpose which tracks and detects the moving object. Second, the accuracy which is the estimation of the image river velocity in this paper will be verified by the real measurements and their values of the several actual cases. And the accuracy can be up to 85 - 90%. Finally, this paper has completed the prototype of the image recognition system which is a non-contacting river velocity. In the future, it will be more immediate and reliable with the alarm announcement in the field of the flood and disaster prevention.
Acknowledgments
The work was supported by National Ministry of Science and Technology of Republic of China under contract MOST 104-2221-E-009-176; besides, be grateful that National Center for High-Performance Computing, National Applied Research Laboratories and Southern Region Water
Resources Office, Water Resources Agency, MOEA of Republic of China provide related experimental data and instruments.
REFERENCES
[1] J. Bartram and R. Balance, Water Quality Monitoring - A Practical Guide to the Design and Implementation of Freshwater Quality Studies and Monitoring Programmes, United Nations Environment Programme and the World Health Organization, 1996.
[2] M. C. Lee, “Development of Non-contact Methods for Water Surface Velocity and River Discharge Measurements,” Doctor’s thesis, Dep. Hydrological and Ocean Engineering, National Cheng Kung University, Tainan, Taiwan, 2003. [3] D. Jeanbourquin, D. Sage, L. Nguyen, B. Schaeli, S. Kayal, D.
A. Barry, and L. Rossi, “Flow measurements in sewers based on image analysis: automatic flow velocity algorithm,” Journal of Water Science & Technology, pp. 1108-1114, 2011.
[4] F. Lin, W. Y. Chang, L. C. Lee, H. T. Hsiao, W. F. Tsai, and J. S. Lai, “Applications of Image Recognition for Real-Time Water Level and Surface Velocity,” in Proc. of IEEE International Symposium on Multimedia, CA, USA, pp. 259-262, 2013.
[5] P. Wang, B. Li, G. Yu, and D. Sun, “Analysis and Processing of the River Model Test Velocity Data Based on Digital Particle Image Velocimetry,” in Proc. of 3rd International Congress on Image and Signal Processing, Yantai, China, vol. 4, no. 2, pp. 1808-1812, 2010.
[6] X. Zhao, P. Liu, J. Liu, and X. Tang, “Background subtraction using semantic-based hierarchical GMM,” International Journal of Electronics Letters, vol. 48, no. 14, pp 825-827, 2012.
[7] T. Okatani and K. Deguchi, “Auto calibration of a projector-screen-camera system: theory and algorithm for screen-to-camera homography estimation,” in Proc. of IEEE International Conf. on Computer Vision, Nice, France, vol. 1, no. 2, pp. 774-780, 2003.
[8] W. Wang, B. Li, J. Zheng, S. Xian, and J. Wang, “A fast Multi-Scale Retinex algorithm for color image enhancement, ” in Proc. of the International Conf. on Wavelet Analysis and Pattern Recognition, Hong Kong, China, vol. 1, no. 7, pp. 80-85, 2008.
[9] C. H. Lee, “Motion Surface Velocity Estimation for Debris Flow, ” Master’s thesis, Dep. Computer Sciences, National Tsing Hua University, Hsinchu, Taiwan, 2008.
[10]“2015 Extension, Operation and Maintenance of Hazard Mitigation and Emergency Response Grid and Flood Watching System,” National Center for High-Performance Computing, National applied research laboratories, Taiwan, Tech. Rep., 2015.