International Journal of Emerging Technology and Advanced Engineering
Website: www.ijetae.com (ISSN 2250-2459,ISO 9001:2008 Certified Journal, Volume 3, Issue 4, April 2013)
577
Performance of Swarm Based Intrusion Detection System
Under Different Mobility Conditions in MANET
G.Indirani
1, K.Selvakumar
2 1Assistant Professor, Department of CSE., Annamalai University, Annamalai nagar- 608002
2Associate Professor, Department of CSE., Department of CSE., Annamalai University, Annamalai nagar- 608002, Abstract— In mobile ad hoc network (MANET), the
process of intrusion detection is difficult due to the features of the MANET such as dynamic topology, limited transmission range, mobility, etc. The movement of nodes plays the major role. In this paper, three (Swarm based Intrusion detection)SBDTs are created namely LOW-MOBILITY, MEDIUM-mobility and SBDT-HIGH-MOBILITY. In all the three SBDTs, the nodes with highest trust value, residual bandwidth and residual energy are selected as active nodes using the swarm agents. Every active node examines its neighbor nodes within its radio transmission range and gathers the trust value from all monitored nodes. The active nodes will always be changing as per the trust thresholds. Upon collaborative exchange of the trust values of the monitored nodes among the active nodes, if the active node finds any node below a minimum trust threshold, then the node is marked as malicious. When the source receives alert message about the malicious node, a defense technique is deployed to filter the corresponding malicious node from the network. By simulation results we show that the SBDT-HIGH-MOBILITY is producing better results while varying the nodes and SBDT-LOW-MOBILITY is producing better results while varying the attackers. From this it is found that the mobility condition also plays a major role during the swarm based intrusion detection.
Keywords — MANET, SBDT, LOW MOBILITY, HIGH MOBILITY, MEDIUM MOBILITY
I. INTRODUCTION
A.Mobile ad-Hoc networks (MANETs)
A Mobile ad hoc network is a group of wireless mobile nodes that can allow the devices and the people to communicate with each other without the centralized monitoring and control. A MANET is a temporarily formed self configured network having the dynamic topology. Here each mobile node acts as a router or host. Here the routing protocols play a major role to find the routes required for communication between the source and destination through the intermediate nodes.
The MANET can be used in many applications such as rescue operations, tactical operations, environmental monitoring, conferences, connecting soldiers in battlefields and social or business application such as Public and Personal Area Networks.[1] The weaknesses of ad hoc networks are dynamic topology, lack of infrastructure, exposure of nodes and channels [2].
B. General attacks in MANET
The wired networks are less affected by the security attacks than the MANET[3]. In MANET, the nodes have restricted protection, dynamic behaviour of connectivity, no centralized administration. So the security maintenance is difficult. The attacks in MANET can enter either from inside the network or from outside. Detection of attacks from inside the network are difficult and also destructive. The MANET attacks are classified as active and passive attacks which are described below.
The wired networks are less affected by the security attacks than the MANET[3]. In MANET, the nodes have restricted protection, dynamic behaviour of connectivity, no centralized administration. So the security maintenance is difficult. The attacks in MANET can enter either from inside the network or from outside. Detection of attacks from inside the network are difficult and also destructive. The MANET attacks are classified as active and passive attacks which are described below.
1) Active attacks:
An active attack causes various levels of damage to the network depending on the type of attack. It is further classified into two categories of attacks such as internal and external attack.
The internal attacks are performed by the valid nodes that belong to the network.
The external attacks are performed by the nodes that are not part of the network.
International Journal of Emerging Technology and Advanced Engineering
Website: www.ijetae.com (ISSN 2250-2459,ISO 9001:2008 Certified Journal, Volume 3, Issue 4, April 2013)
578
2) Passive attacks
In this attack, the attacker does not interrupt the normal operation of the network but indirectly obtains the data exchanged in the network without changing it. This type of attack is difficult to identify as the normal operation of the network is not affected [3] [4]. Snooping is a type of passive attack which uses another person’s data illegally. That is watching e-mail informally that is displayed on another’s computer screen or observing other people typing or employing a software program to examine the process of a computer or network device. [4]
C. Swarm based Intrusion detection
Here, the active nodes are selected by using the swarm intelligence based ant colony optimization. The active nodes are selected based on the parameters namely the node with highest trust value, residual bandwidth and residual energy. This is done to perform the process of intrusion detection. Every active node examines its neighbor nodes within its transmission range and collects the trust values from all those nodes. Every active node changes adaptively as per the trust thresholds. Then the collaborate exchange of the trust values will occur among the active nodes. After the exchange process, if any particular node’s trust value is found to be below minimum threshold, then that node is identified as malicious. Upon detecting malicious node, the active node sends an alert message to the source node. The source then deploys a defense mechanism to filter the malicious nodes from the networks [2].
E. Mobility conditions
Here in this work,the Random waypoint mobility model[6] with three different mobility conditions are used. They are low mobility, medium mobility and high mobility. In low mobility the pause time used is 400 sec. In medium mobility, the pause time used is 300 sec. In high mobility, the pause time used is 120 sec. Pause time is nothing but the rest period required for a node to move from one location to another. In high mobility, the nodes will start moving from a location quickly. In low mobility, the nodes will start moving from a location slowly and in medium mobility the nodes will start moving from a location in between the low mobility and high mobility.
F. Problem identification
Swarm based Intrusion detection technique (SBIDT) performs well when compared with DTMF [1].
Now in this work the performance of swarm based Intrusion detection system is examined under 3 different mobility conditions for the various routing attacks.
II. LITERATURE REVIEW
Indirani G and K. Selvakumar [1] have discussed the technique in which, the swarm agents are utilized to select the nodes with highest trust value, residual bandwidth and residual energy as active nodes. Each active node monitors its neighbor nodes within its transmission range and collects the trust value from all monitored nodes. The active nodes adaptively changes as per the trust thresholds. Upon collaborative exchange of the trust values of the monitored nodes among the active nodes, if the active node finds any node below a minimum trust threshold, then the node is marked as malicious. When the source receives alert message about the malicious node, a defense technique is deployed to filter the corresponding malicious node from the network. Indirani G and K. Selvakumar [2] have proposed a swarm based detection and defense technique for malicious attacks in mobile ad hoc networks (MANET). In this technique, the nodes with highest trust value, residual bandwidth and residual energy are selected as active nodes using swarm intelligence based ant colony optimization. Each active node monitors its neighbor nodes and estimates the trust value. If the active node finds any node below a minimum trust threshold, then the node is marked as malicious and an alert message is sent to the source node. When the source node wants to forward the data packet to destination, it discards the malicious nodes in that path and bypasses the data through other nodes in alternate path. It also performs the certificate revocation process for the malicious nodes.
S Gowrishankar, T G Basavaraju and Subir Kumar Sarkar[7] have studied the effects of various random mobility models on the performance of AODV. Here three mobility models are used namely Random Waypoint, Random Walk with Reflections and Random Walk with Wrapping. Experimental results illustrate that performance of the routing protocol varies across different parameters like number of nodes, packet delivery ratio and end to end delay.
International Journal of Emerging Technology and Advanced Engineering
Website: www.ijetae.com (ISSN 2250-2459,ISO 9001:2008 Certified Journal, Volume 3, Issue 4, April 2013)
579
However, it can cause routing shortcut attacks or detour attacks. They discuss the exploits against two on-demand routing protocols: AODV and DSR. They evaluate the impact of such attacks on the network performance and propose Prevention from Shortcut Attack and Detour Attack (PSD) to mitigate their impacts.III. PROPOSED SOLUTION
A. Overview
In this paper, the performance of swarm based intrusion detection system itself is examined under 3 mobility conditions for the various routing attacks in MANET.
B. SWARM BASED NODE MONITORING STRAREGY[1] AND
PARAMETERS FOR ACTIVE NODES SELECTION
The parameters used to select the active nodes are residual energy, bandwidth, coverage and connectivity and trust which is described in the following sections.
1) Computation of the residual energy
After time t, the energy consumed by the node (E (t)) is computed as follows.
E (t) = Ptx*
+Pre*
(1)Where Ptx = Number of data packets transmitted by the
node after time t, Pre = Number of data packets received
[image:3.598.335.524.242.391.2]by the node after time t,
and
are constants. Its value ranges between 0 and 1.Table-1:
Header fields ant agents used by SBDTs
The residual energy ER of a node at time t, can be calculated using the initial energy as:
ER=Ei–E(t) (2)
2) Residual bandwidth calculation
The residual bandwidth is calculated using the local bandwidth and the minimum bandwidth among the neighboring nodes.
The difference between the local bandwidth BWloc and Bwmin is the residual bandwidth.
3) Trust value (T)
The trust values of the nodes can be estimated from the forwarding behavior of the intermediate nodes. The trust value of a node is decremented if the node does not forward sufficient number of packets or the forwarding delay is high or malicious packets are injected.
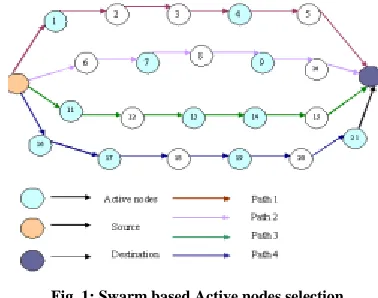
Fig. 1: Swarm based Active nodes selection
The active nodes are adaptively changed depending on the above 3 factors.
4)Coverage and connectivity criteria
For predicting the future state of the network, the mobility is estimated which is defined as follows.
RS
i=
(
)
(
)
1
t
t
Davg
t
Davg
t
i
i
(4)
Davg
i=
n j j i
t
D
n
1 ) , ((
)
1
(5)
D
(i,j) =(
x
i
x
j)
2
(
y
i
y
j)
2(6)
Where RSi represent the relative speed of the nodes
Davgi(t) represent the average distance among the
node i and its neighbors at time t.
n is the number of neighbors of node i
D(i,j)(t) is the distance between node i and node j.
[image:3.598.316.505.478.573.2]International Journal of Emerging Technology and Advanced Engineering
Website: www.ijetae.com (ISSN 2250-2459,ISO 9001:2008 Certified Journal, Volume 3, Issue 4, April 2013)
580
Where ci,j is a direct wireless link between node i and jat time t.
Thus the node connectivity is computed using following equation.
Connectivity =
*RSi +
Zi (8)Where
and
are constants.C. SELECTION OF THE ACTIVE NODES
Swarm intelligence technique based on ant colony optimization (ACO) is used for selecting active nodes. The forward ant agent (FA) establishes the pheromone track to the source node (S), while backward ant agent (BA) establishes the pheromone track to the destination (D).
The header of the ant agents (SBDTs) include the fields which are illustrated in table 1. The procedure for selecting the active nodes is given in following algorithm.
Algorithm :
1)Here three SBDTs are created namely LOW-MOBILITY, HIGH-MOBILITY and
SBDT-HIGH-MOBILITY.
2)In each SBDT, the FA is launched in S and it traverses through all intermediate nodes along the path towards D.
3)FA on reaching every node, computes the parameters residual energy, residual bandwidth, connectivity and trust (as explained in section 3.2.1.1, 3.2.1.2, 3.2.1.3, and 3.2.1.4), and updates its header with the information about the node (as per fig 1).
4)With the gathered information from all the hops, FA reaches D.
5)When FA reaches D, D generates BA and transfers all the information of FA into BA. The BA takes the same path as that of its corresponding FA, but in the reverse direction.
6)The BA updates the header field at the neighboring nodes for all the entries related to the FAs destination node.
7)The BA upon reaching the source delivers the status of all the nodes. The source then selects the nodes with the maximum trust value, residual bandwidth and residual energy as the active nodes. (shown in fig 1 )
8)The steps from 3 to 7 are performed for all three SBDTs mentioned in step 1.
D. Data transmission through secure channel
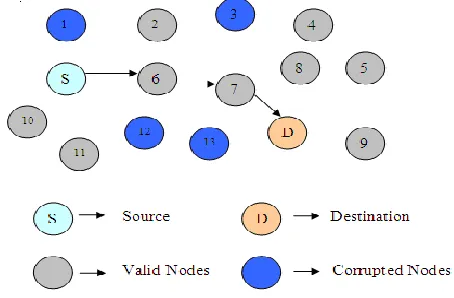
[image:4.598.322.549.239.388.2]In each SBDT, the source node selects the path to the destination such that it contains only the valid nodes. Thereby, our technique provides defense against routing layer attacks.
Figure-2 Secure Data transmission
IV. SIMULATION RESULTS
A. Simulation model and parameters
Here the Network Simulator Version-2 (NS2) is used [14] to simulate our proposed algorithm. In our simulation, the channel capacity of mobile hosts is set to the same value: 2 Mbps. The distributed coordination function (DCF) of IEEE 802.11 for wireless LANs as the MAC layer protocol is used. It has the functionality to notify the network layer about link breakage.
In this simulation, mobile nodes move in a 1000 meter x 1000 meter region for 50 seconds simulation time. The numbers of nodes are varied as 20, 40, 60, 80 and 100. It is assumed that each node moves independently with the same average speed. All nodes have the same transmission range of 250 meters. In this simulation, the node speed is 10 m/s. The simulated traffic is Constant Bit Rate (CBR). The simulation settings and parameters are summarized in table 2.
International Journal of Emerging Technology and Advanced Engineering
Website: www.ijetae.com (ISSN 2250-2459,ISO 9001:2008 Certified Journal, Volume 3, Issue 4, April 2013)
[image:5.598.315.557.120.672.2]581
Table-2: Simulation Settings
B. Performance metrics
We evaluate mainly the performance according to the following metrics.
Average Packet Delivery Ratio: It is the ratio of the number .of packets received successfully and the total number of packets transmitted.
Average-end-to-end Delay:It is the total time delay taken by the nodes to transmit the data to the receiver.
Average Packet Drop: It is the average number of packets dropped by the misbehaving nodes.
4.3 Results A. Based on Nodes
In the first experiment, the number of nodes are varied as 20,40, 60 and 80 and 100 and the attackers are set to 2.
[image:5.598.44.282.147.455.2]
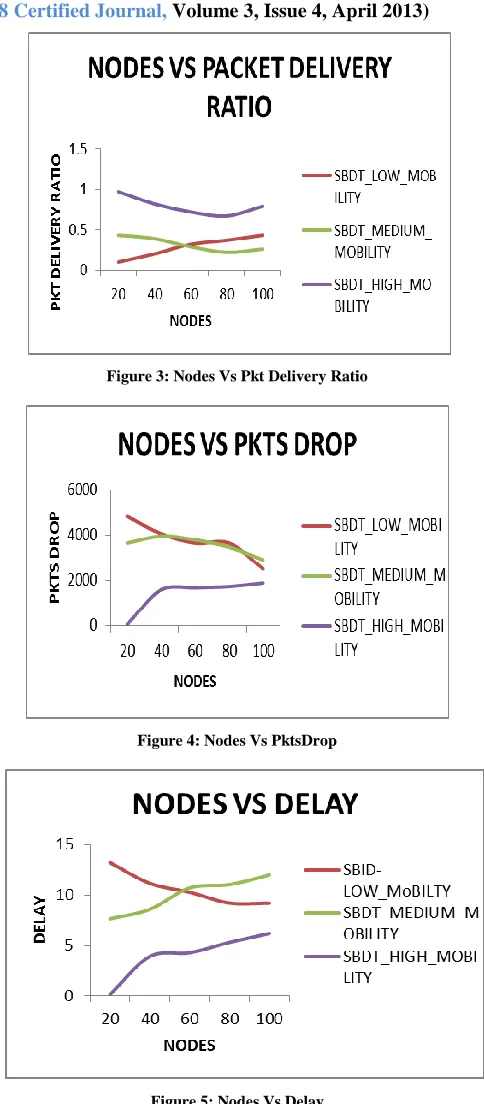
Figure 3: Nodes Vs Pkt Delivery Ratio
Figure 4: Nodes Vs PktsDrop
Figure 5: Nodes Vs Delay
From figure 3, we can see that the packet delivery ratio of SBDT-high-mobility higher than the other two mobility conditions based SBDT techniques.
No. of Nodes 20, 40, 60, 80 and 100.
Area Size 1000 X 1000
Mac 802.11
Radio Range 250m
Simulation Time 50 sec
Traffic Source CBR
Packet Size 512
Speed 10m/s
No. Of Attackers 2,4,6,8 and 10.
Low mobility(pause time) 400 sec
Medium mobility(pause time) 300 sec
[image:5.598.43.285.152.451.2]International Journal of Emerging Technology and Advanced Engineering
Website: www.ijetae.com (ISSN 2250-2459,ISO 9001:2008 Certified Journal, Volume 3, Issue 4, April 2013)
582
From figure 4, we can see that the packets drop of SBDT-HIGH-MOBILITY is lower than the other two existing techniques.From figure 5, we can see that the delay of SBDT-HIGH-MOBILITY is less than the other two techniques.
B. Based on attackers
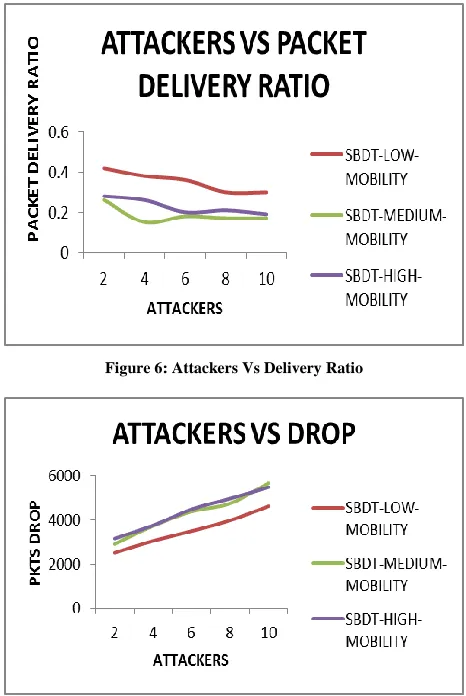
[image:6.598.320.546.128.314.2]In the second experiment we vary the number of attackers as 2, 4, 6, 8 and 10.The total number of nodes is set to 100.
Figure 6: Attackers Vs Delivery Ratio
Figure 7: Attackers Vs Drop
Figure 8: Attackers Vs Delay
From figure 6, we can see that the packet delivery ratio of SBDT-LOW-MOBILITY is higher than the other two existing techniques.
From figure 7, we can see that the packets drop of SBDT-LOW-MOBILITY is lower than the other two existing techniques.
From figure 8, we can see that the delay of SBDT-LOW-MOBILITY is less than the other two existing techniques.
V. CONCLUSION
[image:6.598.48.281.253.601.2]International Journal of Emerging Technology and Advanced Engineering
Website: www.ijetae.com (ISSN 2250-2459,ISO 9001:2008 Certified Journal, Volume 3, Issue 4, April 2013)
583
REFERENCES[1] G.Indirani and K.Selvakumar, “A Swarm Based Efficient Distributed Intrusion Detection System for Mobile Ad hoc Networks MANET)”,International Journal of Parallel, Emergent and distributed systems(Accepted),2013
[2] G.Indirani and K.Selvakumar, “Swarm based Intrusion Detection and Defense Technique for Malicious Attacks in Mobile Ad Hoc Networks”,International Journal of Computer Applications (0975 – 8887),Volume 50– No.19, July 2012
[3] Sureyya Mutlu, Guray Yilmaz, “A Distributed Cooperative Trust Based Intrusion Detection Framework for MANETs”, IARIA Seventh International Conference on Networking and Service, 2011
[4] N.Shanthi, DR.LGanesan and DR.K.Ramar, “Study of Different Attacks on Multicast Mobile Ad Hoc Network”, Journal of Theoretical and Applied Information Technology, 2009
[5] Abhay Kumar Rai, Rajiv Ranjan Tewari, Saurabh Kant Upadhyay, “Different Types of Attacks on Integrated MANET-Internet Communication”, International Journal of Computer Science and Security (IJCSS), 2009.
[6] Lei Guang, Chadi Assi, and Abderrahim Benslimane, “Interlayer Attacks in Mobile Ad Hoc Networks”, Springer, Mobile Ad-hoc and Sensor Networks Lecture Notes in Computer Science Volume 4325, pp 436-448 , 2006.
[7] S Gowrishankar, T G Basavaraju and Subir Kumar Sarkar, “Effect of Random Mobility Models Pattern in Mobile Ad hoc Networks”,IJCSNS International Journal of Computer Science and Network Security, VOL.7 No.6, June 2007.