© 2018, IRJET | Impact Factor value: 6.171 | ISO 9001:2008 Certified Journal | Page 125
BIG DATA – CONCEPTS, ANALYTICS, ARCHITECTURES – OVERVIEW
P.Joseph Charles
1, S. Thulasi Bharathi
2, V.Susmitha
31,2Assistant professor, Department of IT, St. Joseph’s College, Trichy, India, 3II M.Sc., Computer Science, Department of IT, St. Joseph’s College, Trichy
---***---
ABSTRACT: The term, Big Data ‘has been coined to
refer to the gargantuan bulk of data that cannot be dealt with by traditional data-handling techniques. Big Data is still a novel concept, and in the following literature we intend to elaborate it in a palpable fashion. It commences with the concept of the subject in itself along with its properties and the two general approaches of dealing with it. We have entered the big data era. Organizations are capturing, storing, and analysing data that has high volume, velocity, and variety and comes from a variety of new sources, including social media, machines, log files, video, text, image, RFID, and GPS. These sources have strained the capabilities of traditional relational database management systems and spawned a host of new technologies, approaches, and platforms. Big Data (BD) is associated with a new generation of technologies and architectures which can harness the value of extremely large volumes of very varied data through real time processing and analysis.
Keywords: Big Data, 3 V‘s, Hadoop, framework,
architecture.
I. INTRODUCTION
Big data and analytics are “hot” topics in both the popular and business press. Articles in publications like the New York Times, Wall Street Journal and Financial Times, as well as books like Super Crunchers [Ayers, 2007], Competing on Analytics [Davenport and Harris, 2007], and Analytics at Work [Davenport, et al., 2010] have spread the word about the potential value of big data and analytics. recent decades, the increasing importance of data to organisations has led to rapid changes in data collection and management. Traditional information management and data analysis methods ("analytics") are mainly intended to support internal decision processes. They operate with structured data types, existing mainly within the organization. Throughout the history of IT, each generation of organizational data processing and analysis methods acquired a new name. With the launch of Web 2.0, a large amount of valuable business data started being generated beyond the organization by consumers and, generally, by web users. This data can be structured or unstructured, and can come from multiple sources such as social networks, products viewed in virtual stores, information read by sensors, GPS signals from mobile devices, IP addresses, cookies, bar codes, etc.
II.BIG DATA CONCEPTS
“
Every day, we create 2.5 quintillion bytes of data — so [image:1.595.334.544.453.601.2]much that 90% of the data in the world today has been created in the last two years alone. This data comes from everywhere: sensors used to gather climate information, posts to social media sites, digital pictures and videos, purchase transaction records, and cell phone GPS signals to name a few”[1]. such colossal amount of data that is being produced continuously is what can be coined as Big Data. Big Data decodes previously untouched data to derive new insight that gets integrated into business operations. However, as the amounts of data increases exponential, the current techniques are becoming obsolete. Dealing with Big Data requires comp. Big Data can be simply defined by explaining the 3V‘s – volume, velocity and variety which are the driving dimensions of Big Data quantification. Gartner analyst, Doug Laney [3] introduced the famous 3 V‘s concept in his 2001 Metagroup publication, ‗3D data management: Controlling Data Volume, Variety and Velocity‘.
Figure-1: schematic representation of the 3V‘s [4] of Big Data
© 2018, IRJET | Impact Factor value: 6.171 | ISO 9001:2008 Certified Journal | Page 126 temporary solution and better technology needs to be
developed. Smartphones, E-Commerce and social networking websites are examples where massive amounts of data are being generated. This data can be
easily distinguishes between structured data,
unstructured data and semi-structured data.
Velocity: refers to both the speed with which data is produced and that with which it must be processed to meet demand. This involves data flows, the creation of structured records, as well as availability for access and delivery. The speed of data generation, processing and analysis is continuously increasing due to real-time generation processes, requests resulting from combining data flows with business processes, and decision-making processes. The velocity of the data processing must be high, while the processing capacity depends on the type of processing of the data flows; In what now seems like the pre-historic times, data was processed in batches. However this technique is only feasible when the incoming data rate is slower than the batch processing rate and the delay is much of a hindrance. At present times, the speed at which such colossal amounts of data are being generated is unbelievably high.
Variety:
converting large volumes of transactional information into decisions has always been a challenge for IT leaders, although in the past the types of generated or processed data were less diverse, simpler and usually structured. Currently, more information coming from new channels and emerging technologies - mainly from social media, the Internet of Things, mobile sources and online advertising - is available for analysis and generates semi structured or unstructured data. This includes tabular data (databases), hierarchical data, documents, XML, emails, blogs, instant messaging, click streams, log files, data metering, images, audio, video, information about share rates (stock ticker), financial transactions etc.;Implementing Big Data is a mammoth task given the large volume, velocity and variety. ―Big Data‖ is a term encompassing the use of techniques to capture, process, analyze and visualize potentially large datasets in a reasonable timeframe not accessible to standard IT technologies. By extension, the platform, tools and software used for this purpose are collectively called ―Big Data technologies‖. [7] Currently, the most commonly implemented technology is Hadoop. Hadoop is the culmination of several other technologies like Hadoop Distribution File Systems, Pig, Hive and HBase. Etc. However, even Hadoop or other existing techniques will be highly incapable of dealing with the complexities of Big Data in the near future. The following are few cases where standard processing approaches to problems will fail due to Big Data
Large Synoptic Survey Telescope (LSST): Over 30 thousands gigabytes (30TB) of images will be generated every night during the decade –long LSST survey sky.‖ [8]
There is a corollary to Parkinson‘s Law that
states: ―Data expands to fill the space available for storage.‖[9].
This is no longer true since the data being
generated will soon exceed all available storage space.[10][8]
72 hours of video are uploaded to YouTube
every minute.[11]
Variability: refers to how changing the meaning of the data is. This is found especially with natural language processing. Companies have to develop sophisticated programmes which can understand the context and decode the precise meaning of words;
Visualization: refers to how readable and accessible the data presentation is. Many spatial and temporal parameters and relationships between them have to be used in order to obtain something which is easily comprehensible and actionable;
Value: refers to the capacity of the data to bring new insights for creating knowledge.
There are at present two general approaches to big data:
Divide and Conquer using Hadoop:
The huge data set is spreaded into smaller parts and processed in parallel fashion using many servers.
Brute Force using technology on the likes of SAP
HANA: Compress the data set into single unit when the one very powerful server with massive storage
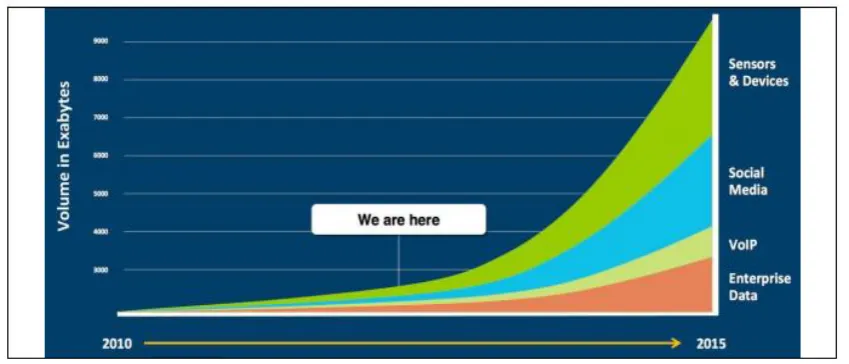
© 2018, IRJET | Impact Factor value: 6.171 | ISO 9001:2008 Certified Journal | Page 127 Figure:2 The Exponential Growth of Big Data
III. BIG DATA ANALYTICS
Big Data Analytics (BDA) is a new approach in information management which provides a set of capabilities for revealing additional value from BD. It is defined as “the process of examining large amounts of data, from a variety of data sources and in different formats, to deliver insights that can enable decisions in real or near real time” [4]. BDA can be used to identify patterns, correlations and anomalies [4], [5]. BDA is a different concept from those of Data Warehouse (DW) or Business Intelligence (BI) systems. Gartner defines a DW as "a storage architecture designed to hold data extracted from transaction systems, operational data stores and external sources. The warehouse then combines that data in an aggregate, summary form suitable for enterprise wide data analysis and reporting for predefined business needs" [6]. BI is defined as "a set of methodologies, processes, architectures, and technologies that transform raw data into meaningful and useful information used to enable more effective strategic, tactical, and operational insights and decision-making" [7]. By itself, stored data does not generate business value, and this is true of traditional databases, data warehouses, and the new technologies for storing big data (e.g., Hadoop). Once the data is appropriately stored, however, it can be analyzed and this can create tremendous value. A variety of analysis technologies, approaches, and products have emerged that are especially applicable to big data, such as in-memory analytics, in-database analytics, and appliances
IV. ARCHITECTURES FOR BD SYSTEMS:
The complexity of BD systems required the development of a specialized architecture. Nowadays, the most commonly used BD architecture is Hadoop. It has redefined data management because it processes large amounts of data, timely and at a low cost.
The Hadoop Framework
Traditional SQL database management systems are no longer suited to manage such large and complex data sets as in BD. When working with large volumes of data we need a solution that allows low cost storage, while also ensuring a good processing performance. One possible solution is the Apache Hadoop software framework.
Hadoop[8] is an open source project developed by Apache which can be used for the distributed processing of large data sets. It runs on multiple clusters using simple programming models. The design of the Hadoop framework ensured its scalability even when tasks are run on thousands of computers, each with its own processing and storage capability.
Since 2010, Hadoop has been widely adopted by organizations for the storage of large volumes of data and as a platform for data analysis. Hadoop is currently used by many companies for which the volume of data generated daily exceeds the storage and processing capacity of conventional systems. Adobe, AOL, Amazon.com, eBay, Facebook, Google, LinkedIn, Twitter, Yahoo are some of the companies using Hadoop.
© 2018, IRJET | Impact Factor value: 6.171 | ISO 9001:2008 Certified Journal | Page 128 Figure:3The Hadoop Ecosystem
The core of Apache Hadoop consists of two components: a distributed file system (HDFS - Hadoop Distributed File System) and a framework for distributed processing (MapReduce) [9]. Hadoop was designed to operate in a cluster architecture built on common server equipment. Given the distributed storage, the location of the data is not known beforehand, being determined by Hadoop (HDFS). Each block of information is copied to multiple physical machines to avoid any problems caused by faulty hardware. Unlike traditional systems, Apache Hadoop provides a limited set of functionalities for data processing (MapReduce), but has the ability to improve its performance and its storage capacity as it is installed on more physical machines. MapReduce processing divides the problem into sub-problems which can be solved independently (the map phase), in the manner of "divide et impera". Each of the sub-problems is executed as close to the data on which it must operate as possible. The results of the sub-problems are then combined
according to needs (the reduce phase). components build the foundation of four layers of the Hadoop Ecosystem, which make up a collection of additional software packages [9], [10].
Data Storage Layer, for storing data in a distributed file system. It consists of:
HDFS: the main distributed storage.
HBase: a NoSQL column-oriented distributed database based on the Google BigTable model which uses HDFS as storage media. It is used in Hadoop applications which require random read / write operations on very large data sets, or for applications which have many clients. HBase has three main components: a client library, a master server, and several region servers.
YARN - a resource management platform which
ensures security and data governance on different clusters.
Hive - a data storage platform (DW) used for querying and managing large data sets from distributed storage. Hive uses a SQL query language named HiveQL;
Avro - serializes the data, manages remote
procedure calls and exchanges data from one program or language to another. Data is saved based on its own schema because this enables its use with scripting languages such as Pig;
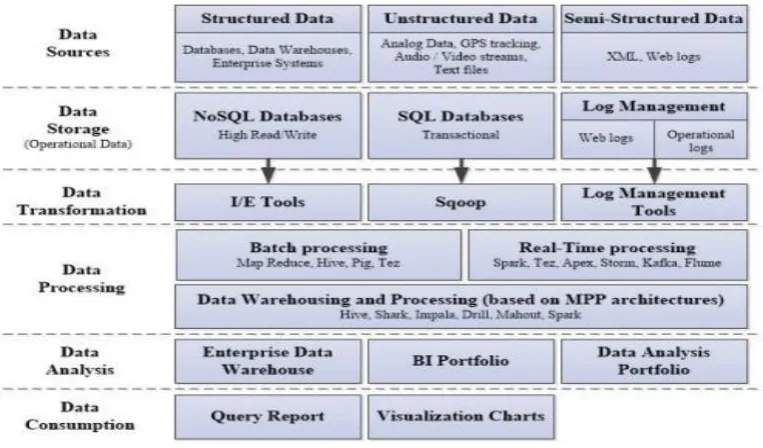
[image:4.595.102.484.518.742.2]© 2018, IRJET | Impact Factor value: 6.171 | ISO 9001:2008 Certified Journal | Page 129 Data sources: the emergence of tables which are stored
in the Cloud and of mobile infrastructures has led to a significant increase in the size and complexity of data sets. The data integration ecosystems must thus include multiple strategies for the access and storage of a huge quantity of very varied data. The following classification can be made:
Data storage: the data collected is stored in NoSQL/SQL databases, or Log Management systems for logs;
Data Transformation: in order to load data into the processing phase, it must first be transformed by using: import/export tools (SQL/NoSQL vendor specific tools), Sqoop (data source to Hadoop data transformation tool), Log management tools;
Data Processing: both structured and unstructured data are combined so that batch processing or real-time processing can be performed. Data Warehousing and Processing then generate usable data for data consumption.
Data Analysis: can be performed using: DWs: ensure
the necessary basic information. New functionality
must be added for the better integration of unstructured data sources and for satisfying the level of performance required by analysis platforms. In order to perform strategic decisions, operational analysis has to be separated from deep analysis, which makes use of historical data.
Data Consumption: the results of the data analysis have to be presented is a readable and accessible form to the final users. Query reports or visualisation charts can be used.
[13]http://www.internetlivestats.com/google-search-statistics/
REFERENCES:
[1] J. Gantz, D. Reinsel, "Extracting value from chaos", IDC iView, 2011, pp 1–12.
[2] E. Mcnulty, "Understanding Big Data: The Seven V’s", Dataconomy, May 22, 2014.
[3] Gartner, "Big Data Strategy Components: Business Essentials", October 9, 2012.
[4] Gartner, "IT glossary: big data" [webpage on the Internet]. Stamford, CT; 2012.
[5] Canada Inforoute, "Big Data Analytics in health", White Paper, Full Report, April 2013
[6] A. Alexandru, D. Coardos, "BD in Tackling Energy Efficiency in Smart City", Scientific Bulletin of the Electrical Engineering Faculty, vol. 28, no. 4, pp. 14-20, 2014, Bibliotheca Publishing House, ISSN 1843-6188.
[7] Arthur G. Erdman∗, Daniel F. Keefe, Senior Member, IEEE, and Randall Schiestl, Applying Regulatory Science and Big Data to Improve Medical Device Innovation, IEEE TRANSACTIONS ON BIOMEDICAL ENGINEERING, VOL. 60, NO. 3, MARCH 2013
[8] http://lsst.org/lsst/google
[9] http://en.wikipedia.org/wiki/Parkinson‘s_law
[10] http://www.economist.com/node/15557443
[11]http://www.youtube.com/t/press_statistics/? hl=en
![Figure-1: schematic representation of the 3V‘s [4] of Big Data](https://thumb-us.123doks.com/thumbv2/123dok_us/8140951.799514/1.595.334.544.453.601/figure-schematic-representation-v-s-big-data.webp)